

 Customer Reviews
If people could eat data instead of food, we could end world hunger with enough spare data left over to tackle 3 famines.
This startling but obvious statement underscores the abundance of data available to the human race today and the humungous rate at which it has grown in our digital age. Just as sustenance nourishes our bodies, data fuels our intellect, satiating the hunger for insights and understanding.
Data is the foundation upon which the structure of information stands tall. Imagine gazing at a puzzle's scattered pieces – each is important, might be beautiful and vital, but the true picture emerges only when the pieces interlock. Similarly, data is the root of knowledge for today’s businesses. Our new Data Analysis Templates are the masterful hands that bring all that scattered knowledge and wisdom together.
These PPT Presentations emerge as essential companions in a landscape where accurate decision-making means the difference between thriving and surviving. Understanding data is pivotal in the symphony of business strategies, marketing endeavors, and research pursuits.
The 100% customizable nature of the templates provides you with the desired flexibility to edit your presentations. The content-ready slides give you the much-needed structure.
Let’s explore!
Template 1: Data Analysis Process PPT Set
Use this PPT Set to help stakeholders understand difficulties that mar the data analysis process and gain valuable insights. Explore the crucial stages of data analysis, from establishing data requirements and efficient data collection to thorough data processing and cleaning. This PPT Design highlights the often underestimated yet pivotal phase of data cleaning. With this template, you'll understand how data lays the foundation for seamless analysis, leading to more accurate results and impactful communication. Download now!

Template 2: Data Analysis Business Evaluation Process for Visualization and Presentation
This holistic PPT Bundle guides you through the complex stages of visualization and presentation while offering a profound understanding of each crucial phase. Use this presentation template to understand the essence of successful data analysis, as it breaks down the process into digestible segments. From the initial steps of business issue comprehension and data understanding to data preparation, exploratory analysis, monitoring, validation, and finally, captivating visualization and presentation – every facet is covered. This PPT Preset goes beyond mere process explanation, offering a robust framework for the holistic development of data conceptualization, collection, analysis, and cleaning procedures. Get it today!

Template 3: Data Requirement Analysis PPT Bundle
Navigating challenges of problem-solving, prioritization, and data insight, this PPT Presentation presents a strategic roadmap that transforms raw information into actionable intelligence. It starts with a deep dive into the heart of your business challenges. Focusing on defining the core problems, this presentation template guides you through the process of setting priorities, ensuring every move is a step closer to your objectives. Data collection, a crucial cornerstone, is explained through insightful visual aids and organized segments. Witness the transformation of disparate data points into a coherent narrative, empowering you to decipher trends, anomalies, and opportunities.
This PPT Template equips you with the tools to not only gather data but also comprehend its implications, turning information into true knowledge. Navigating the challenges of data requirement analysis is no longer a daunting task. From security gaps that demand attention to complex data systems that require expertise, our template ensures you're prepared to overcome these hurdles with confidence. The high costs that often come with data analysis are confronted head-on, unraveling budget-friendly strategies that don't compromise on quality. Get this template today!

Template 4: Big Data Analysis PPT Set
This comprehensive PPT Deck presents a pre-made Big Data Analysis funnel that guides you through the rather complex process of turning data into gold. Gain a competitive edge by understanding effective data analysis techniques of association rule learning, classification tree analysis, genetic algorithm, regression analysis, and sentiment analysis. It's more than a run-of-the-mill PPT Presentation; it's a transformative tool. Invest in a big data analysis PPT like resource that's not just about graphs and numbers; get it now. Download now!

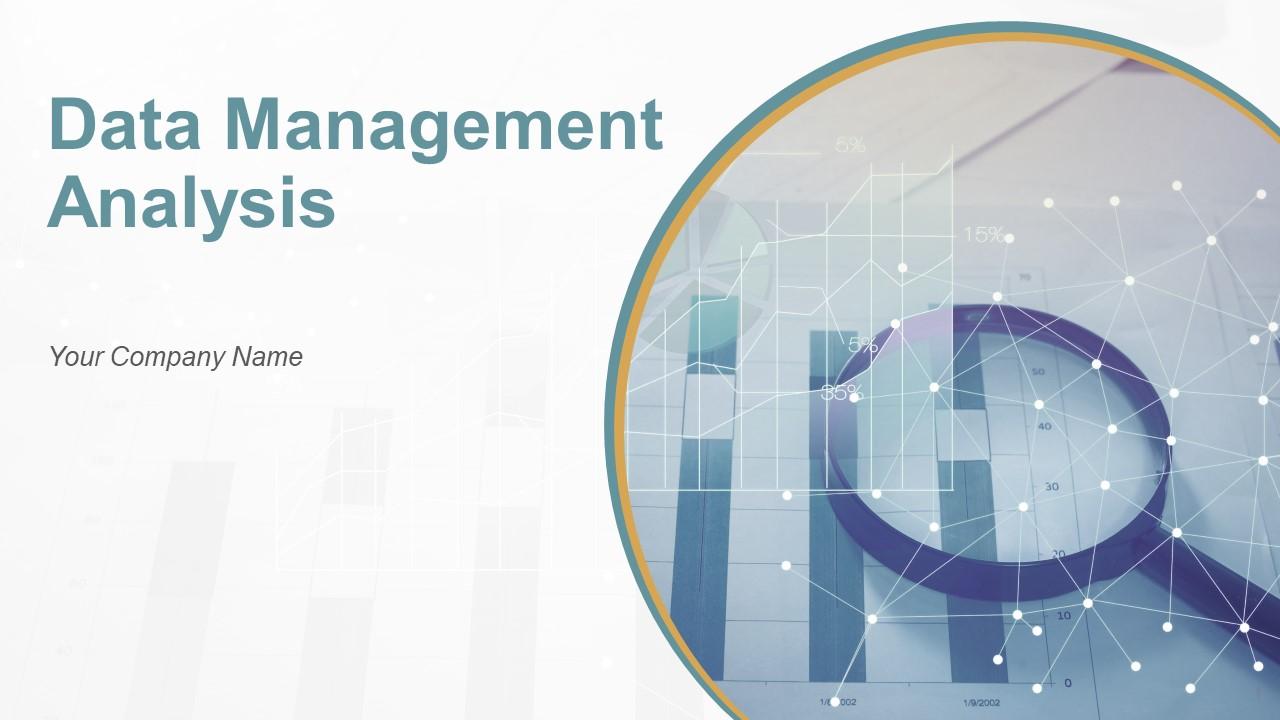
Template 5: Data Management Analysis PPT Framework
For achieving business excellence, the quest for efficient and time-saving solutions is a universal endeavor. Recognizing your aspirations, we present the Data Management Analysis PowerPoint Presentation — an invaluable asset for seamless change management and effective data analysis. It incorporates PPT Slides designed to provide an effortless avenue for embracing change management and conducting incisive data analysis. It offers a cohesive platform for centralizing your objectives, ready to be shared with your team. The judicious use of text boxes empowers you to articulate your perspectives with precision on each pertinent subject. Download today!
Template 6: Predictive Data Analysis PPT Layout
Get this PPT Preset to consolidate your stakeholder's grasp on predictive analytics, a discipline that uses statistical methodologies, cutting-edge machine learning algorithms, and a suite of tools to dissect historical data. This PPT Layout guides you through a well-structured journey, unfolding the essentials of predictive analytics, its foundational framework, and a suite of models that constitute its core. The significance of predictive analytics takes center stage, underscored by its multifaceted applications. Additionally, this resource has an Estimation Model PPT Slide, which explains the key tenets of diverse predictive analytics tools and their closely-knit workflows. The demarcation between the four pivotal categories of advanced analytics in this PPT deck receives careful attention. It sheds light on predictive analytics models – from classification to clustering models and beyond. Download now!

Template 7: Dashboard For IT Operations Data Analysis
This PPT Template Dashboard is a dynamic representation of your operational landscape. This PPT Set helps track the total number of cases from inception to resolution. Visualize trends with a graph showcasing the weekly ebb and flow of opened and closed cases. Prioritize effectively, allocating resources where they matter most, as the presentation template depicts it across departments. Efficiency meets clarity as you explore the time distribution of tickets on a day-by-day basis. Gain a better understanding of workflow patterns and resource utilization. Analyze open case statuses, fostering an environment of proactive response and swift action. Download now!

Template 8: Quarterly Sales Data Analysis Report
Visualize your progress with ease using this PPT Template's intuitive presentation of monthly sales data. Get a clear view of team-wise statistics that showcase individual contributions, fostering a culture of recognition and growth. Uncover finer details through the nuanced comparison of total versus actual sales values, empowering you to identify trends and opportunities. Engage stakeholders in strategy evaluation as you assess team goals versus actual achievements. Pinpoint areas of excellence and those warranting attention, refining your approach. Download now!

Template 9: Real-Time Marketing Data Analysis
Here's a dynamic marketing analysis tool blending insights and aesthetics. It presents a pie chart comparing planned vs. actual budgets while diving deep into sections showcasing real-time marketing benefits: Elevated customer experiences, surging conversions, enhanced retention, and refined brand perception. Navigate budget allocation through intuitive bar graphs. Improve your strategy with data symphony, moving a step closer to success through informed choices. Download now!

Template 10: Data Analysis Process for Visualization and Presentation
Embark on a data-driven journey with this PPT Set. Learn the process of Data Analysis, Visualization, and Presentation to address complex business challenges. This PPT Design walks you through these stages, from issue identification and data preparation to exploratory analysis modeling. Witness raw data transform into insights through rigorous validation. Culminate in captivating visualizations and masterful presentations, setting new standards for impactful communication. Download now!

Bridging Numbers and Narratives: Your Journey Through Data Analysis
In a world where data weaves the fabric of progress, our journey through this blog comes to an inspiring end. As you venture into data analysis armed with our templates, remember that each graph, each layout, and each piece of information is a brushstroke on the canvas of understanding. With every mouse click, you’re not just navigating slides; you're charting the course for informed decisions, breakthrough discoveries, and transformative strategies.
FAQs on Data Analysis
What is data analysis?
Data analysis involves inspecting, cleansing, transforming, and modeling data to derive meaningful insights, draw conclusions, and support decision-making. It encompasses various techniques, including statistical methods, machine learning, and visualization, to uncover patterns, trends, and relationships within datasets.
What are the four types of data analysis?
There are four main types of data analysis:
- Descriptive Analysis: This type of analysis focuses on summarizing and describing the main features of a dataset. It involves statistical measures such as mean, median, mode, range, and standard deviation. Descriptive analysis aims to clearly understand the data's characteristics but doesn't involve drawing conclusions or making predictions.
- Diagnostic Analysis: Diagnostic analysis involves digging deeper into data to understand why certain patterns or outcomes occurred. It aims to identify the root causes of specific events or trends. Techniques used in diagnostic analysis often include data visualization, exploratory data analysis, and statistical tests to uncover relationships and correlations.
- Predictive Analysis: Predictive analysis involves using historical data to predict future events or outcomes. This type of analysis uses statistical models, machine learning algorithms, and data mining techniques to identify patterns and trends that can be used to forecast future trends. It's widely used in finance, marketing, and healthcare for making informed decisions.
- Prescriptive Analysis: Prescriptive analysis goes beyond predicting future outcomes. It provides recommendations or solutions for specific situations based on historical and current data analysis. This type of analysis considers different possible actions and their potential outcomes to guide decision-making. Prescriptive analysis is often used in complex scenarios involving multiple variables and options.
Where is data analysis used?
Data analysis is used in a wide range of fields and industries, including but not limited to:
- Business: Analyzing customer behavior, market trends, and financial performance.
- Healthcare: Analyzing patient records, medical research data, and disease trends.
- Science: Analyzing experimental results, simulations, and observations.
- Finance: Analyzing investment trends, risk assessment, and portfolio management.
- Marketing: Analyzing campaign effectiveness, consumer preferences, and market segmentation.
- Social Sciences: Analyzing survey data, demographic trends, and human behavior.
- Sports: Analyzing player performance, game statistics, and strategy optimization.
What is the main tool for data analysis?
There isn't a single "main" tool for data analysis, as the choice of tools depends on the specific tasks and the preferences of the analyst. However, some widely used tools for data analysis include:
- Spreadsheet Software: Like Microsoft Excel or Google Sheets, used for basic data manipulation and visualization.
- Statistical Software: Such as R and Python's libraries (e.g., pandas, numpy, scipy), used for in-depth statistical analysis and modeling.
- Data Visualization Tools: Like Tableau, Power BI, or matplotlib/seaborn in Python, used to create visual representations of data.
- Database Management Systems (DBMS): Such as SQL-based systems for querying and managing large datasets.
- Machine Learning Libraries: Such as scikit-learn, TensorFlow, and PyTorch for building predictive models.
Why is data analysis important?
Data analysis is crucial for several reasons:
- Informed Decision-Making: It provides insights that help individuals and organizations make informed decisions based on evidence rather than intuition.
- Identifying Patterns and Trends: It helps to uncover hidden patterns, trends, and correlations in large datasets that might not be apparent on the surface.
- Problem Solving: Data analysis aids in solving complex problems by providing a structured approach to understanding and addressing issues.
- Improving Efficiency and Performance: It allows businesses to optimize processes, improve efficiency, and enhance performance based on data-driven insights.
- Innovation and Research: Data analysis is essential in scientific research and innovation, helping to validate hypotheses and drive discoveries.
- Competitive Advantage: Organizations that effectively use data analysis gain a competitive edge by better understanding their customers, markets, and internal operations.
- Risk Management: Data analysis enables better risk assessment and management by identifying potential issues or anomalies early on.
- Resource Allocation: It helps allocate resources effectively by understanding where investments are most likely to yield positive outcomes.