Quarterly Business Review (QBR) comes calling after everything 3 months. It’s time for the manager to review the team’s performance in the last quarter. That means, aggregating the performance of all the sales reps and compare the last quarter numbers with previous quarters. But that’s just one half of an effective QBR.
The other and more important half is to analyse why the performance was better or poor and to develop strategies for the next quarter. Since it is the sales team that religiously follows this exercise, the terms Quarterly Business Review and Quarterly Sales Review are interchangeably used.
Sadly, most managers and CEOs do not leverage the full potential of their quarterly reviews and reduce it to a reporting exercise. The presentations are just a dull affair with slides full of numbers delivered in a reprimanding tone if the performance has dipped.
QBR does not have to be boring or a redundant exercise. Not if the presentation is done in the right manner and the slides include all data visualization tools to show the performance trends and analysis. It will then yield following benefits to your team and the organization:
Advantages of Doing a Quarterly Business Review:
- Assess the performance of each member and team as a whole
- Identify the winning strategies
- Understand the bottlenecks that resulted in lost deals
- Chart a new course of action or follow the old process with modifications
- Set a challenging yet realistic target for the next quarter
- Analyse the need to hire more sales representatives
- Spot new competitors in market and their effect on your business
- Ensure that all team activities are aligned with company goals
- Encourage the team to meet the targets for the new quarter
Essential Slides You Need in Your Quarterly Business/Sales Review PPT:
Data is the heart and soul of the QBR presentation. But what does that data show: is the graph going up or down? How does it compare to the previous quarter and the same quarter last year? Let all team members get the big picture at a glance using slides that show and tell. Here are the slides that you should be including in your Quarterly Business Review Presentation:
P.S. Download Ready-Made, Editable Quarterly Sales Review PPT to Save Time
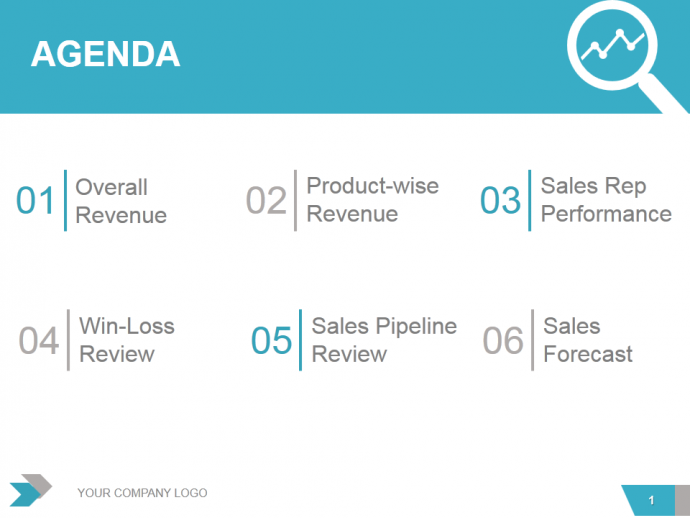
Essential Slide #1- Agenda Slide
Let your attendees know exactly what they are going to expect from your presentation.
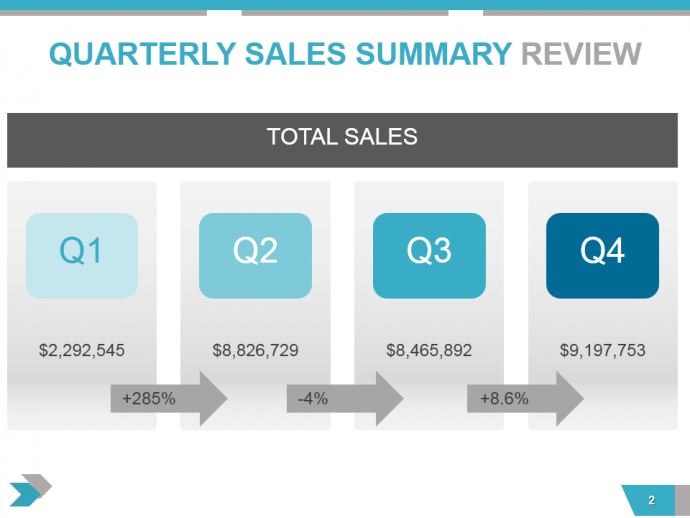
Essential Slide #2- Quarterly Sales Summary
Supposingly your Quarter 4 has ended. Do not keep the suspense for long. Show the numbers right away, not just of this quarter but also how it stands vis a vis the last three quarters. Needless to say, this is the most crucial slide of your Quarterly Business Review presentation. The product-wise sales breakdown can be done in the next slide. This slide is meant to show the team’s performance in the last quarter as a whole.
Besides the total numbers, the percentage increase in each quarter also gives an estimate of how substantial is the profit margin or how low has been the dip in performance.
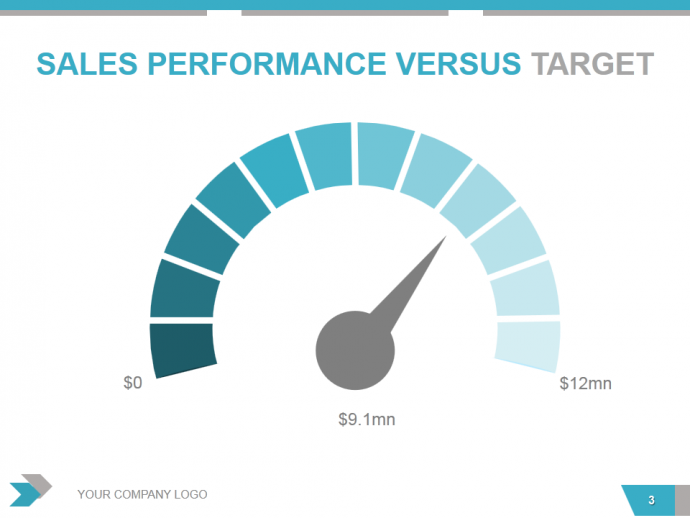
Essential Slide #3- Sales Performance versus Target
The marginal growth in sales might be satisfying but how does it compare to the target set for the quarter? The CEO, VP of Sales, and even the sales team need to see how close they reached to their team target. If your target was set at $12 million and your total sales closed this quarter at $9.1 million, you need to analyse the factors that prevented you from reaching the goals and if the goal was an unrealistic one in the first place:
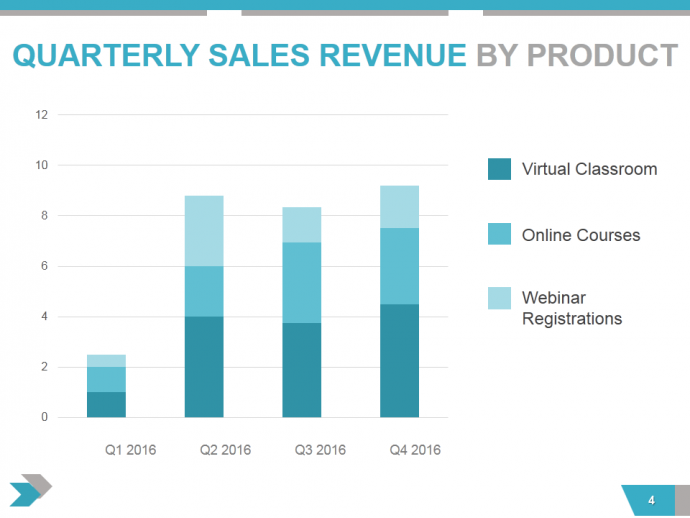
Essential Slide #4- Quarterly Sales Revenue by Product
You can now dive deeper into the data and analyse the sales figures of products. Which product performed the best and which one the worst? Is there a demand for a particular product? Has there been a sudden change in the trend?
A look at the column chart of product sales below clearly shows that like previous quarters, Virtual Classroom brought in the maximum sales in Quarter 4 and there was a slight improvement as compared to Quarter 3. The other two products, Online Courses and Webinar Registrations, also showed a slight growth as compared to the last quarter. However, in both Quarter 3 and 4, the Webinar Registrations recorded lower sales than Q2. As a manager, you need to analyse the reasons for this performance? What different did they do in Q2? Are there new competitors in the webinars segment that are putting a dent in your share? This slide helps you modify your strategies for the upcoming quarter.
Essential Slide #5- Sales Rep Performance Scorecard
If your sales team is a small one, you can have a Sales Rep Performance Scorecard for each team member and analyse their performance. The scorecard can help you measure their performance on key activities versus the team average. There may be areas where the sales rep could have performed exceedingly well and areas where he/she might have performed below average. Identifying the strengths and weaknesses allows the sales manager to help sales rep in their weak areas and boost their morale.
Where the sales team is large running into hundreds, you may have a table with the aggregate score of each sales rep. The top performers have to be rewarded for their efforts. The objective of performance analysis of each sales rep is to build healthy competition amongst the team, inspire the reps to outdo their last performance as well as the top performers’, and set high but realistic expectations for the next quarter.
If the sales reps are giving individual presentations on their quarterly performance, they may also include a Sales Rep KPI Tracker to show the results of their activities. A sales manager can also use a KPI tracker slide to aggregate the results of a particular activity like calls made versus demos booked.
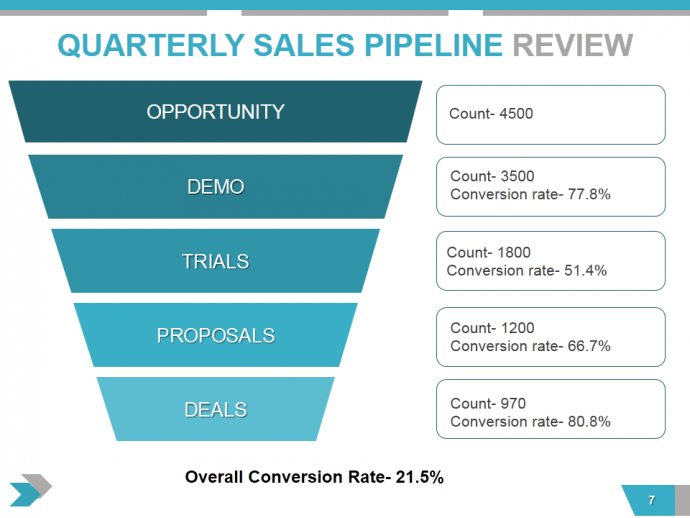
Essential Slide #6- Quarterly Sales Pipeline Review
All sales managers and owners continually manage their sales pipeline to help sales reps close in more deals and ultimately maximize their sales revenue. Using advanced CRM softwares, managers keep track daily how the sales reps are performing, where is the sales cycle slowing down and so on. At your QBR meeting, you have to present a report on how the sales pipeline contributed to total sales last quarter. The CEO and decision makers are able to glean actionable insights from this report.
For instance, why weren’t sales managers able to convert majority of the prospects who went in for demos into trials? The sales reps can share the feedback given by prospects at this stage. Probably customers were looking for a feature in your product that you did not offer. Or the quality of training needs to be improved. All these factors can help you come up with better strategies for the next quarter and achieve higher conversion rates and business revenue.
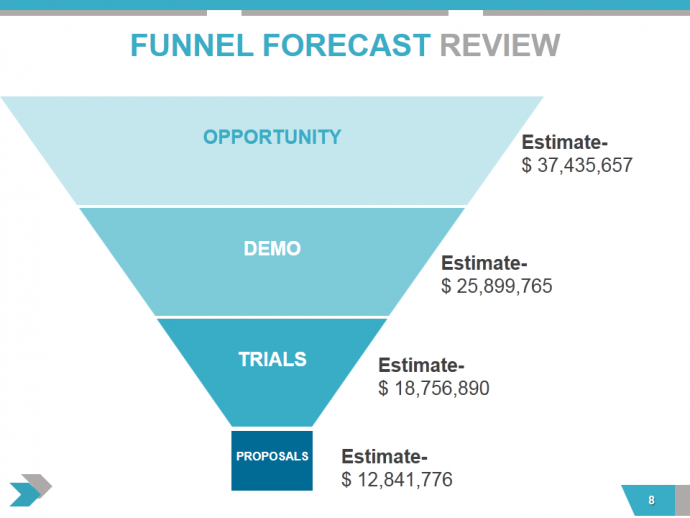
Essential Slide #7- Pipeline Forecast Review
We now come to the second most important half of an effective QBR: preparing for the next quarter. The CEO would want to know- How healthy is your current pipeline? Do you have enough opportunities in hand to meet the next quarter sales targets? How many new opportunities did the sales team source? The more the opportunities you will have for the next quarter, more the number of conversions you can expect and more the sales revenue.
You can also assign estimated value of the deals at different stages of the pipeline and the total estimated value of the sales pipeline.
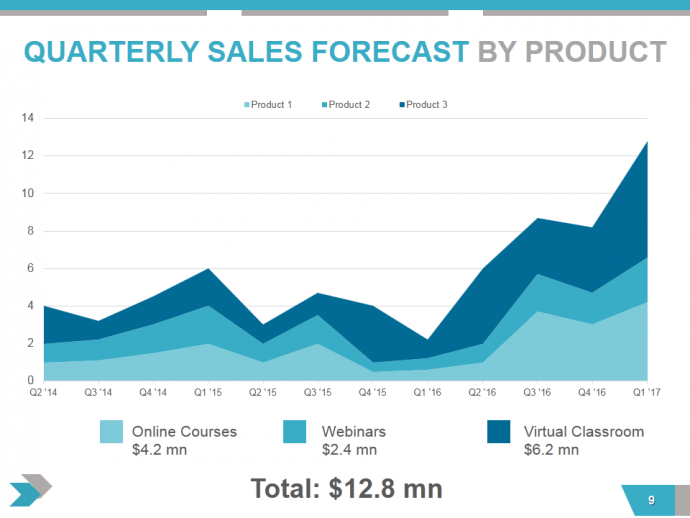
Essential Slide #8- Quarterly Sales Forecast by Product
You can now provide the CEO an estimate of sales revenue product-wise and compare the same to the last quarters. These are the goals you are setting for the new quarter. Let's assume we are forecasting for Quarter 1, 2017:
These were some of the essential slides shown for reference purposes. Of course, you can include slides like key sales initiatives, pipeline quality, win-loss review, channel KPIs, competitive analysis, and so on.
Access the complete outline of Quarterly Sales Review by clicking the below link:
Pre-designed Quarterly Sales Review Presentation
Hey, don’t forget to check out a related presentation on Quarterly Business Review (including pre-designed slides on value proposition canvas, customer usage cases, completed, outstanding and new items and many more):
Quarterly Business Review PPT (Alternate Deck)
How can the qbr template ppt be made better? Share with us your suggestions in the comments below.


 Customer Reviews




![[Updated 2023] How to Design The Perfect Product Launch Presentation [Best Templates Included]](https://www.slideteam.net/wp/wp-content/uploads/2016/10/How-to-create-the-perfect-product-launch-presentation-updated-for-2021-1001x436-1-493x215.png)
![How to Design the Perfect Service Launch Presentation [Custom Launch Deck Included]](https://www.slideteam.net/wp/wp-content/uploads/2016/10/Designs-to-Create-the-Perfect-Service-Launch-PPT-335x146.png)


