

Quarterly business review powerpoint presentation slides


Try Before you Buy Download Free Sample Product
 Impress Your
 Audience
Editable
of Time


Here is a content ready Quarterly Business Review PowerPoint presentation having 79 slides to help you with your business review PPT. To save you time and the trouble of making an important presentation from scratch, here we have come up with readymade presentation related to your topic. In this quarterly business review PPT example, we have included a quarterly highlight, financial summary, key developments, balance sheet, cash flow statement, key financial ratios, funding updates, top customers & vendors, top debtors & creditors, project updates, competitor analysis, etc. You can also use this complete business review PowerPoint sample slide with related topics 30-60-90-day plan, product roadmap, Phases of Implementation, Major Roadblocks or Obstacles, SWOT analysis, CSR, customer services benchmarking, org chart, goals and success matrix, scorecard and many more. This is the most suitable QBR PPT designs for middle and top-level management. This professionally pre-designed quarterly business review presentation graphics are available to download. Our Quarterly Business Review Presentation Slides are truly out of this world. Just click download button and be a hero among your peers. Enable folks to infer the correct facts with our Quarterly Business Review Powerpoint Presentation Slides. It helps elaborate on the circumstances.
People who downloaded this PowerPoint presentation also viewed the following :
Content of this Powerpoint Presentation
Every business owner wants to run a successful business and be able to identify shortcomings and gaps to build innovative strategies to achieve the desired goals. Imagine having an easy track of what is happening in a business and recognizing what needs brushing up and improvement in minutes. That’s interesting, isn’t it?
In the upcoming paragraphs, you will be guided through the creative PowerPoint Templates for quarterly business reviews. By the end, you will be enlightened about innovative ways to conduct business reviews through creative visuals. These creative visuals are captivating and absolute time and energy savers.
Some critical benefits are tied to the business review process, which includes access to the business's performance, formulation of new strategies, knowledge of the pace of the business, wrong steps taken, and informed decisions to alter them. A company can improve its products or services through timely business reviews and build strong relationships with customers.
A quick overview of these quarterly business review PPT templates
This presentation contains attractive visuals and excellent graphics to demonstrate your company's quarterly business review. You can highlight the business overview, financial performance, updates on clients and projects, future strategies, revenue split through different channels, milestones achieved, and important components that need to be considered for a business review.
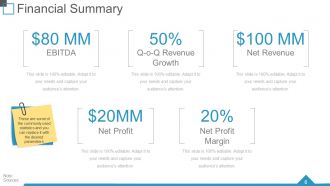
Template 1: Financial Summary
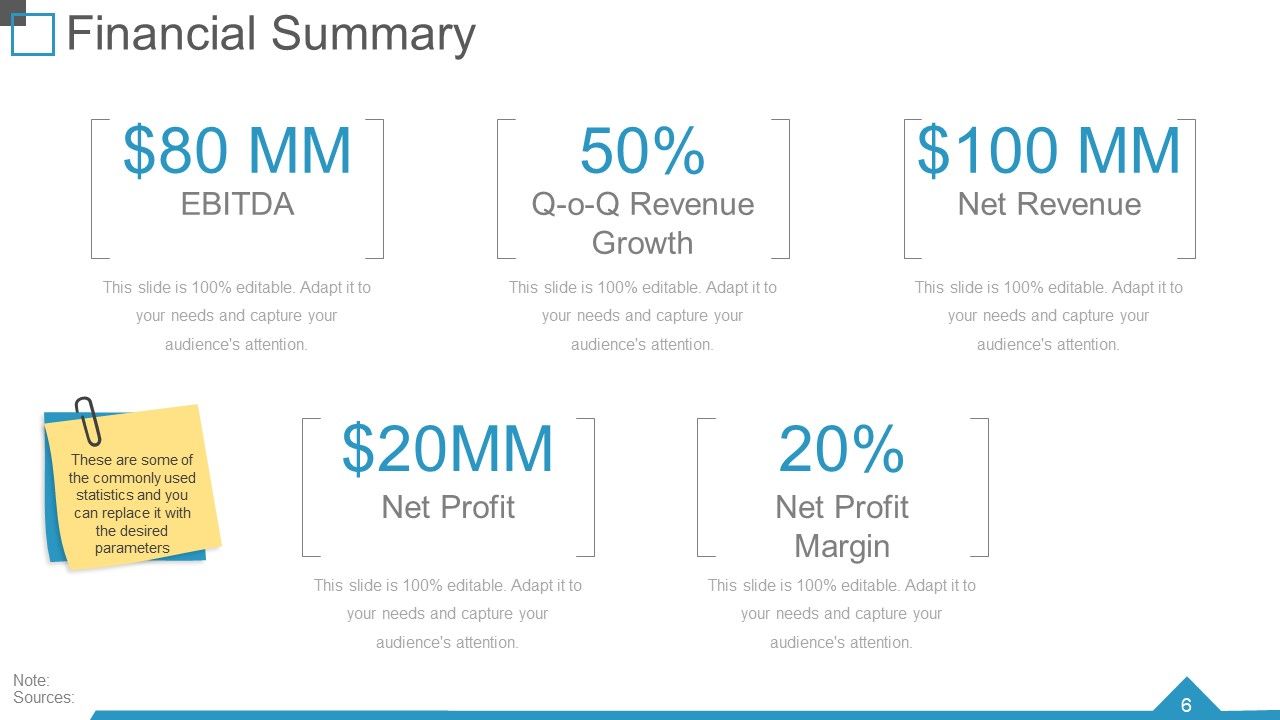
Demonstrating the financial summary will make your business review informative and data-driven. This customizable template adds EBITDA, quarter-on-quarter growth, net revenue, net profit, and net profit margins. All these details are essential to knowing where a business stands, and you can successfully mention them through this template. It is designed creatively and engagingly so that you can create and communicate the critical financial details in a minute.
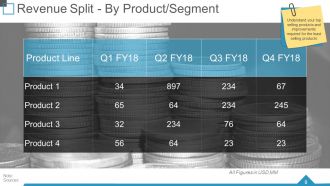
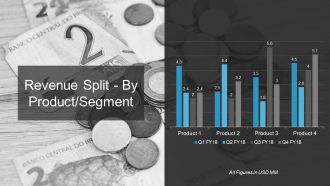
Template 2: Revenue Split by Product/ Segment
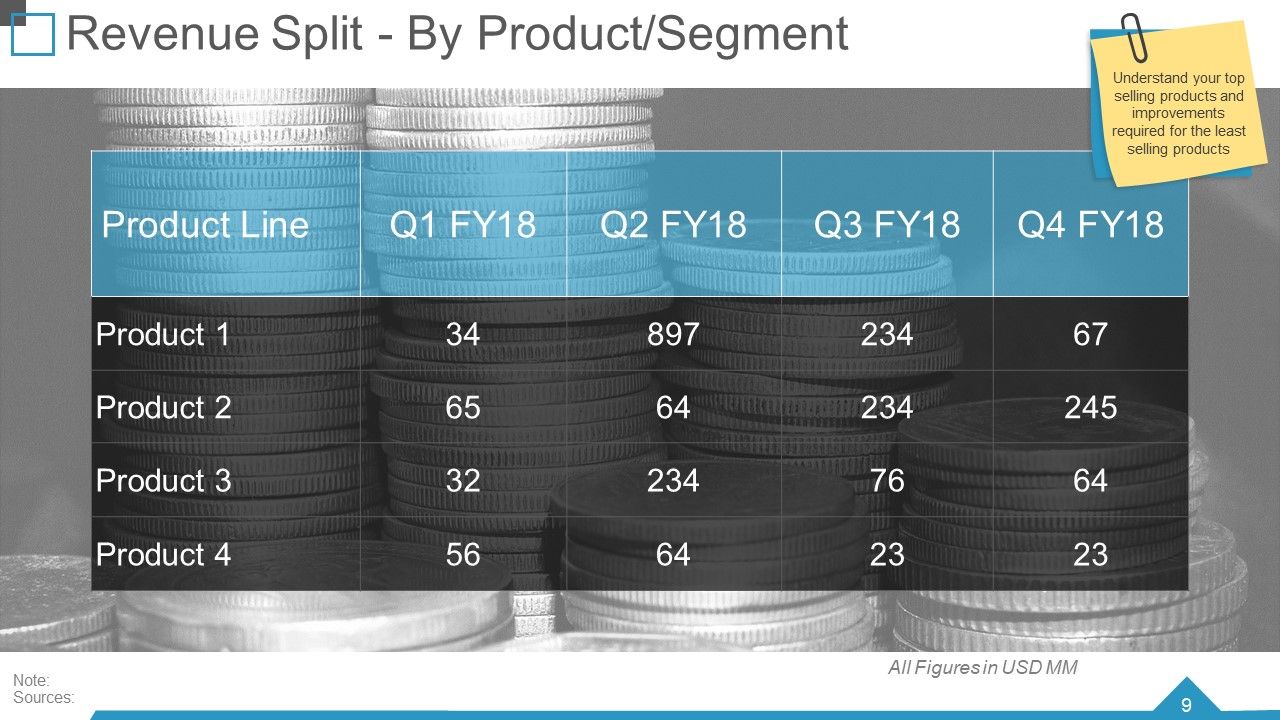
Stating revenue splits of various products is an effective strategy for the growth of a business. Dividing the revenue of various products has been made accessible through this template. With the help of a chart, it is easy to know how much revenue comes from which product. You can examine the revenue of 4 products and identify the profitable products. This template will make pricing, inventory management, and formulating strategies easy.
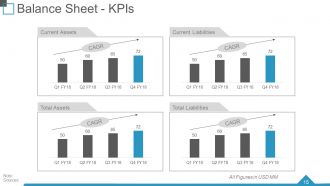
Template 3: Balance Sheet- KPIs

Our customizable template makes snapshots of a company’s financial position easy. This slide will help demonstrate the current assets, total assets and liabilities of a specific year. Graphics and charts help you evaluate the business's performance and financial health, make strategies, and benchmark it; strategic and informed decisions can be made easily.
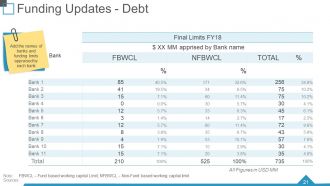
Template 4: Funding Updates-Debt
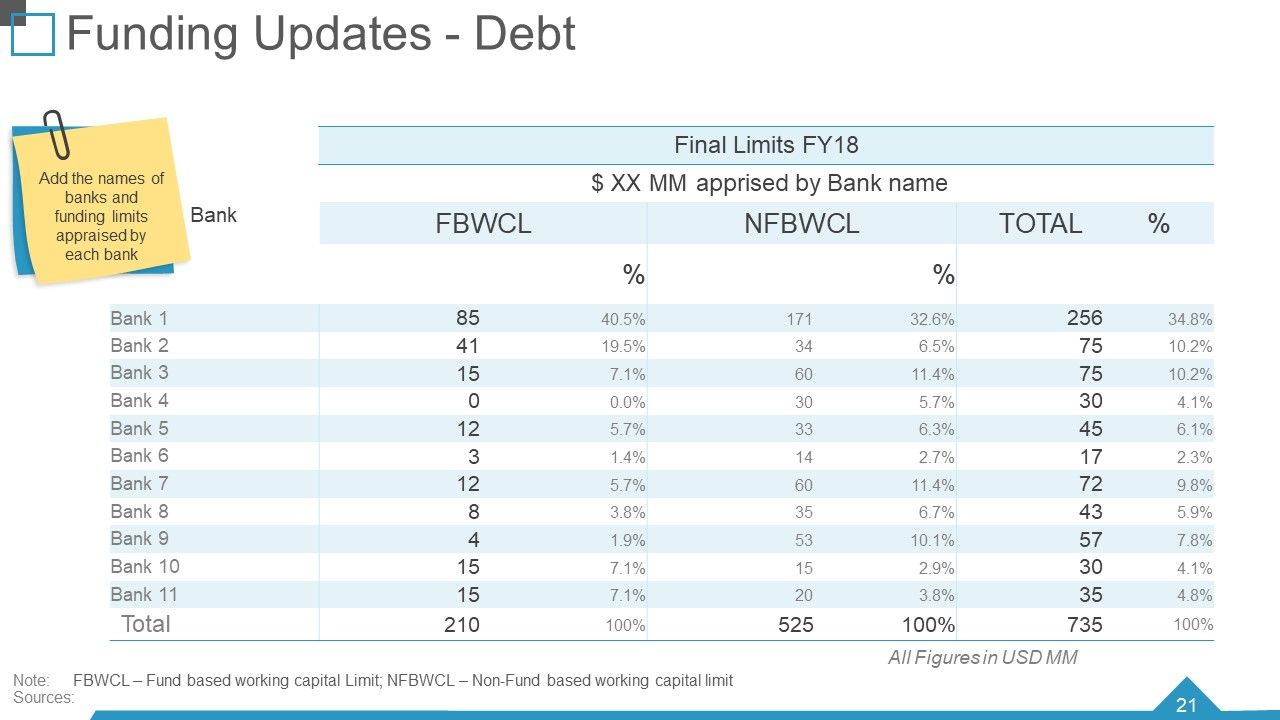
Tracking how much you owe to different banks or sources on what interest is another crucial component of the business review process. This template allows you to demonstrate the funds you owe to banks on what interest rates. This customizable template allows you to enter the information according to your business needs and requirements. It will help you know the operational capacity and the need for more financial money to raise to run the business.
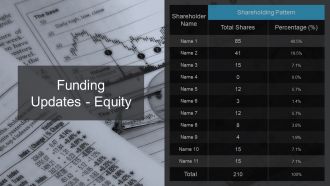
Template 5: Funding Updates-Equity
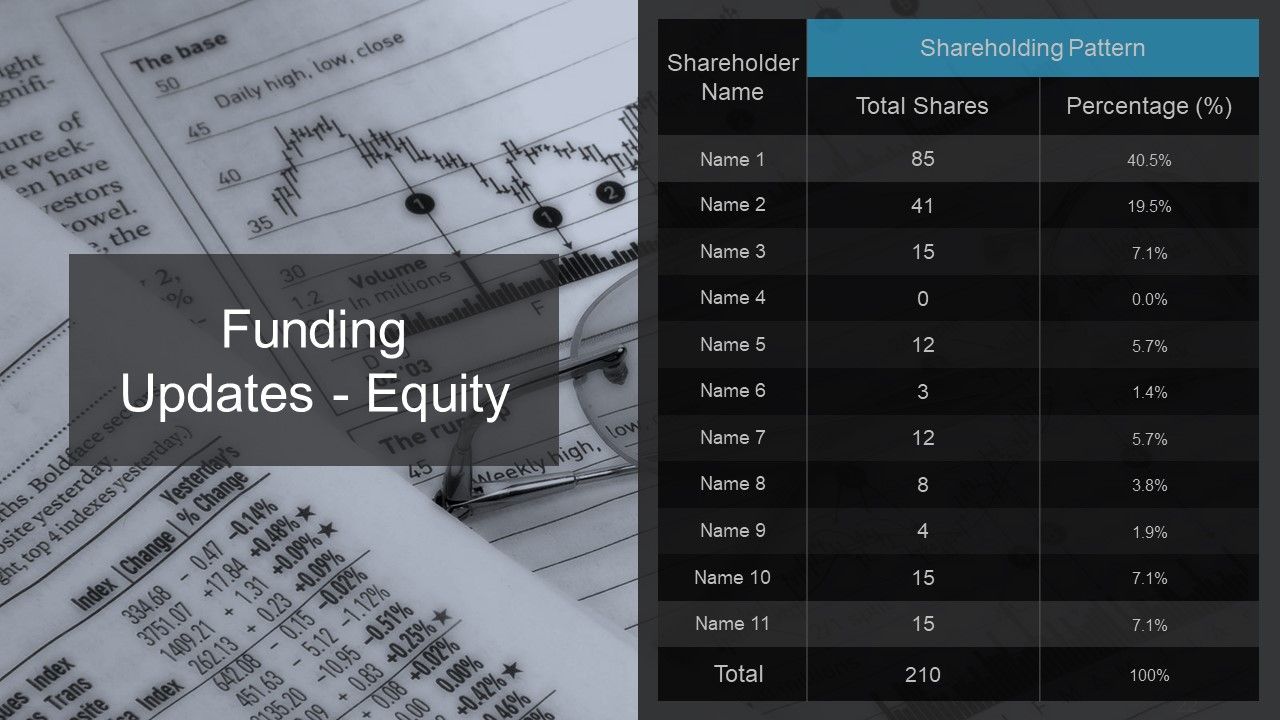
Adding funding updates helps provide depth and context to the business analysis. You can demonstrate the equity and number of shares of various shareholders to your company. With the help of a table, you can easily highlight the names of the shareholders with their equity percentage and the number of shares they own in the business. This demonstration will help chart the company's future plans and provide an overview of the company’s financial status.
Template 6: Project Updates
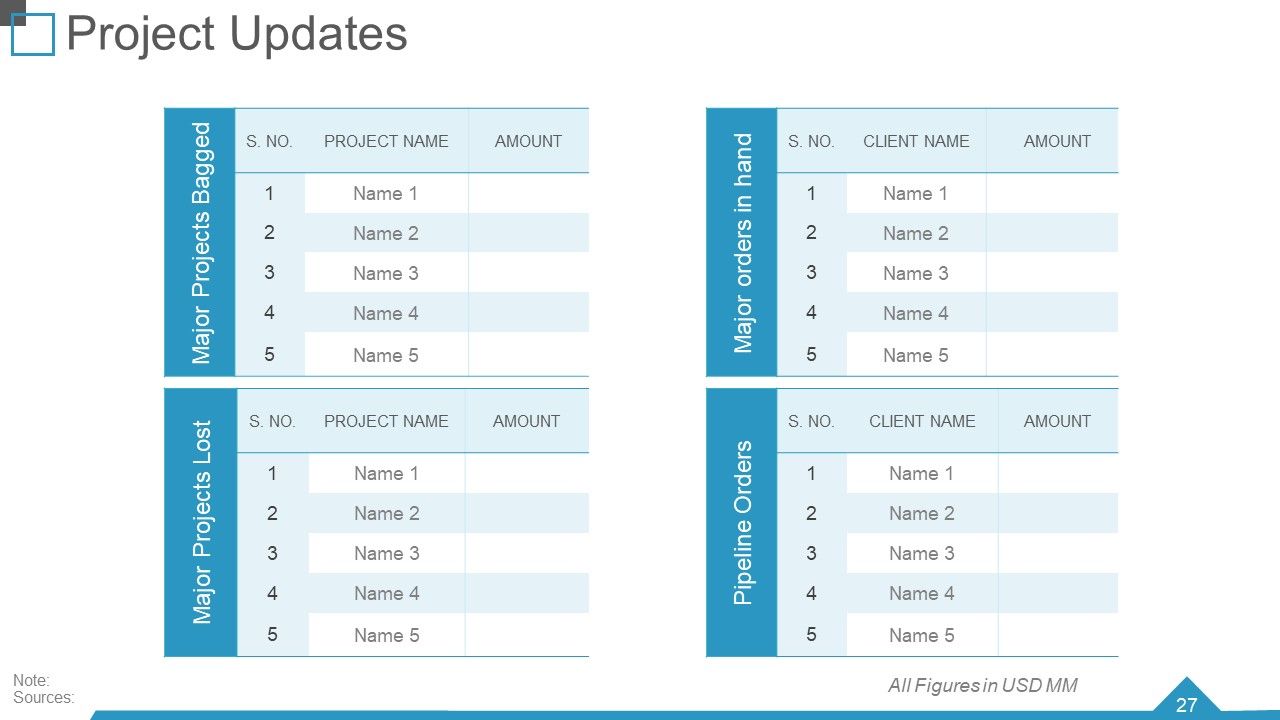
This slide will help you keep track of the various projects on board in your business. You can show the significant projects bagged, major projects lost, pipeline orders, and major orders in hand. You have the advantage of highlighting all these projects at glance. You will get four tables in a single slide to mention all these projects. This slide will help track the progress, status of the projects, and milestones achieved and effectively indicate potential challenges.
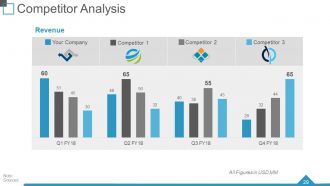
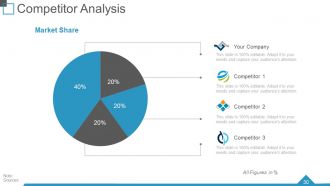
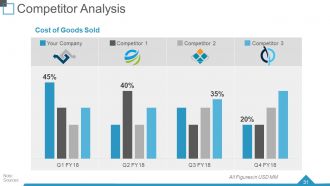
Template 7: Competitor Analysis
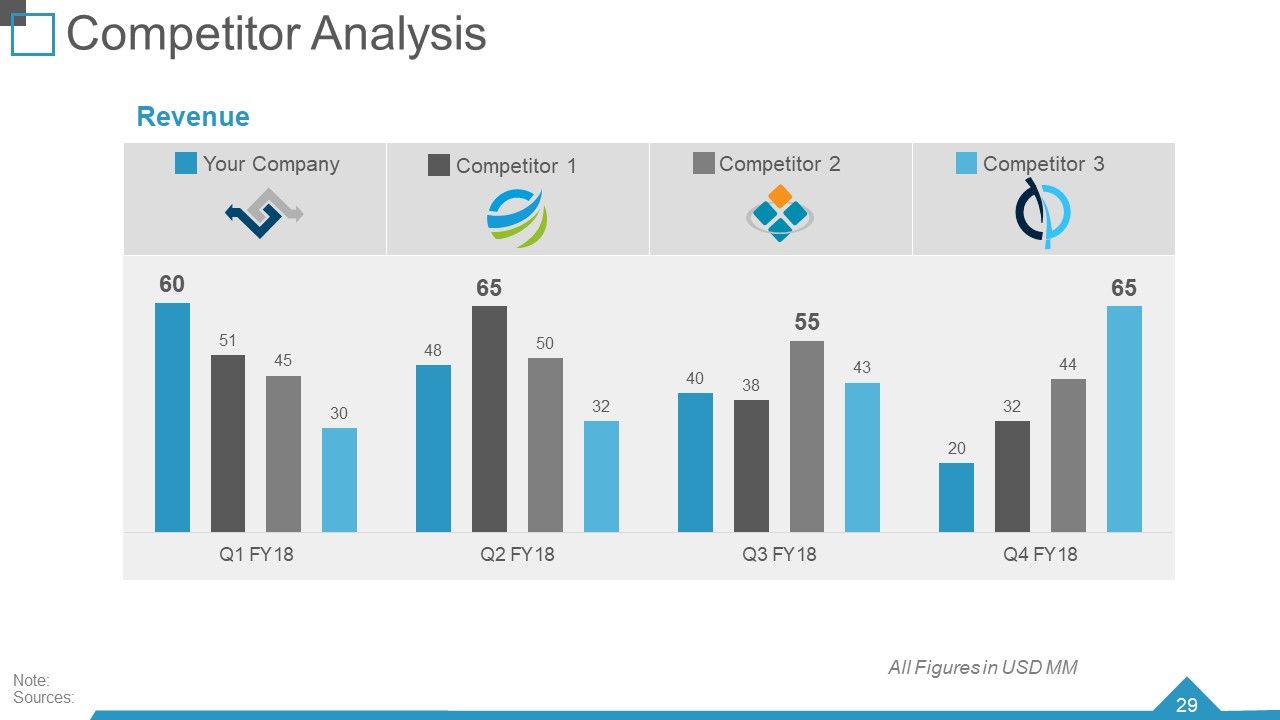
Highlight and analyze your company’s and competitor’s revenue with innovative and effective charts. This slide will help you analyze your and your competitor’s positions based on revenue. Insights into your competitors' businesses will help you develop growth strategies. This ready-to-use slide compares your company's revenue with three competitors.
Template 8: Benchmarking Competitive Intelligence
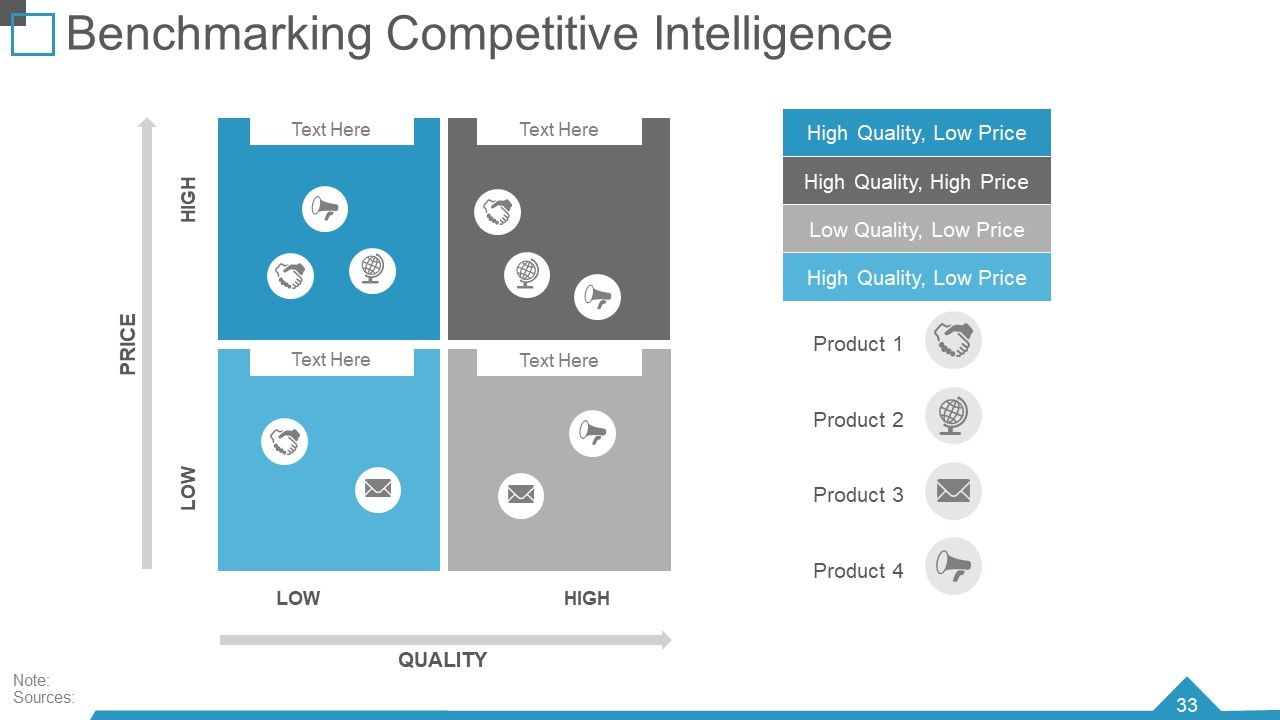
Through this slide, you can compare your business products with others and identify the loopholes. You can set realistic goals for improvement in various areas of your business. This slide will help you analyze your product strategies through innovative visuals and icons. You can demonstrate the quality and price of your product with the help of blocks for each product. This slide also provides you with attractive icons to represent different products.
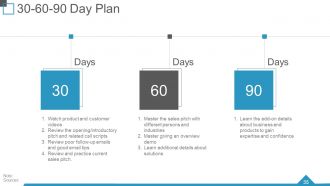
Template 9: 30-60-90 Day Plan

Crafting a plan for the products effectively and attractively adds to the extensive list of perks of the slide. You can create 30-60-90-day plans for your business. In the 30-day plan, you can emphasize watching the product and customer videos, reviews, introductory pitches, and good email tips. In the 60-day plan, you can master the sales pitch, overview demo, and additional details. With the 90-day plan, you can learn about the add-on details of the business and its products. This slide will provide pre-designed information about plans for different periods.
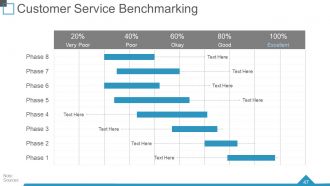
Template 10: Customer Service Benchmarking
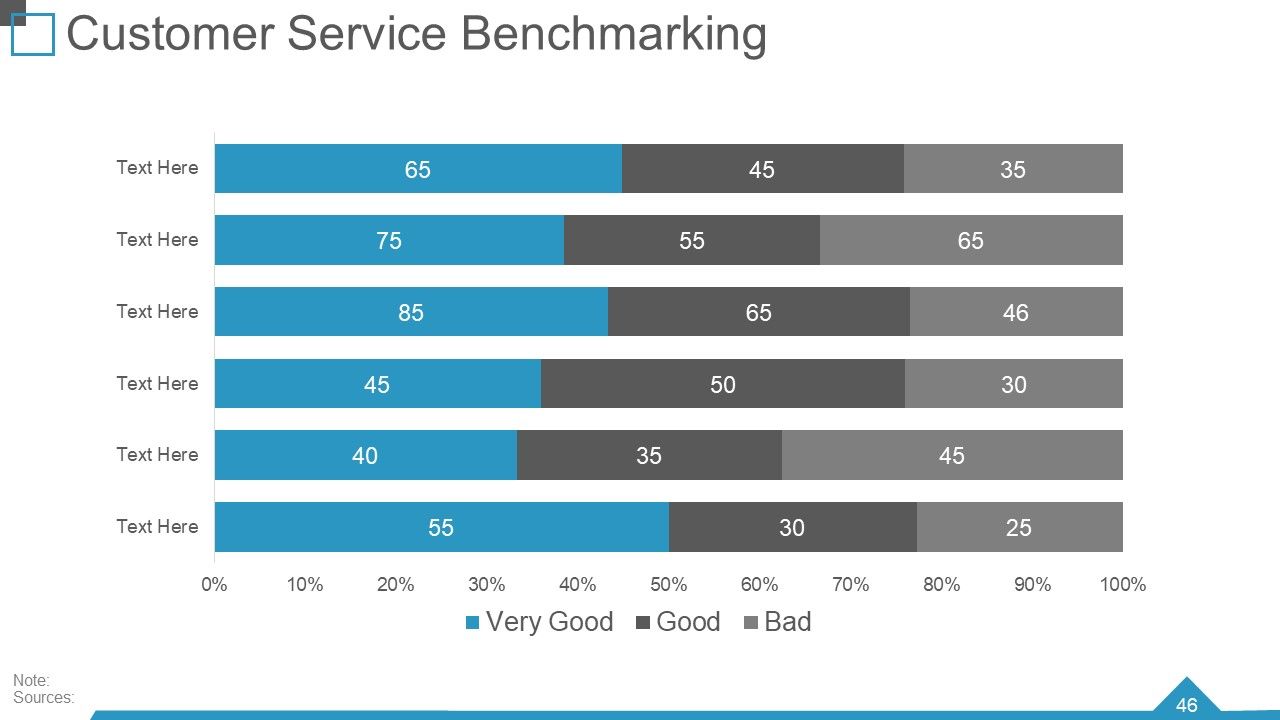
Comparing your business's customer service with other businesses is one essential way to achieve the desired success goals. Through the slide, you can highlight the customer servicing benchmarking and identify the gaps to enhance the customer experience and loyalty and drive business growth. You can also highlight the excellent and lousy customer service benchmarking through color schemes.
For the Best Business Review!
Customizable PPT templates are an effective tool for a quarterly business review. Accessing the current performance status, focusing on current goals and issues, reinforcing accountability and action plans, and identifying and removing barriers play an essential role in business growth. It is essential to develop business strategies that are made accessible through these PowerPoint templates. Download it today!
Quarterly business review powerpoint presentation slides with all 80 slides:
Advocate an intrepid attitude with our Quarterly Business Review Powerpoint Presentation Slides. Encourage individuals to indulge in exploration.
-

Quarterly Business Review Q1 FY18
-
Agenda
-
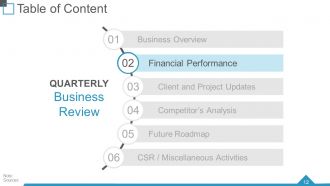
Quarterly Business Review
-
Quarterly Business Review
-
Highlights
-
Financial Summary
-
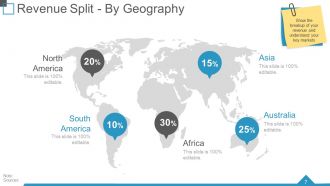
Revenue Split By Geography
-
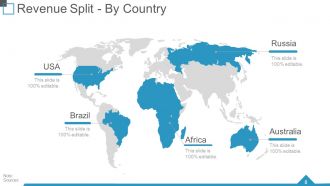
Revenue Split By Country
-
Revenue Split By Product Segment
-
Revenue Split By Product Segment
-
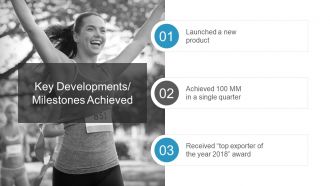
Key Developments Milestones Achieved
-
Quarterly Business Review
-

P L KPIs
-
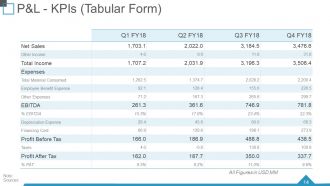
P L KPIs Tabular Form
-
Balance Sheet KPIs
-
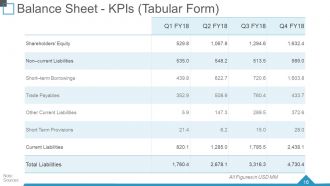
Balance Sheet KPIs Tabular Form
-
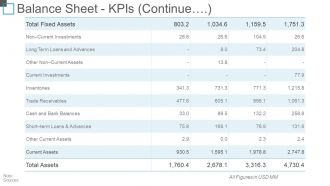
Balance Sheet KPIs Continue
-

Cash Flow Statement KPIs
-
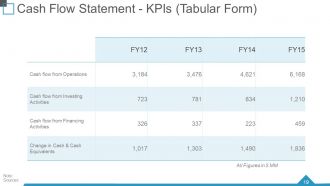
Cash Flow Statement KPIs Tabular Form
-
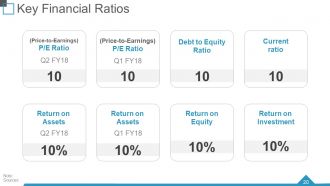
Key Financial Ratios
-
Funding Updates Debt
-
Funding Updates Equity
-

Quarterly Business Review
-
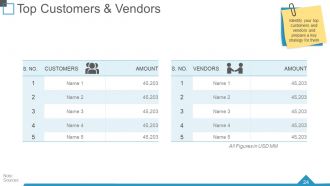
Top Customers Vendors
-
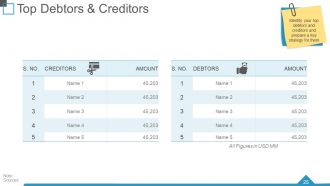
Top Debtors Creditors
-
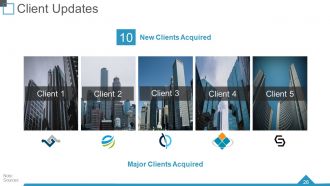
Client Updates
-
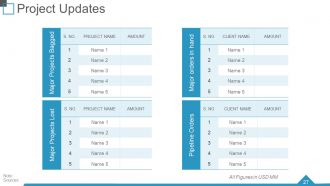
Project Updates
-
Quarterly Business Review
-
Competitor Analysis
-
Competitor Analysis
-
Competitor Analysis
-

Competitor Analysis
-

Benchmarking Competitive Intelligence
-
Quarterly Business Review
-
30 60 90 Day Plan
-
Light Bulb With Time Planning Ideas
-
Product Roadmap Layout 1
-
Product Roadmap Layout 2
-
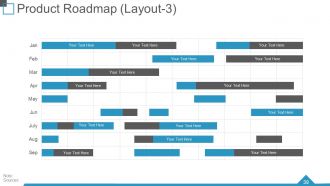
Product Roadmap Layout 3
-
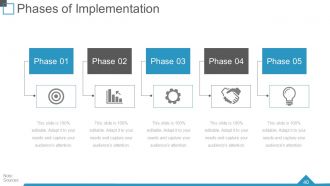
Phases of Implementation
-
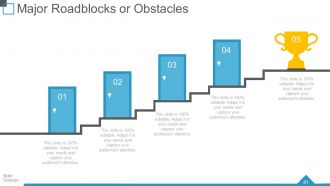
Major Roadblocks or Obstacles
-

Major Roadblocks or Obstacles
-
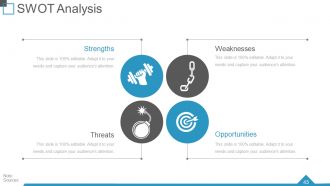
SWOT Analysis
-
Quarterly Business Review
-
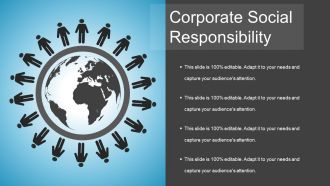
Corporate Social Responsibility
-

Customer Service Benchmarking
-
Customer Service Benchmarking
-

Organization Chart
-
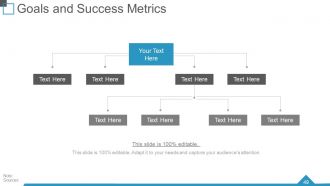
Goals and Success Metrics
-
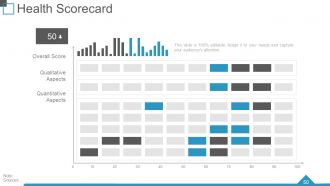
Health Scorecard
-
Icons for Quarterly Business Review
-

Additional Slides
-
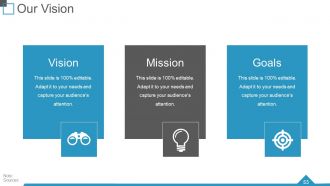
Our Vision
-

About Us
-

Our Team
-
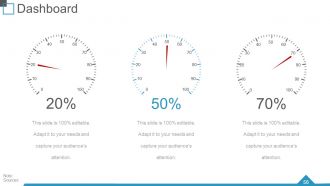
Dashboard
-
Post it
-

Newspaper Layout
-
Puzzle
-
Target
-
Circle
-
Venn
-
Mind Map
-
Matrix
-
Lego
-
Silhouettes
-
Magnifying Glass
-
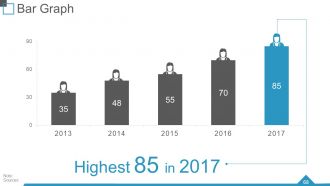
Bar Graph
-
Funnel
-

Our Charts
-
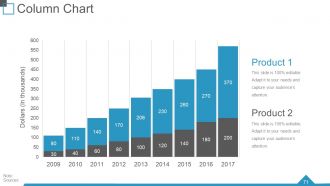
Column Chart
-
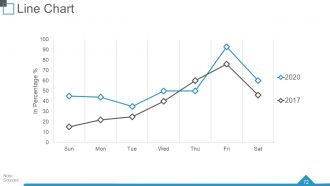
Line Chart
-
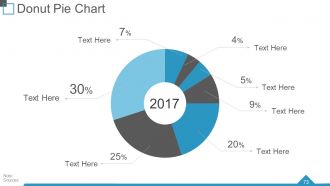
Donut Pie Chart
-
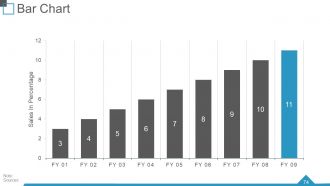
Bar Chart
-
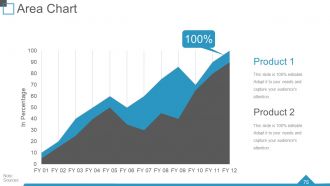
Area Chart
-
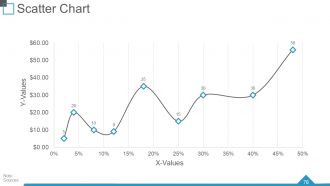
Scatter Chart
-
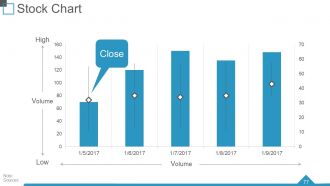
Stock Chart
-
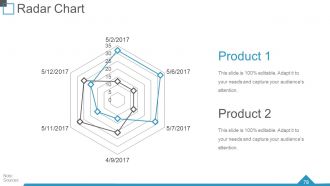
Radar Chart
-
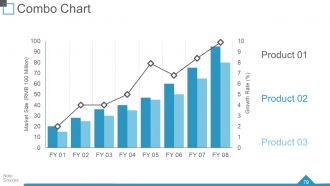
Combo Chart
-
Thank You
FAQs for Quarterly business review
Honestly, just hit the big four and you're golden. Revenue vs targets is obvious. Customer stuff - how many you're getting, how many are bailing. Then whatever operational metrics actually matter for your business (don't go crazy here). Financial health snapshot with profit and cash flow. I always sneak in a competitive slide because execs eat that up - they want to know if you're winning or getting crushed. Show trends though, not just snapshots. That's where the actual story is. And tie each metric to something actionable, otherwise it's just fancy charts nobody remembers after the meeting ends.
Look, nobody wants to sit through another boring spreadsheet parade. Visual storytelling is what saves your QBR from becoming a snoozefest. Charts and infographics help you actually tell the story of your quarter - what went wrong, what crushed it, where you're going next. I swear, most QBRs lose people by slide 3 because they're just data dumps. Here's what works: figure out your story first, then pick visuals that back it up. Show real business impact, not just numbers. Connect the dots between your metrics and what actually happened. Trust me, stakeholders will thank you for making their lives easier.
Don't make vague goals - they're honestly pointless. Get super specific instead. Like "increase NPS from 7.2 to 8.0 by March through weekly check-ins with our top 10 accounts" and put Sarah in charge. Each goal needs an actual deadline (this quarter), someone who owns it, and you need to spell out what winning looks like. Oh and set check-in dates along the way. Trust me on this - you don't want to hit your next quarterly review totally clueless about progress. I've been there and it sucks.
Grab your Q3 goals and make a quick scorecard comparing what you actually hit vs what you planned. I'm obsessed with color-coding everything green/yellow/red - makes it way easier to spot patterns. Figure out why you missed stuff. Was it money issues, the market going crazy, or did you just set impossible targets? Here's the thing though - don't only look at wins and fails. Check your leading indicators too, plus any process tweaks that helped. Be real about what sucked and what didn't. Then use all that to build better goals for Q4.
Honestly, customer feedback is like your QBR roadmap - it shows you exactly what needs fixing first. Pull everything together from the quarter: surveys, support tickets, notes from your account managers, all of it. Then let that mess guide what you actually talk about. Makes zero sense discussing shiny new features when people are losing their minds over basic bugs, you know? I'd start by grouping the feedback into themes - that way you can tackle the biggest headaches upfront. Your agenda basically writes itself once you see what's really burning customers. Trust me, this approach beats generic presentations every time.
Honestly, dashboards are a lifesaver for QBRs. Charts and heat maps make everything way easier to digest than those soul-crushing spreadsheet dumps nobody wants to look at. I'd go with Tableau or Power BI if you can, but Excel works too. The key thing? Tell a story with your data - show the "why" behind the numbers instead of just throwing charts at people. Interactive elements are clutch because executives love drilling down into details. Start with your biggest wins or concerns upfront. Trust me, visuals beat text walls every single time when you're trying to keep people awake in those meetings.
Dude, biggest thing is don't just dump a bunch of numbers on them - tell an actual story. Practice beforehand too because nothing tanks your credibility like fumbling through slides. Leadership honestly cares way more about what you learned from the stuff that didn't work and your plan going forward than celebrating wins. Oh, and definitely prep for the hard questions about missed targets - they're coming. Skip generic industry stuff unless it actually affects your business. Come with specific examples and realistic forecasts. Have backup data ready because someone will push back on something.
Stop letting these turn into boring presentation marathons. Mix people from different departments into small groups and have them actually solve problems together - like getting sales and product to dig into customer feedback or having marketing team up with customer success on retention stuff. The real breakthrough happens when everyone realizes they're tackling the same issues, just from different sides. Give them shared action items that force collaboration (with clear owners, obviously). Oh, and don't forget to schedule follow-ups or it'll all just fizzle out. Trust me, people connecting directly beats executive summaries every time.
Honestly, QBRs work because you're forcing everyone to show their cards at once. Marketing, sales, product, ops - they all have to explain how their stuff ties back to the same company goals. It gets painfully obvious real fast where teams aren't aligned or working toward different things. The magic happens when everyone's sitting there hearing what other departments are actually prioritizing. No more guessing games or working in silos. One thing that's been a game-changer for us - make each team call out exactly what they need from other departments during their presentation. Suddenly collaboration isn't just some nice-to-have, it's built right into the process.
Honestly, automation is a game-changer for QBRs. I used to spend forever copying data into spreadsheets - such a waste of time. Now I use tools like Tableau that just pull everything automatically and update in real-time. Super helpful for tracking goals throughout the quarter instead of scrambling at the end. Project management platforms help too. Oh, and remote QBRs actually work pretty well with good screen sharing - sometimes better than in-person ones, weirdly. Just figure out what data you're gathering manually each quarter and find tools to automate those specific pieces first.
Okay so first thing - document those action items within 24 hours while everyone still remembers what they agreed to. Send a recap email with clear owners and deadlines. Trust me, I've seen too many great ideas just die in meeting notes! Set up check-ins at 30 and 60 days to actually track progress. Connect any commitments to people's individual goals or OKRs so there's real skin in the game. The whole point is creating a feedback loop where you're reviewing progress regularly instead of just... hoping things happen? Don't let stuff sit until next quarter.
Don't dump all your success stories in one boring section - sprinkle them throughout the whole QBR instead. When you're showing that revenue number you crushed, tell the actual story behind the client win that got you there. Stories keep people awake way better than slide after slide of numbers (trust me on this one). Structure each story as challenge-solution-outcome, keep it under 2 minutes, and connect it back to your bigger goals. Oh, and let your team members tell their own stories rather than you doing all the talking. Way more authentic that way.
You definitely need an agenda for your QBR - trust me on this one. Without it, you'll end up with one of those painful meetings where everyone just rambles about random updates and nobody walks away with anything useful. Share it 48 hours ahead so people can actually prep. Break down your discussion points with time limits for each section. This way you won't spend 30 minutes on something minor while the important stuff gets rushed at the end. I've seen too many QBRs turn into complete time-wasters because nobody planned what they actually wanted to cover.
Honestly, different viewpoints are gold - they catch stuff you'd totally miss on your own. Before meetings even start, I set ground rules about sticking to data and business outcomes instead of just opinions. When things get heated (and they will), bring everyone back to your shared goals. Super helpful trick: write your main objective on a whiteboard where everyone can see it. Let each person present their side without getting interrupted, then guide the conversation around what you're willing to trade off. Oh, and document everything you decide - trust me, people's memories get weirdly selective later.
Okay so first thing - break people into smaller groups for discussions, then have them report back. Way easier to get people talking that way. Try using polls or live Q&A stuff for real-time input too. Give everyone prep work beforehand (I know, more work but it actually helps). Mix up who's presenting different sections instead of just having leadership drone on the whole time. Oh and honestly? Food makes everything better, even if it's just scheduling coffee breaks for virtual meetings. The key thing is asking direct questions to specific people and actually giving them a pause to think before responding.
-
Informative design.
-
Very unique and reliable designs.