American bestseller author, speaker, and Duke University fellow Dan Heath said, “Data are just summaries of thousands of stories—tell a few of those stories to help make the data meaningful.”
In the fast-paced business world, where every second counts, competition is fierce, and success hangs in the balance, sales reports are the books that tell millions of stories (or stories of millions) in a few pages. These reports are not just mere documents; they are the key to unlocking a treasure trove of information and portals to a wealth of knowledge that can propel your business to new heights.
Transforming Number Into Sales Stories!
Among the plethora of sales documents, one that stands tall as the cornerstone of strategic decision-making and, if used wisely, as a weapon of champions is the quarterly sales reports.
Think of quarterly sales reports as the bestsellers of the sales world. They go beyond providing mere summaries; they immerse you in a captivating narrative, revealing the twists and turns of your company’s sales performance. Just as a well-crafted story grips your attention and leaves you eager for the next chapter, quarterly sales reports engage your strategic mind, empowering you to make informed decisions that drive growth.
Why Quarterly Sales Reports?
While daily and monthly reports provide valuable snapshots, quarterly reports paint a comprehensive picture of your company’s sales landscape. It encapsulates the performance over three months, allowing you to identify trends, spot potential bottlenecks, and make informed adjustments. These reports are like a compass in the stormy sea of business, guiding you toward profitability and success.
But here’s the catch!
Crafting these reports from scratch can be a daunting task. The hours spent formatting, organizing, and analyzing data drain your energy and distract you from the bigger picture. That’s why you need these powerful and aesthetic quarterly sales report templates.
Quarterly Sales Report Templates
Our quarterly sales report templates are storytellers that turn your sales data into an engaging masterpiece. These presentation designs save time and effort for the user and provide a seamless experience. The user-friendly interface and customizable features allow you to weave your sales story, capturing the attention of your stakeholders and inspiring action. With this comprehensive suite of templates at your disposal, you gain a definite edge over the competition.
Whether you’re a seasoned executive, an ambitious entrepreneur, or a sales enthusiast looking to make your mark, our Quarterly Sales Report Templates are an absolute must-have. They equip you with the tools to navigate the sales landscape, identify trends, and chart a course toward success.
Don’t settle for ordinary reports when you can have extraordinary narratives. Download our Quarterly Sales Report Templates today and embark on a journey of sales triumph like never before.
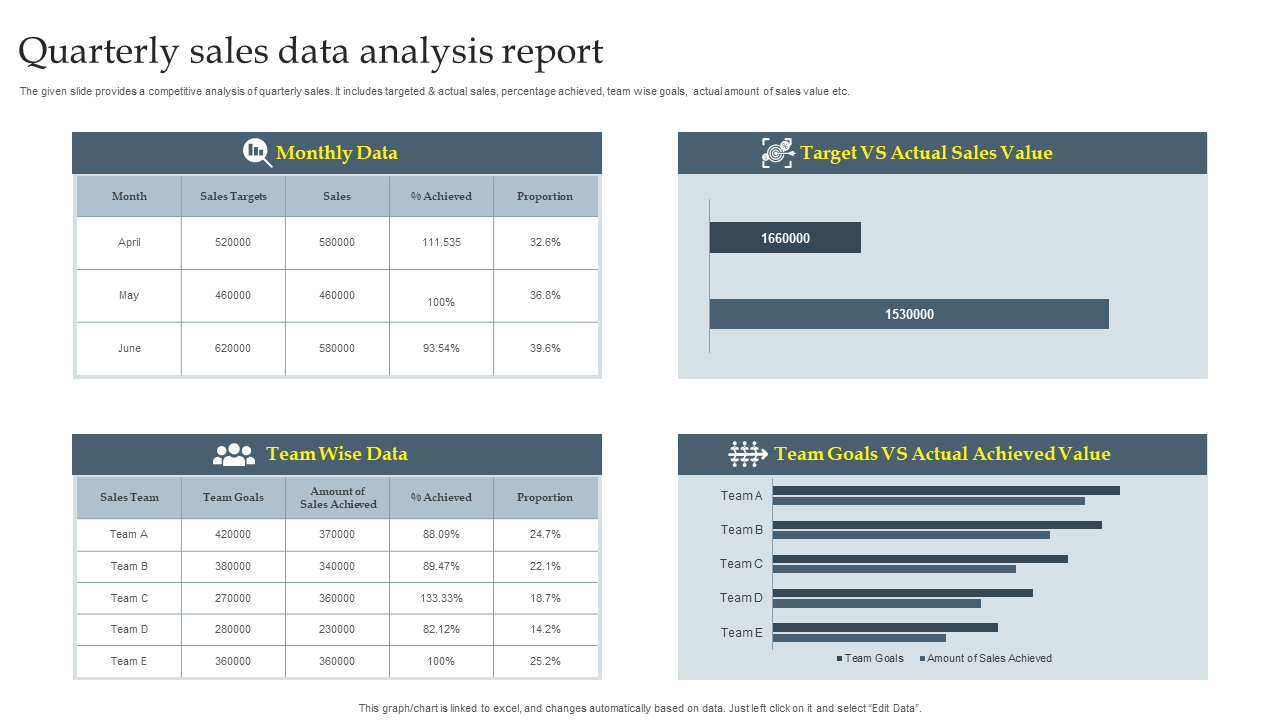
1. Quarterly Sales Data Analysis Report Template
Data is king when it comes to driving sales growth but analyzing vast amounts of sales data can be overwhelming. This comprehensive quarterly sales data analysis template will do the trick. With its easy-to-read tables and bar charts, you can transform raw data into actionable insights. The tabular layout offers a structured framework that allows you to organize and interpret your monthly and team sales data with metrics, sales targets, sales done, target achieved, and proportions. The bar charts will help you identify trends, spot opportunities, and make data-driven decisions. Download it now!
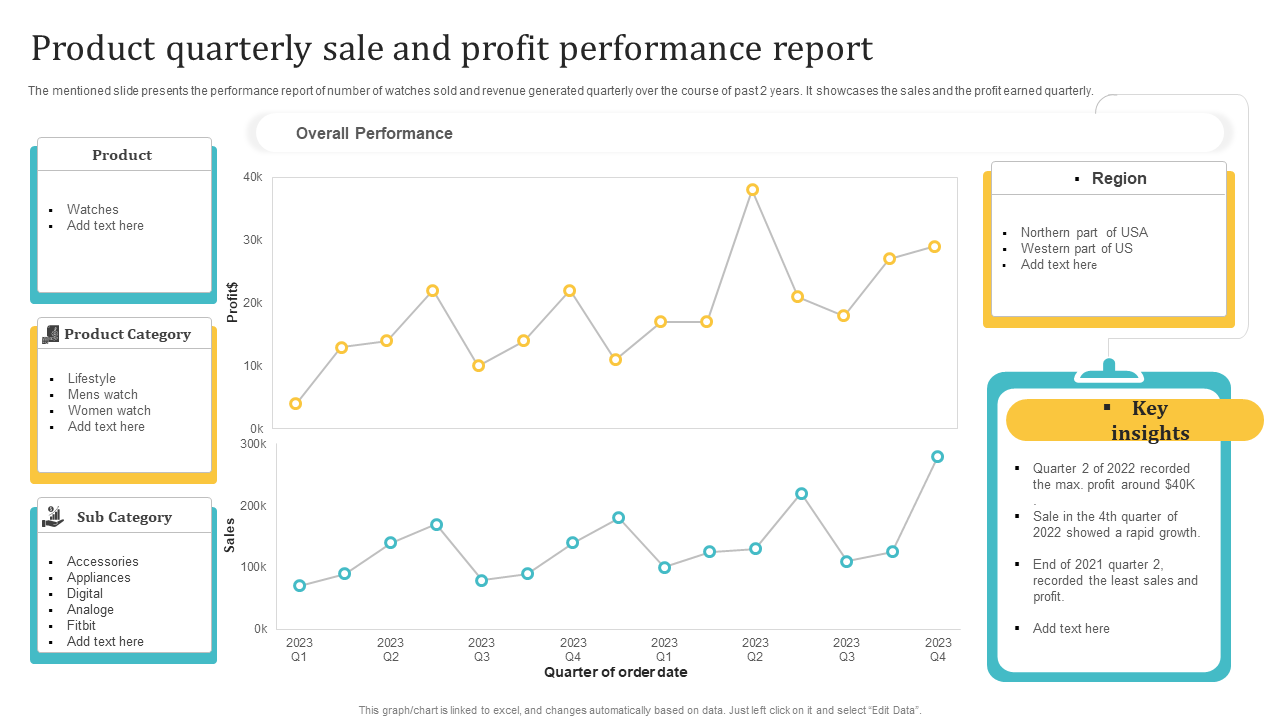
2. Product Quarterly Sales And Profit Performance Report Template
This sales and profit performance report template helps you optimize your sales strategy and maximize profits with insights into your product’s success and financial health. It is your go-to solution to simplify the analysis of your quarterly sales and profit data. You can track, analyze, and visualize your product’s performance for more than eight quarters or two years with its easy-to-understand graphs. This PPT Design has pre-designed space to add names, categories, sub-categories, regions, and key insights from the chart for the products under discussion. Get it now!
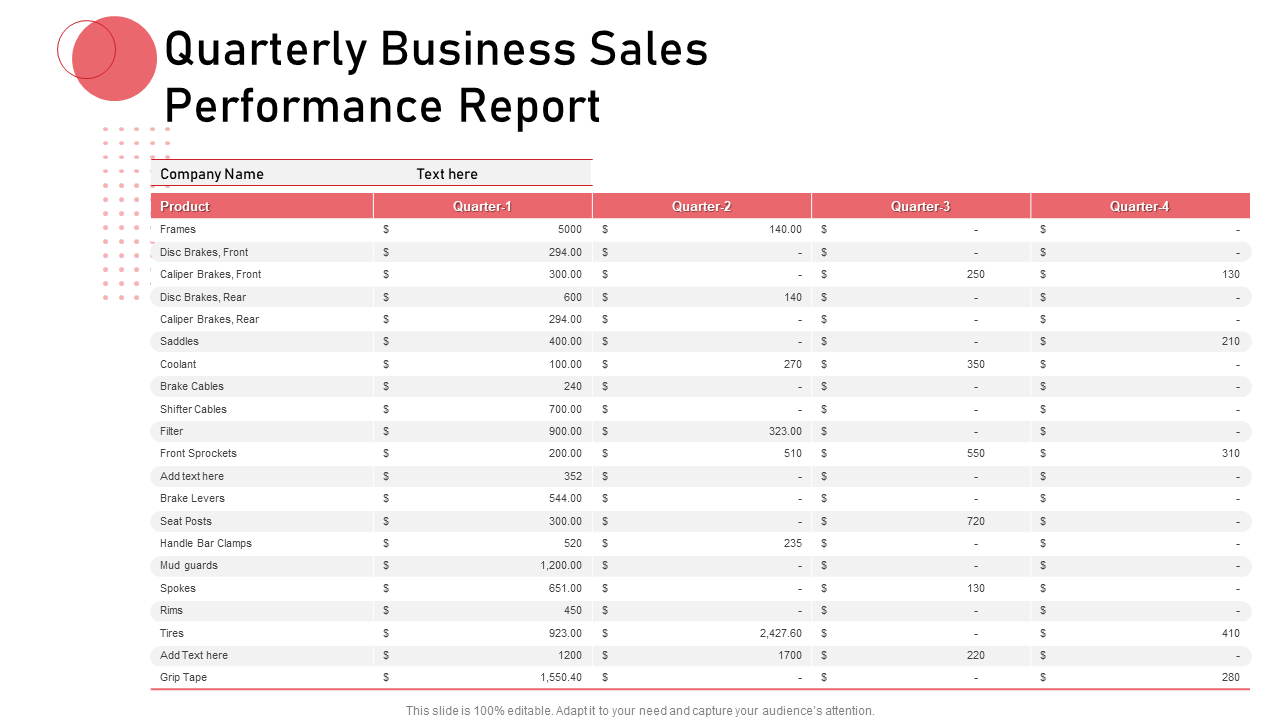
3. Quarterly Business Sales Performance Report Template
Visualizing your sales data is a breeze with this template as it automates calculations, aggregates data, and generates professional-looking reports with a few clicks. Instead of spending hours manipulating spreadsheets and crunching numbers, you can focus on interpreting the results and devising strategic plans. The five-column table provides organized space to showcase and compare the sales figures of multiple products over four quarters. Grab it today!
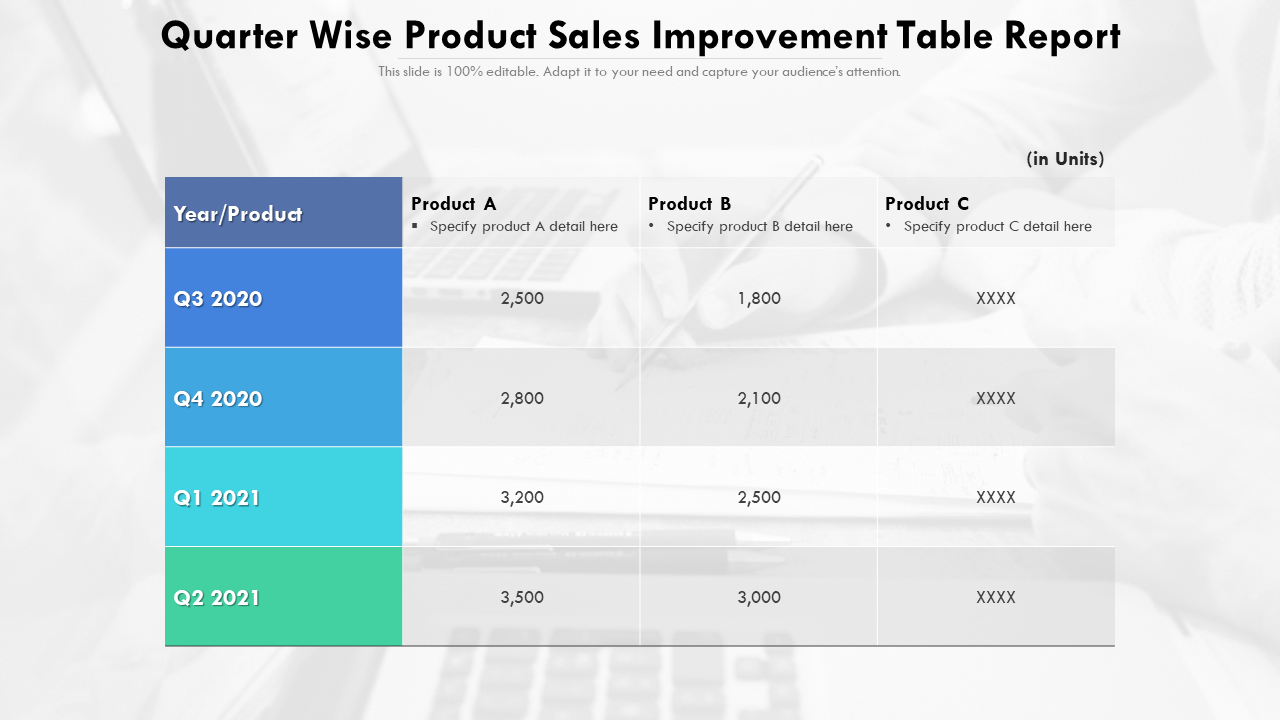
4. Quarter-wise Product Sales Improvement Table Report Template
This expert-designed neat presentation template provides a structured framework to assess the effectiveness of your sales strategies with a glance at numbers. It allows you to track and compare key metrics of three products in four quarters. By comparing data across different quarters and products, you can identify trends, spot potential opportunities, and take targeted actions to optimize your sales approach. The color, theme, text, and structure of this PPT Layout are editable to create a new eye-catching sales report. Download it now!
5. Region Wise Product Quarterly Sales Bar Graph Report Template
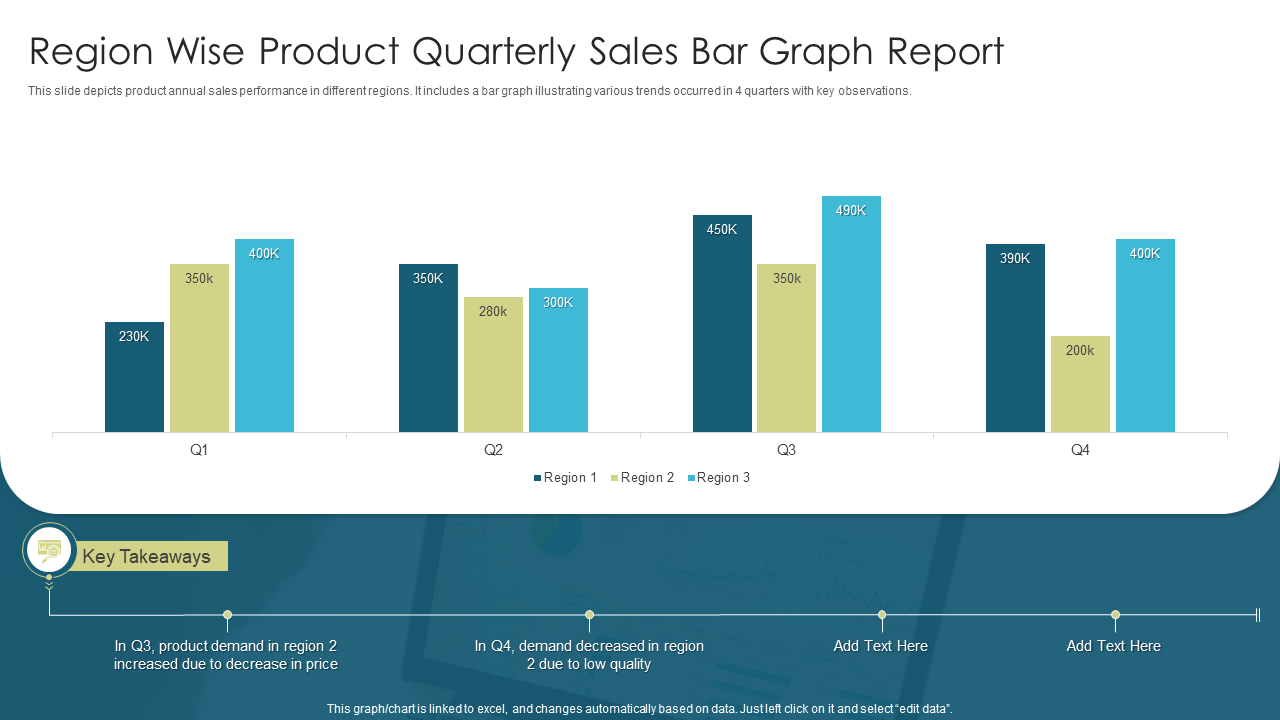
This sales report template gives you the power of data visualization for understanding the regional performance and making strategic decisions. It goes beyond traditional reporting, transforming your sales data into captivating visual narratives. With its eye-catching, professional-designed bar graphs, you can analyze and compare product sales across different regions, identifying trends and opportunities at a glance. You can also share the key takeaways from this comparison in the given space at the bottom of this PowerPoint Design. The visually stunning representation of data captivates stakeholders, enabling you to communicate complex information with ease. Get it now!
6. Quarterly Sale Weighted Projections Report Template
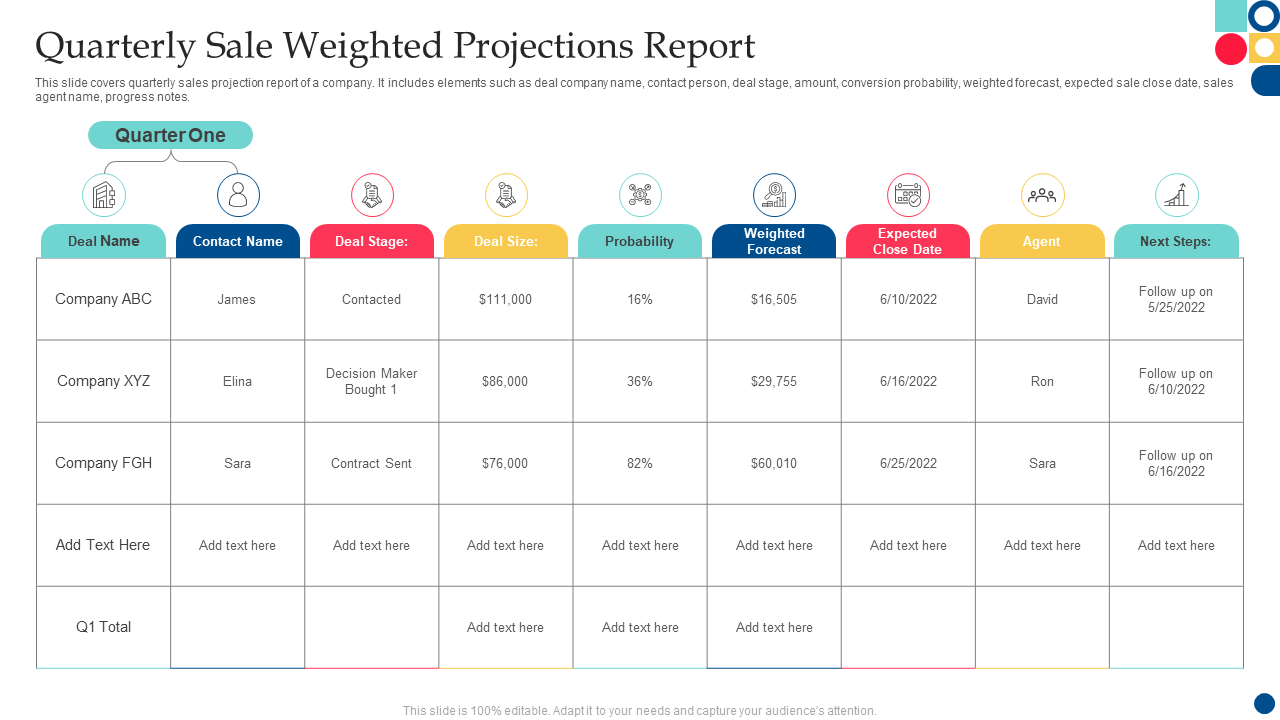
This meticulous-designed presentation template empowers you to create a comprehensive sales report that delves deep into the details of each quarter's sales deals. With nine spacious columns at your disposal, you can showcase vital information such as deal/project/company name, contact name, deal stage, size/budget/profit, and the probability/feasibility of closing a successful sale. The template also provides ample space to highlight weighted forecasts, expected closure dates, assigned personnel, and the next steps toward sealing the deal. Download it now!
From Data to Dollars!
Whether you’re a small business owner striving for growth or a seasoned executive looking to optimize your sales strategies, mastering sales reporting is a huge skill. With this blog, you have a collection of expert-designed, ready-to-use quarterly sales report templates to take your sales analysis to the next level. These presentation layouts are powerful tools that streamline your reporting process, saving you valuable time and effort. The content-ready, user-friendly slides provide the much-needed structure for creating a detailed quarterly sales report that impresses your stakeholders. The 100% customizable nature of these templates provides you with the flexibility to edit your sales report presentations and present them afresh every quarter.
Say goodbye to the days of tedious formatting and hello to a world where your reports shine brighter than ever with the “Sales Symphony” quarterly sales report templates today and orchestrate your path to sales success.
FAQs on Quarterly Sales Report
1. How does a quarterly sales report different from an annual sales report?
A quarterly sales report covers a specific three-month period, providing a more frequent and granular snapshot of a company's sales performance. It allows for timely analysis and course corrections, while an annual sales report summarizes the entire year's sales data, offering a broader perspective on long-term trends and overall financial performance.
2. What key metrics should be included in a quarterly sales report?
In addition to total sales revenue, a comprehensive quarterly sales report should include metrics such as sales growth rate, customer acquisition rate, average order value, customer retention rate, sales by product category or SKU, sales by region or market segment, and comparisons with the previous quarter or year.
3. How can a quarterly sales report help identify areas for improvement?
A quarterly sales report can help identify areas for improvement by highlighting underperforming products or regions, tracking sales trends over time, and analyzing the effectiveness of marketing and sales strategies. It can reveal opportunities for optimizing sales processes, improving customer targeting, or adjusting pricing and promotions to drive growth.
4. What are some common challenges in preparing a quarterly sales report?
Some common challenges in preparing a quarterly sales report include accurately collecting and consolidating sales data from different sources, ensuring data integrity and consistency, dealing with seasonality or fluctuations in sales patterns, and aligning sales metrics with other financial reports. Establishing robust data tracking systems and maintaining clear communication between sales teams and finance departments is important to overcome these challenges effectively.


 Customer Reviews

