Regardless of the operational efficiency and size, your financial department is the beating heart of your organization. Let alone financial fluency, a business demands smart decision-making about various other aspects in order to beat the fierce competition. Decisions about budgeting, marketing prospects, growth — pretty much any business arena—need a well-thought plan-of-action rather than relying on gut feeling alone.
As a business, you also require reliable information in order to better grasp your operational status, both current and future. This is where reports come into play. A robust report helps transfer important information about a specified period of time. It acts as a powerful tool that can be applied to internal business processes to bring significant improvements in them.
Having a data-driven approach, a report keeps you updated about even the minutest changes happening in the organization. This in fact is key to keeping your business afloat and being prepared for any drastic shifts that might occur in the future. Not only that, but they also help in gathering far-sighted stats about sales, technology, marketing, etc, proving to be actionable assets for your team, rather than being an all-is-well PDF shared with C-level executives!
Here in this blog, we take the time to round up 15 impressive and stylized quarterly report samples which will help in creating your own relevant statements to match the pace of the hyper-connected business world. Whether you are a small or a large venture, these report samples are great to get an explorative view of your operations, establish goals, meet strategic requirements, and track the overall company state.
Therefore, let us drill deeper into each design and choose the most efficient ones for our business!
Quarterly Report Templates
Template 1
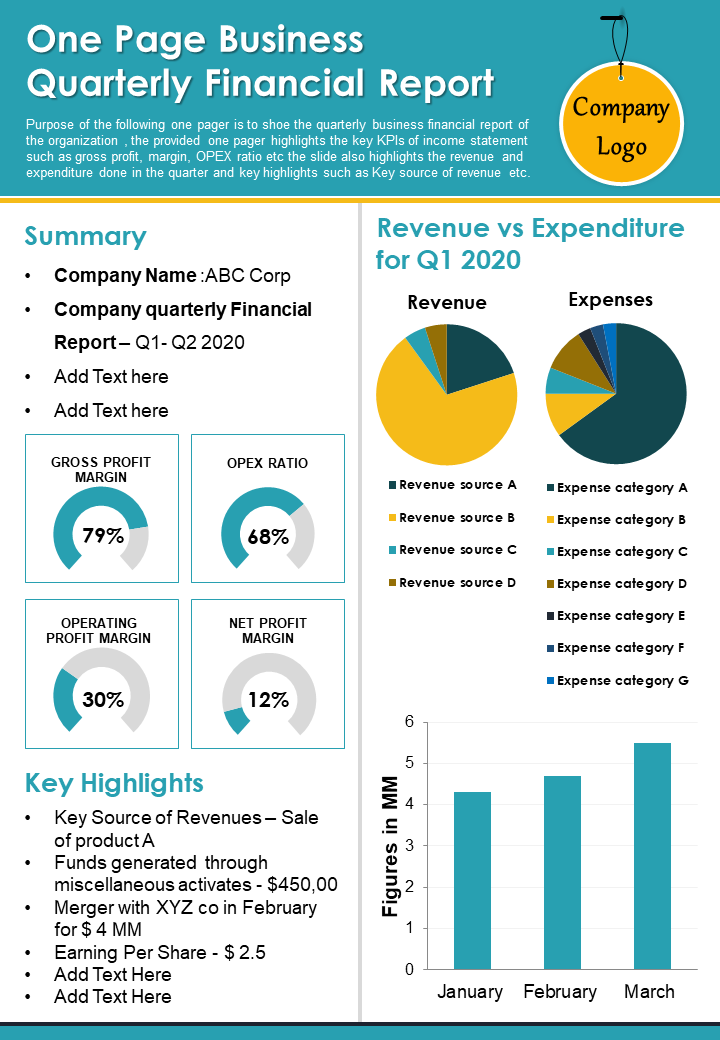
Share your quarterly business highlights with this report template. This template features pie charts and bar graphs, to share updates regarding gross profit and operating profit margins. Compare revenue vs expenditure for the quarter under consideration and depict this data effectively with pie charts. These graphs and charts are editable and Excel-linked allowing you the maximum flexibility to design it as per your preference. Click on the download link below to get this content-ready, easy to customize, one-page quarterly template.
Template 2
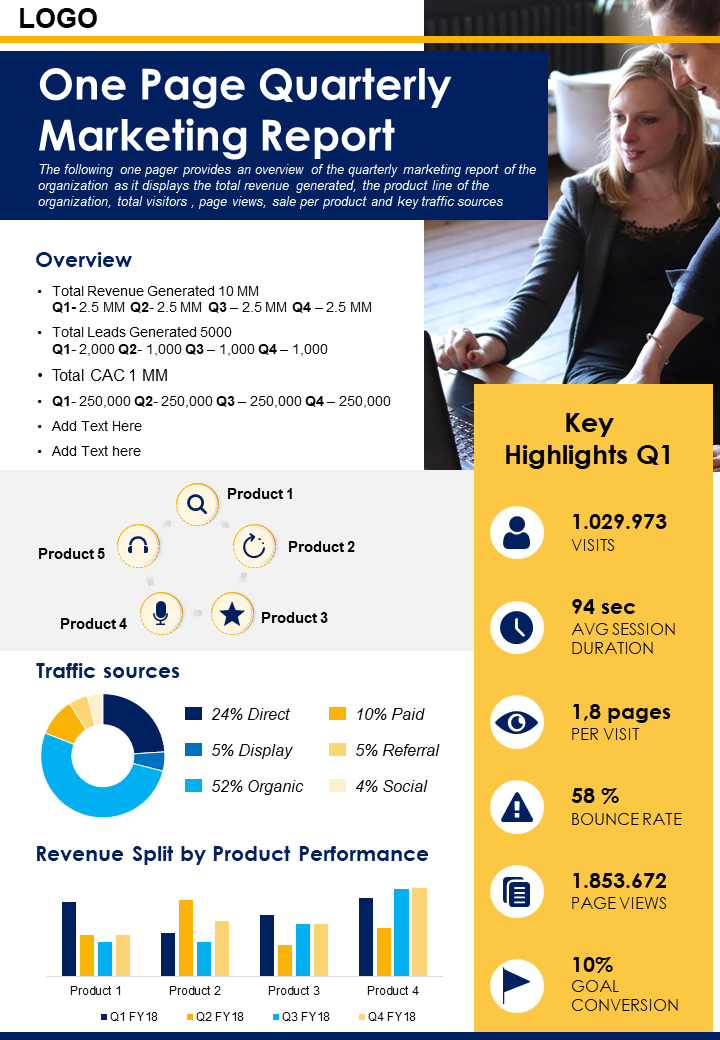
Reporting can be one of the most tedious jobs for a marketer. This quarterly report can help solve this problem in an instant. Use it to track performance and your business progression over time. It offers a crisp layout that can be modified to bring in the much-needed flair to your reports. Not only that, but one can also share it easily across various platforms, making it a very handy tool to deploy.
Download One Page Quarterly Marketing Report Presentation Report Infographic PPT PDF Document
Template 3
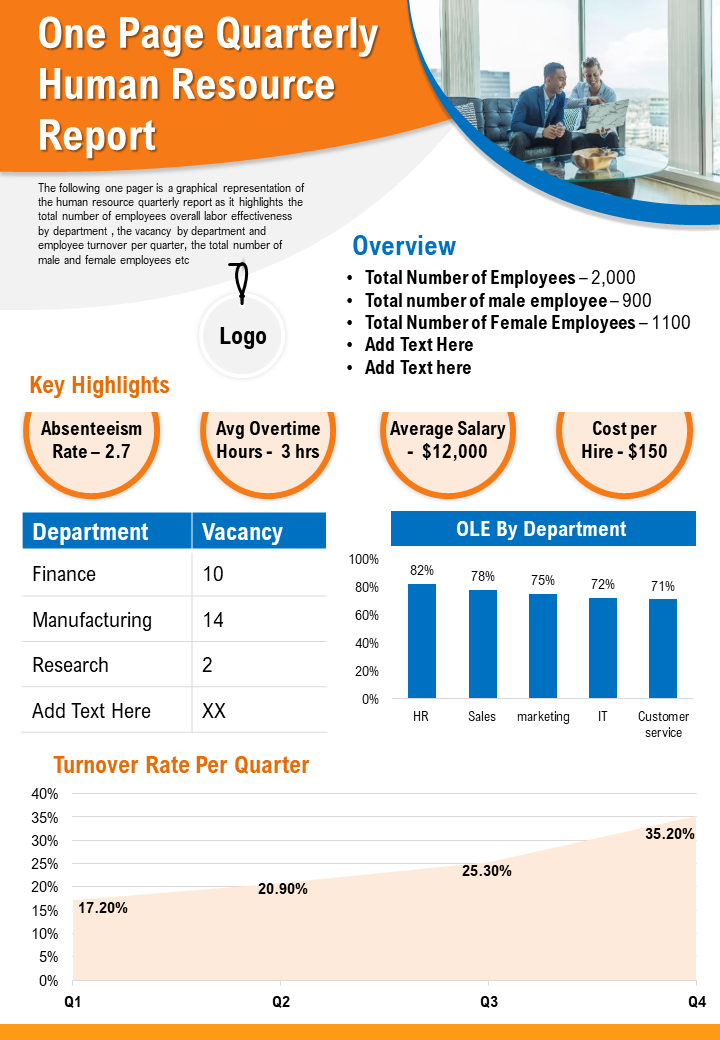
Display as well as interpret quarterly HR-related stats and figures with this well-defined set that comes with editable features. Leverage the power of professionally-made reports, which, when deployed, can help you create powerful statements. Share invaluable insights into your HR department and its functioning with this creative document that can be shared by anyone on the go!
Download One Page Quarterly Human Resource Report Presentation Report Infographic PPT PDF Document
Template 4
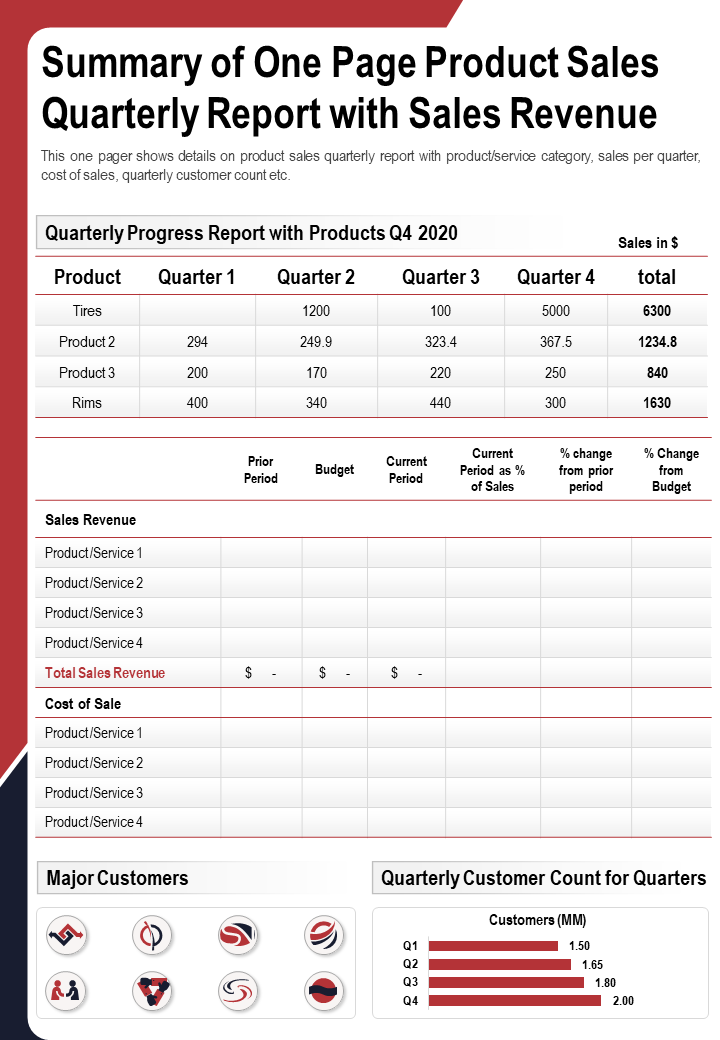
Translate complex data into a visual story with this quarterly report one-pager. Ensure that you never miss your deadline with this product sales bundle. This document comes with pre-determined content and graphics to help you craft a powerful report to showcase your sales revenue. Moreover, it includes all the vital stats and figures that are of importance. Not only that, but it is also easily comprehensible as everything is displayed on a single layout.
Template 5
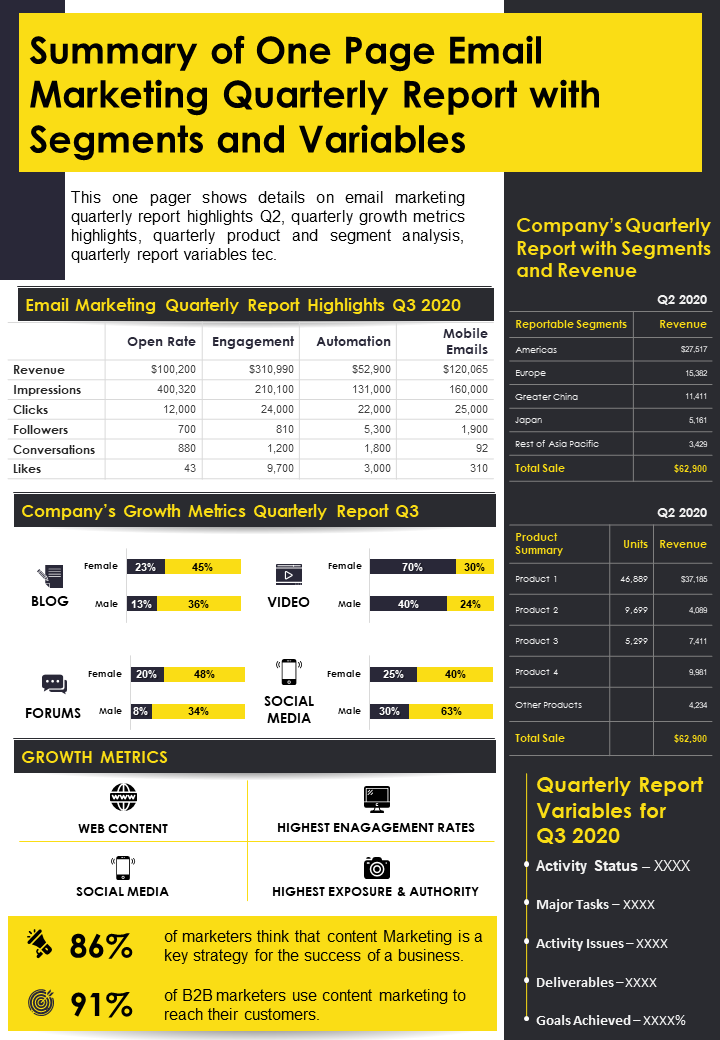
Analyze the effectiveness of your email marketing campaigns and be your own critique with this powerful set. Showcasing various segments and variables in a single report, this template is a must-have in your kitty. Conduct far-sighted comparisons to improve the results of your campaigns in the near future using the data procured from this creative document. Additionally, you can share it across various platforms to attract the attention of your team members and stimulate immediate call-to-action.
Template 6
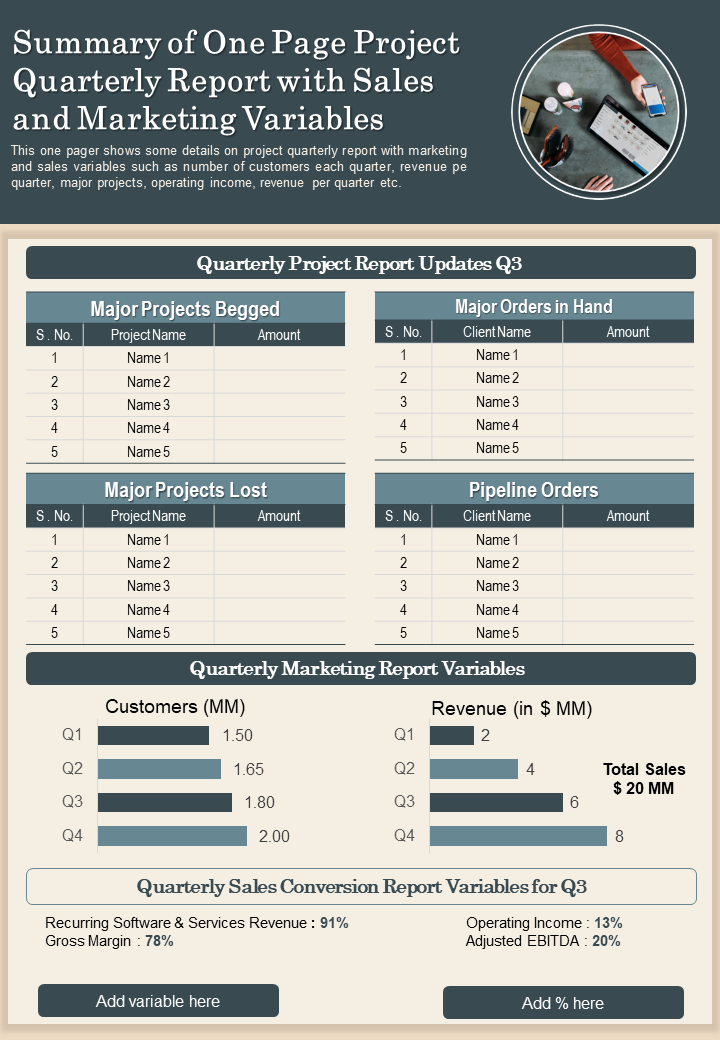
Provide details about the sales and marketing prospects of your project using this intuitively-designed document report. You can use it for not only quarterly stats but also for annual stats as the text placeholders can be replaced with your desired information. Basically, all the components of this document report are fully-modifiable, so feel free to adjust it the way you like.
Template 7
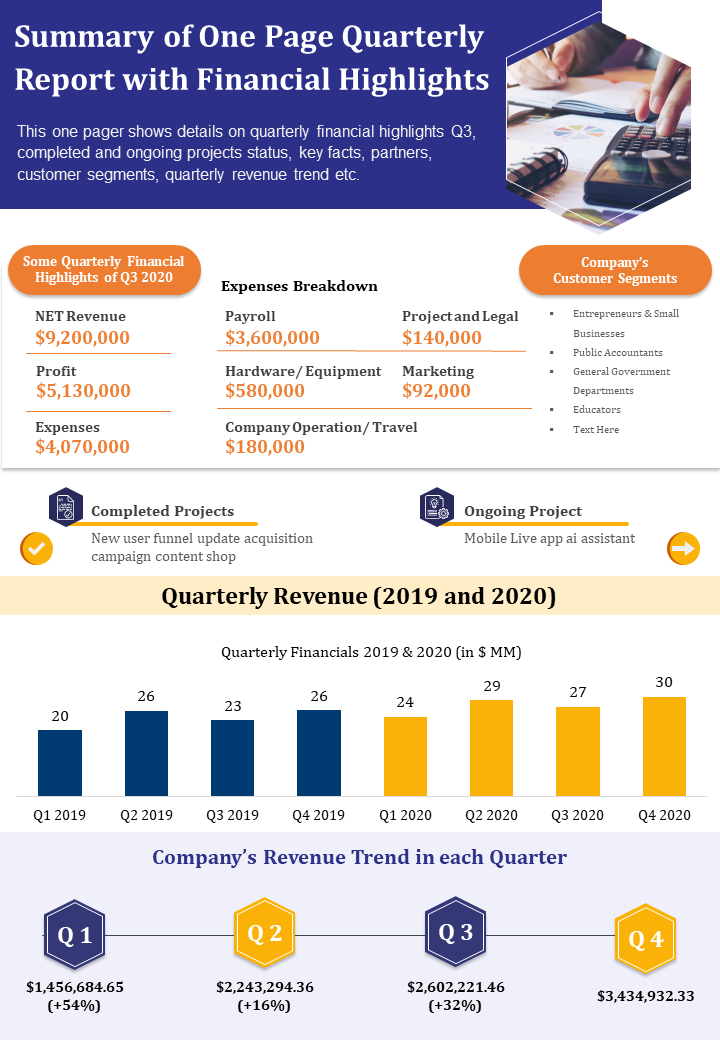
Record the financial withstanding of your business using KPIs like expense breakdown, customer segments, quarterly revenue, and many others by deploying this document report. Use it to present a financial snapshot of your business which can then be analyzed to formulate improved strategies and techniques. The financial viability of your venture can be easily judged with this creative set. Therefore, click on the download link now!
Download Summary Of One Page Quarterly Report With Financial Highlights Report PPT PDF Document
Template 8
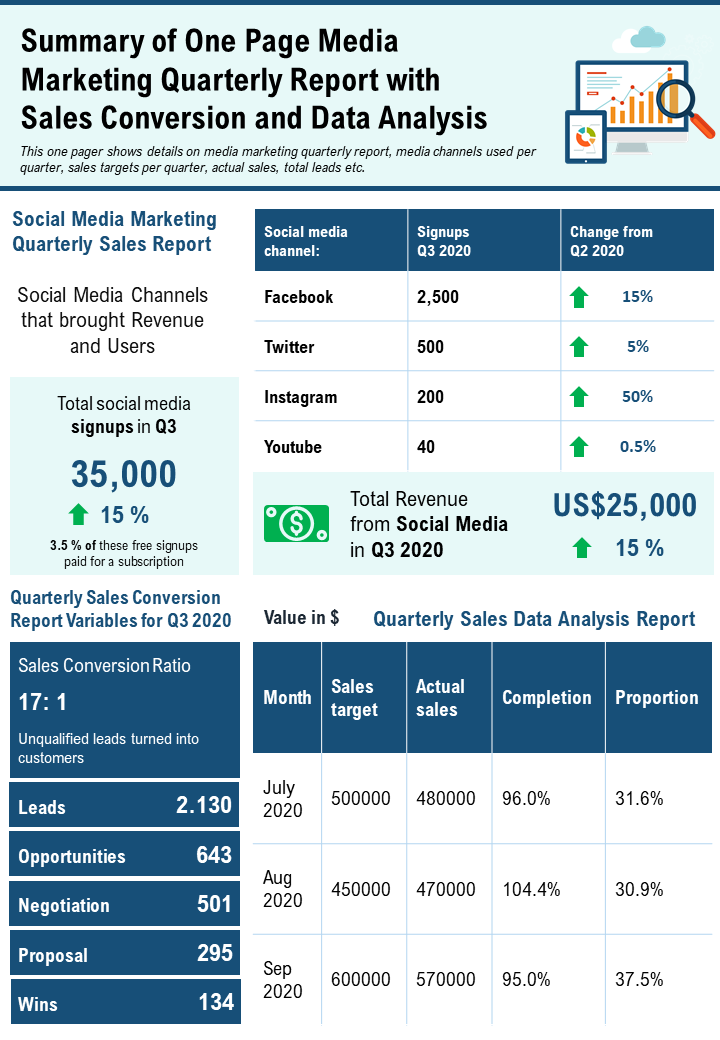
Present a well-crafted report on your marketing conversions with this template. It comes in very handy when you have to visualize data and stats of your social media campaigns. This helps in analyzing their viability or whether or not they need some alterations to make them better suited to the overall business environment. Also, make use of this document report to record the performance of various social media channels and the comparison ratio of each.
Template 9
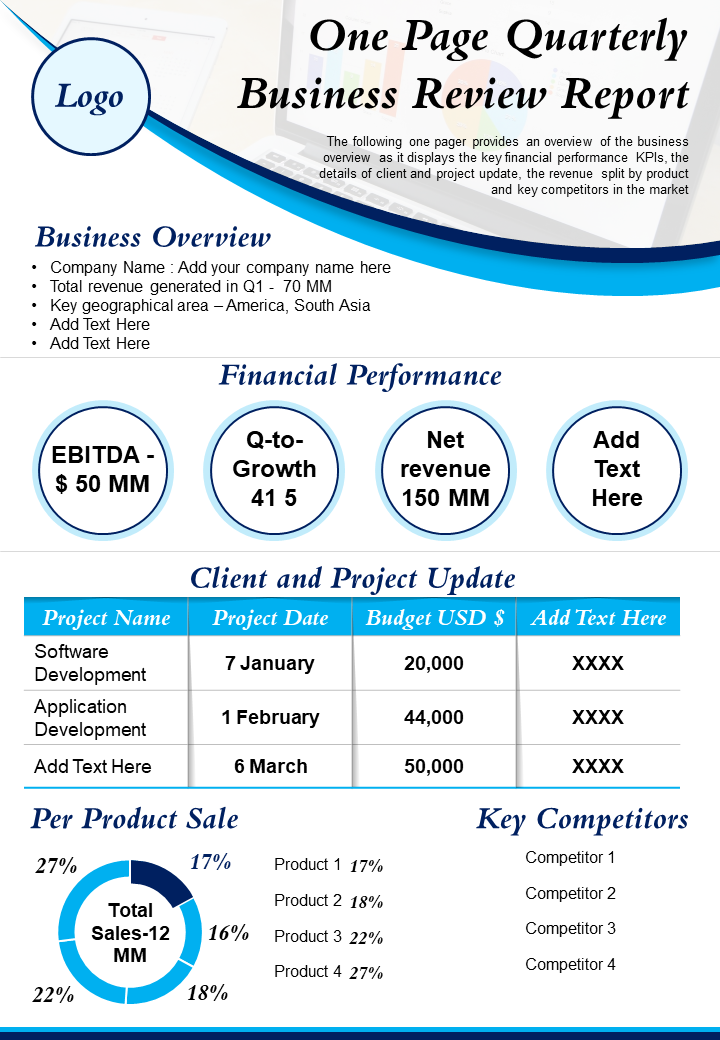
Are you looking for a way to make your business reports more comprehensive? Then make use of this one-page quarterly report template that uses professional color and theme. Record and present a thorough business analysis with this report template that comes in an editable format. As such it can be easily integrated into any industry depending upon the requirements.
Download One Page Quarterly Business Review Report Presentation Report Infographic PPT PDF Document
Template 10
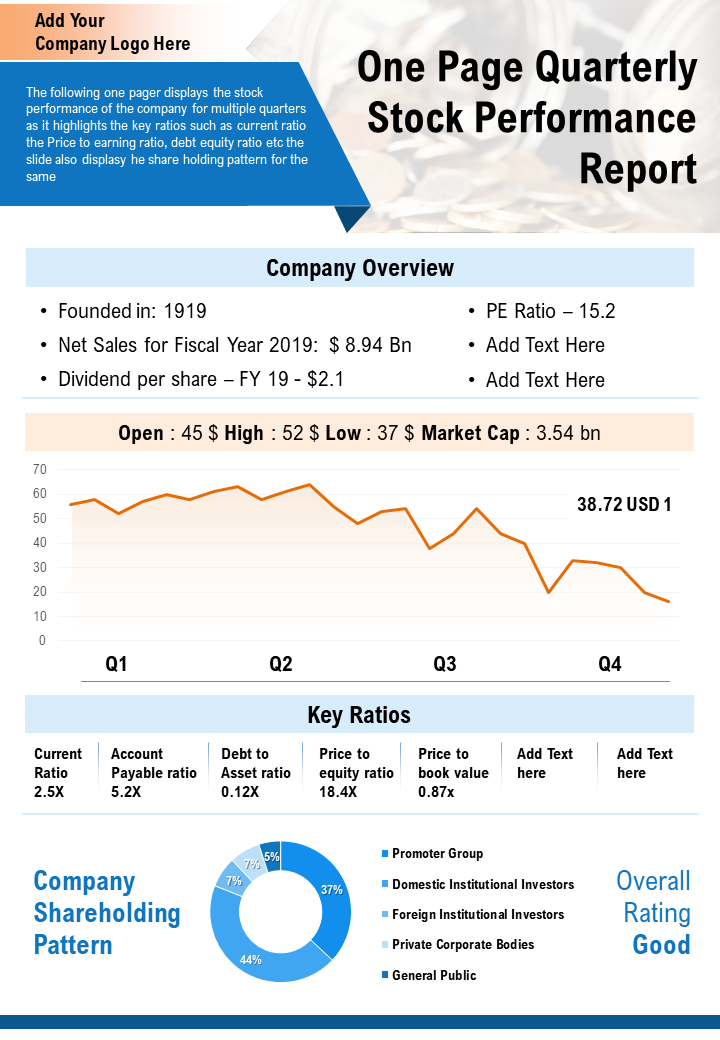
Present an overview of your portfolio performance in a lucid format using this one-pager. Since everything is displayed on a single page, complex data can be easily interpreted and shared in an easily-digestible format. Not only that, but the charts and graphs are also Excel-linked, thus giving you full control over their alteration.
Template 11
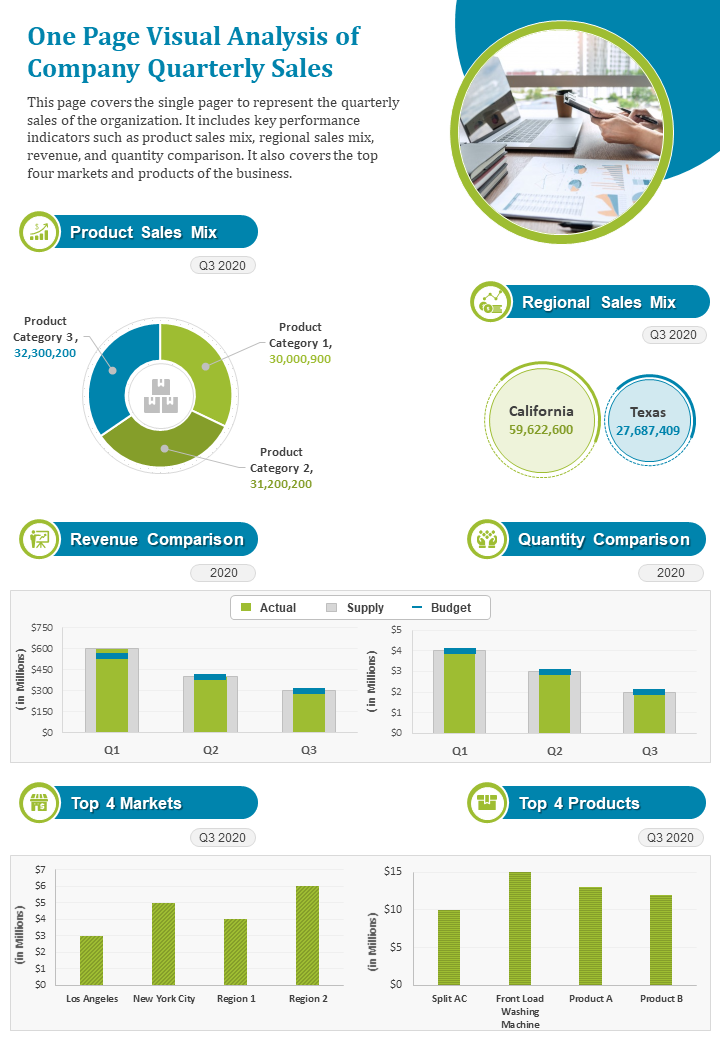
Showcase different sales trends and their overall impact on the product using this quarterly report template. Since this is a one-page layout, it offers information in a very crisp format. It also reduces the downtime of creating a sales report from scratch, thus saving resources.
Download One Page Visual Analysis Of Company Quarterly Sales Presentation Report PPT PDF Document
Template 12
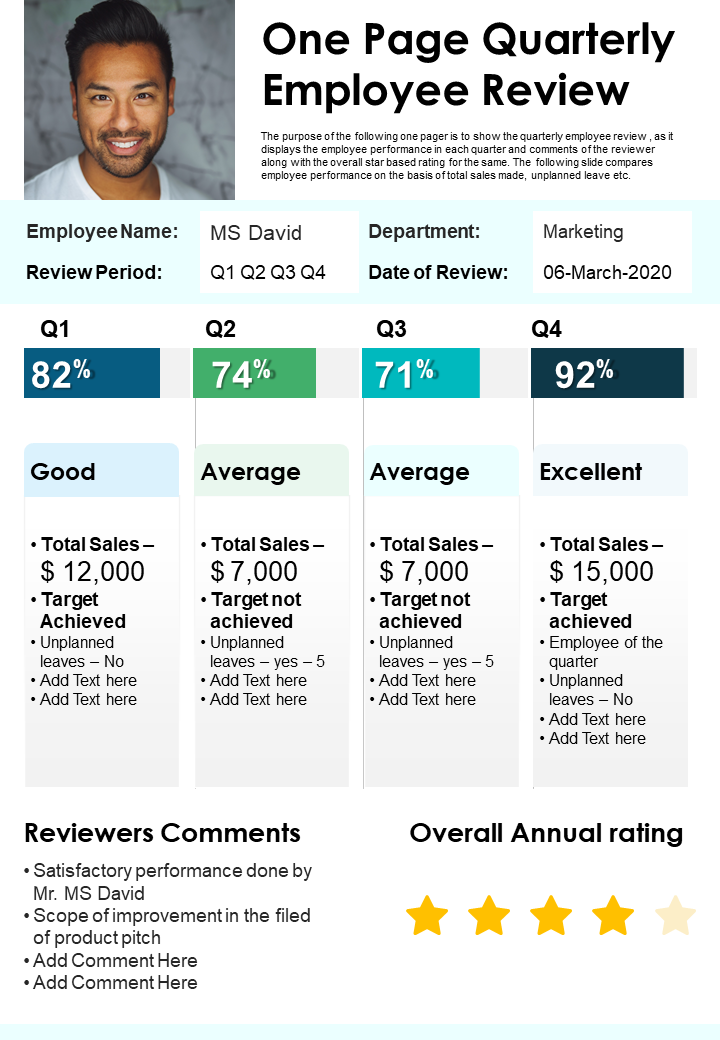
Examine quarterly goals and objectives against employees’ achievements with this document report which comes with a host of features. Use it to improve upon your two-way conversations based on the data retrieved. You can also deploy this quarterly report design to lay out some important facts and figures that can motivate the employees to deliver their best. In short, it is a complete package that guarantees a positive outcome every time you use it.
Download One Page Quarterly Employee Review Presentation Report Infographic PPT PDF Document
Template 13
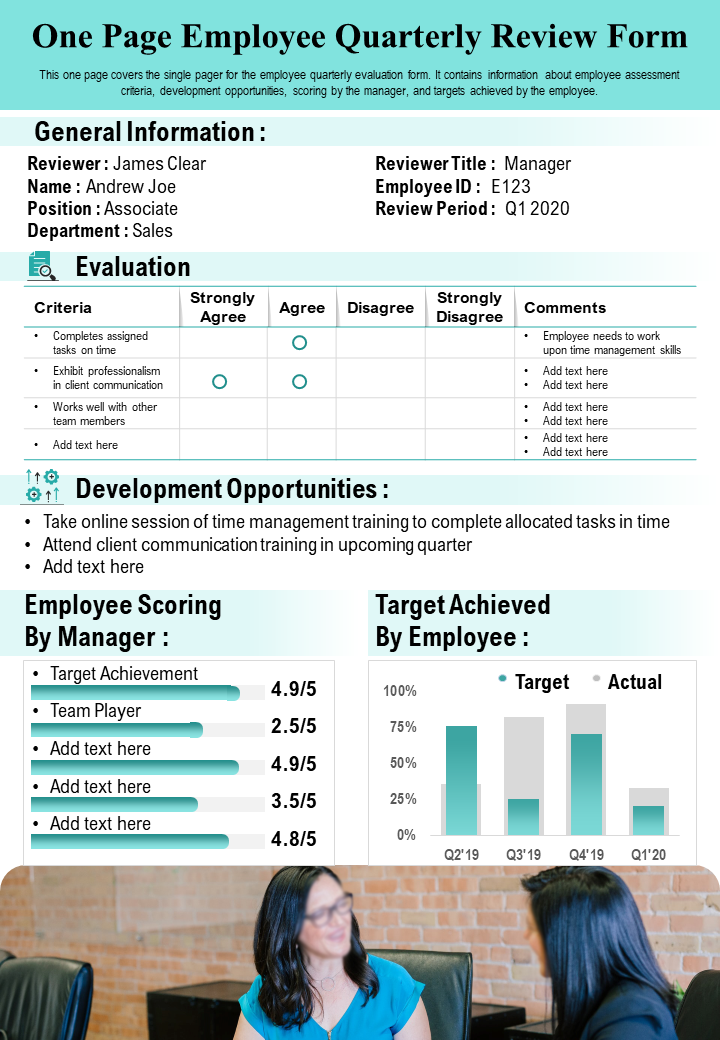
This is yet another employee-friendly quarterly report template that can be downloaded and used. It acts as a self-evaluation report that can bring some drastic shifts in the way an employee works. They can become their own critique on the basis of the stats retrieved. Not only that, the management can use this intuitively-designed document report to judge the employee’s productivity on various parameters, thereby formulating policies to improve the stats one by one.
Download One Page Employee Quarterly Review Form Presentation Report Infographic PPT PDF Document
Template 14
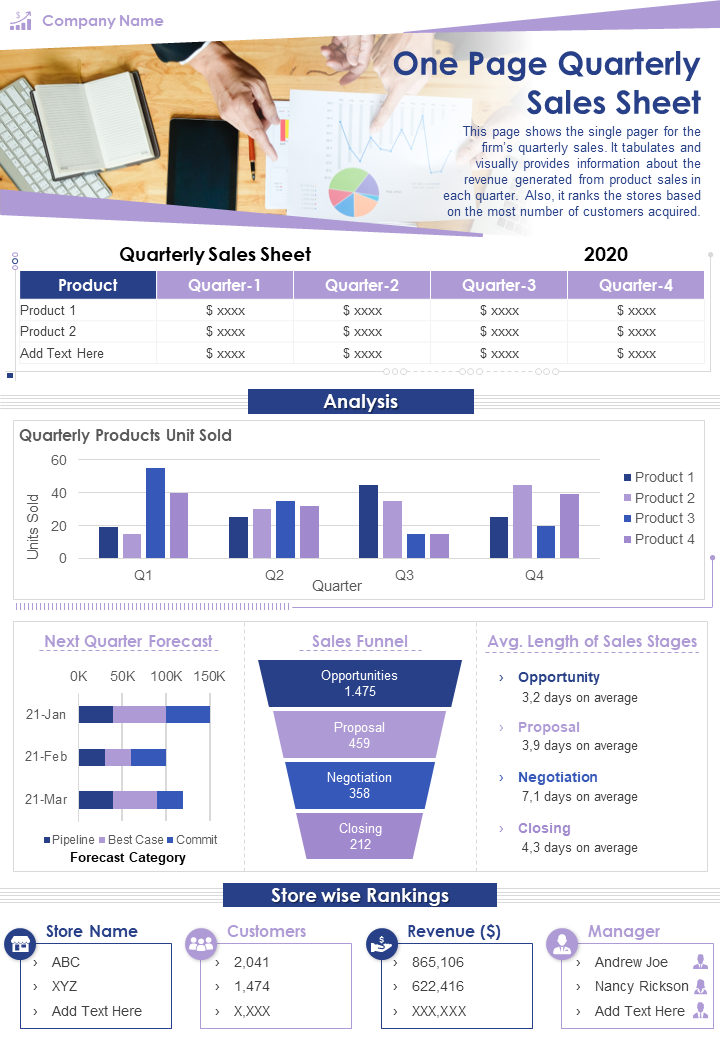
Another quarterly sales report to save your day! Present a professional snapshot of your sales effort with this well-crafted bundle. It is a complete package as all the vital information about the sales performance can be presented using a single layout. Not only this, but it also has high utility for any industry owing to its professional aesthetics.
Download One Page Quarterly Sales Sheet Presentation Report Infographic PPT
Template 15
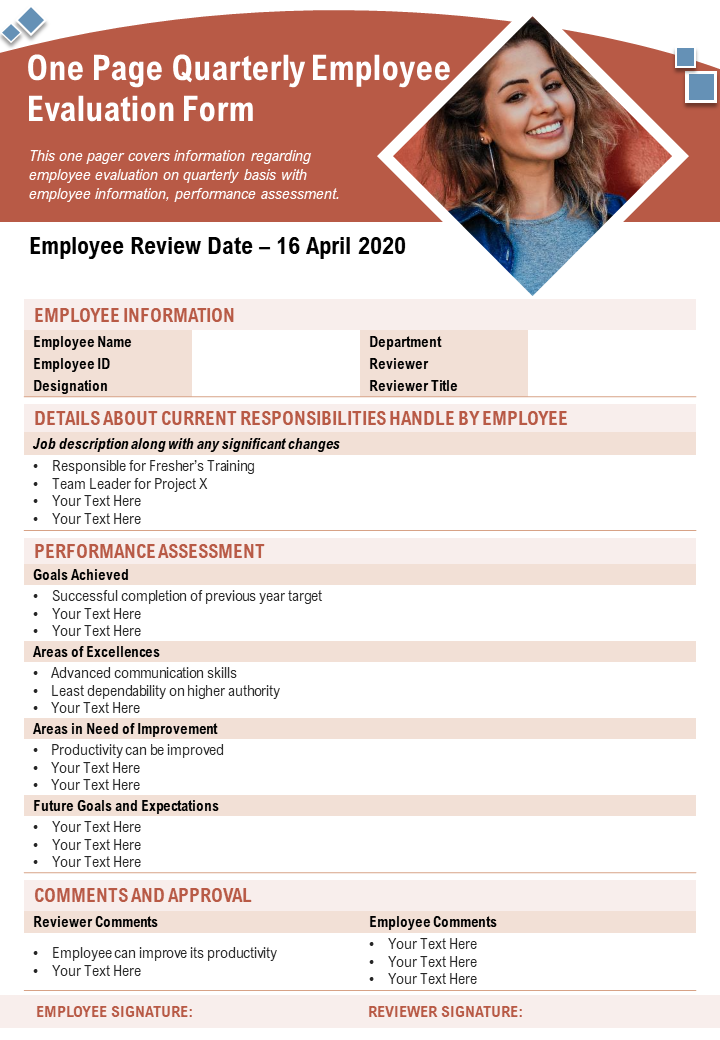
Evaluate the performance of your employees and craft good policies using the data retrieved. This set comes with a host of features, out of which its editability tops the list. Not only that, it also offers a lucid representation of everything important, making it a valuable asset. As such any user can deploy and reap its benefits.
Download One Page Quarterly Employee Evaluation Form Presentation Report PPT PDF Document
To conclude……
Empower your team to go above and beyond mundane report formats and adopt one-page designs like the ones shown above.
We have an entire gallery of one-pagers that are not only limited to reports but also brochures, resumes and a lot of topics that will surely be of assistance. Learn more about these one-pagers here.
FAQs on Quarterly Report
What is a quarterly report?
A quarterly report is a summary of a company's financial and operational performance that is released every three months, or four times a year. The report is typically published by publicly traded companies and is made available to shareholders, investors, and the general public.
The quarterly report provides a detailed overview of the company's financial performance during the preceding quarter, including revenue, profits, expenses, and cash flow. It also includes a discussion of the company's business operations, market trends, and future prospects.
In addition to financial information, a quarterly report may also include non-financial information such as updates on the company's products or services, changes in management or leadership, and information about significant events or milestones.
How do you write a quarterly report?
Writing a quarterly report can seem daunting, but it can be made easier by following a structured approach. Here are some general steps to help you write a quarterly report:
- Review financial and operational data: Gather data related to the company's financial performance for the quarter, including revenue, expenses, and profits. Review operational data such as sales figures, customer retention rates, and production metrics.
- Analyze the data: Once you have collected the data, analyze it to identify trends, strengths, and weaknesses. Identify areas where the company performed well and areas where improvements could be made.
- Prepare an executive summary: Write an executive summary that provides a high-level overview of the company's performance during the quarter. The summary should include key metrics and highlight significant achievements or challenges.
- Write the main body of the report: In the main body of the report, provide detailed information on the company's financial and operational performance. Use charts, tables, and graphs to present data in an easy-to-understand format.
- Discuss key initiatives and future plans: Provide an overview of any major initiatives or projects undertaken during the quarter, and discuss plans for the next quarter or beyond.
- Include supporting documentation: Include supporting documentation such as financial statements, income statements, and cash flow statements, as well as any other relevant documents that support the report's findings.
- Proofread and edit: Before finalizing the report, proofread and edit it for clarity, consistency, and accuracy.
Overall, a quarterly report should be informative, easy to understand, and well-organized. By following these steps, you can create a professional and effective quarterly report that provides valuable insights into your company's performance.
When do companies report quarterly earnings?
Companies typically report their quarterly earnings about a month after the end of the quarter, although the specific date may vary depending on the company and the exchange where it is listed.
In the United States, companies listed on the major stock exchanges such as the New York Stock Exchange (NYSE) and NASDAQ typically report earnings during "earnings season," which occurs four times a year, after the end of each quarter. The exact dates for earnings season can vary, but it typically begins in mid-January for Q4 earnings, followed by mid-April for Q1 earnings, mid-July for Q2 earnings, and mid-October for Q3 earnings.
Outside of the United States, the reporting dates for quarterly earnings may vary depending on local regulations and customs. However, most companies aim to release their earnings reports as soon as possible after the end of the quarter to keep shareholders and investors informed about their financial performance.
What are the components of a quarterly report?
The specific components of a quarterly report can vary depending on the company and its industry, but typically include the following sections:
- Executive Summary: This section provides a brief overview of the company's financial and operational performance for the quarter, highlighting key metrics and achievements.
- Management Discussion and Analysis (MD&A): The MD&A section provides a detailed analysis of the company's financial performance, discussing the underlying factors that contributed to the results. This section also includes a discussion of significant events, trends, and risks affecting the company's business.
- Financial Statements: The financial statements section includes the company's balance sheet, income statement, and cash flow statement for the quarter. These statements provide a detailed breakdown of the company's financial performance, including revenue, expenses, and profits.
- Notes to Financial Statements: This section provides additional information and context related to the financial statements, including accounting policies, disclosures, and any significant events or transactions that may impact the company's financial position.
- Management Outlook: The management outlook section provides an overview of the company's plans and projections for the next quarter or beyond. This section may include discussion of strategic initiatives, product launches, or other factors that may impact the company's financial performance in the future.
- Other Information: Depending on the company and industry, the quarterly report may also include other information such as operating metrics, customer data, or regulatory disclosures.
Overall, the quarterly report is intended to provide investors, analysts, and other stakeholders with a comprehensive understanding of the company's financial and operational performance during the quarter, as well as its prospects for the future.


![[Updated 2023] Top 15 Quarterly Report Templates For All Industries](https://www.slideteam.net/wp/wp-content/uploads/2020/12/size1001-436-25-1001x436.jpg)


 Customer Reviews



![[Updated 2023] Report Writing Format with Sample Report Templates](https://www.slideteam.net/wp/wp-content/uploads/2020/10/size1001-436-16-335x146.jpg)


