

Sales Review Powerpoint Presentation Slides




Try Before you Buy Download Free Sample Product
 Impress Your
 Audience
 100%
100% Editable
 Save Hours
 of Time


Owing to the importance of sales in a firm, we are showcasing predesigned sales review PowerPoint presentation slides. To know whether your sales strategy worked or not, you have review sales performance PPT template to showcase the numbers. Here in these designs we will cover quarterly business review, sales performance, sales target achievement, net profit, revenue, and other aspects of business sales. Other related topics that this PowerPoint design covers are sales pipeline review, sales management, review performance, and assessing sales. Sales Management is an important function of any business as most of the profit is derived from the sale of product and services. It has been seen that companies with a clearly defined business sales strategy tend to have greater revenue growth than the ones that don’t. Whether you are working with your internal team, or with one of your lead generation clients, download our sales review presentation graphics to cover all your needs. Give an informative address with our Sales Review Powerpoint Presentation Slides. Expose folks to a host of great ideas.
People who downloaded this PowerPoint presentation also viewed the following :
Content of this Powerpoint Presentation
Sales are the most important part of any business. It brings in revenue and profits. Hence, it's very important for a business to monitor sales activities. Sales Reviews help you do the same.
Sales Review formats can vary from business to business as one business may focus on a particular sales-associated element that may not be as relevant for others. An optimal solution to avoid this problem is to create a fresh sales review document from scratch. However, this is not easy. Drafting a review document requires time, energy and financial resources.
What's the solution, then?
The best solution in such a case is to use a pre-designed and all-inclusive sales review. Thankfully, SlideTeam's 100% editable sale review template is here to help. This template includes everything you need to showcase the eccentricities of the entire sales domain, including a business overview, financial highlights, and more. So, check out what this template offers in the coming sections.
Template 1: Business Overview
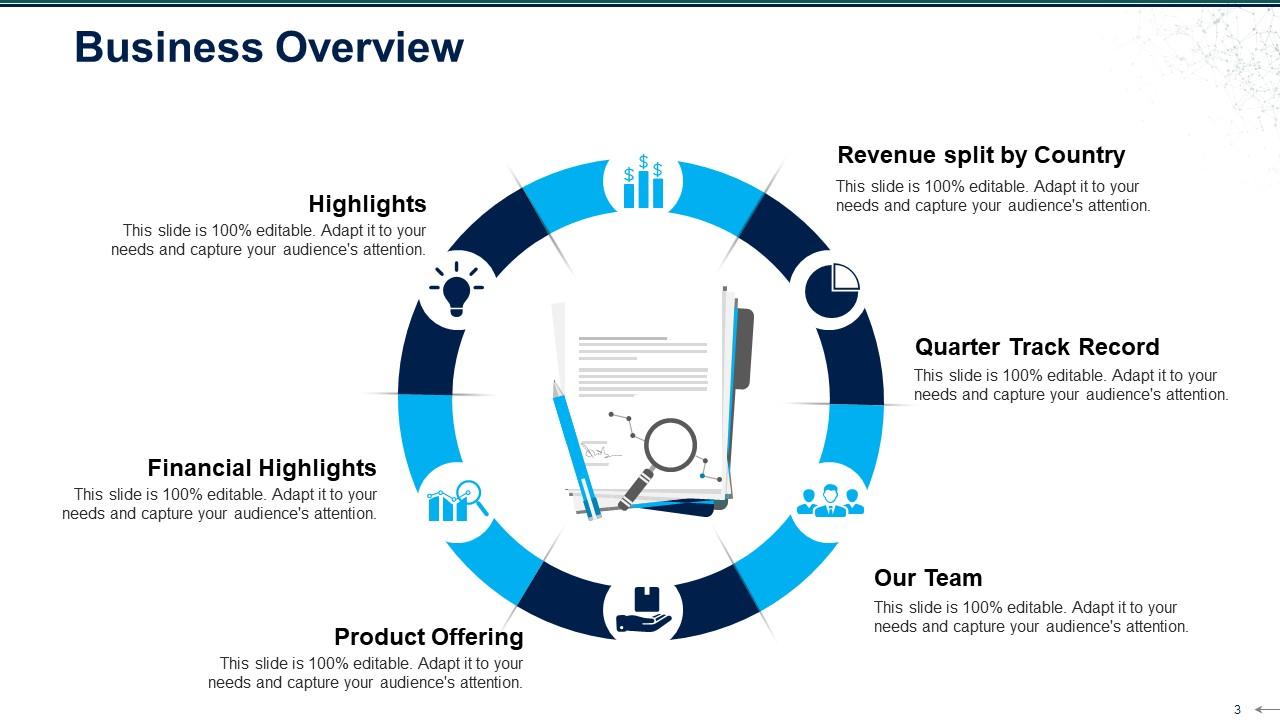
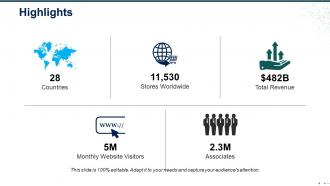
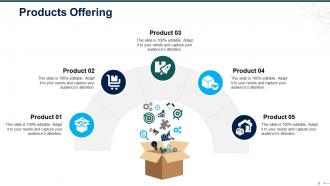
Offering a business overview is quite crucial in a sales review. The overview allows your audience to understand the main highlights of the corporation, such as its performance, the domain of your business, and more. This Business Overview slide helps you showcase your business's financial highlights, the overall distribution of the revenue according to countries, the track record of any quarter, the overall structure of the team, and the products offered to the buyers. You can include as much information within these highlights as you need.
Template 2: Financial Highlights
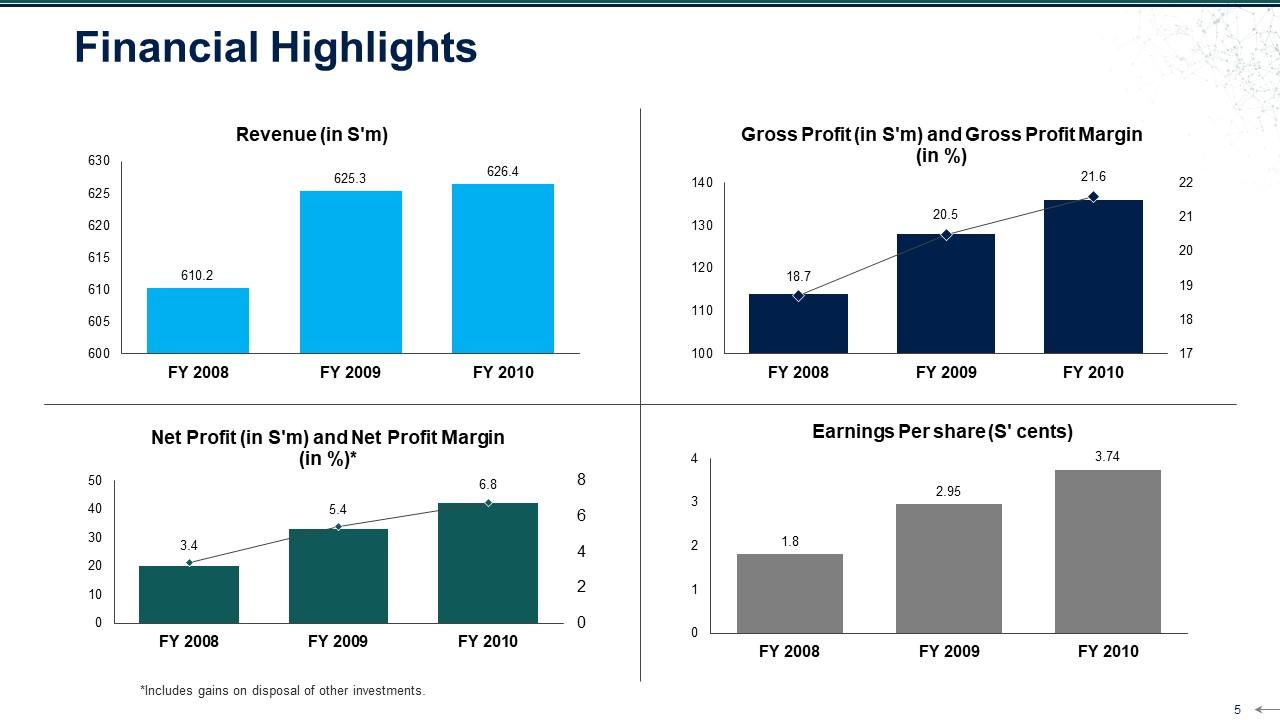
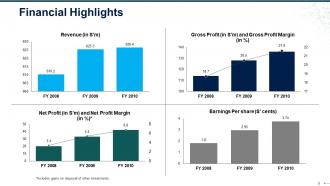
This financial highlight slide allows you to showcase in-depth information on the business's financial position and performance in previous years. Use it to showcase the changes in Revenue, Gross Profits, Gross Profit Margins, Net Profits, Net Profit Margins, and Earnings Per Share in three consecutive years. It includes bar and line graphs for better understanding.
Template 3: Revenue Split- By Country
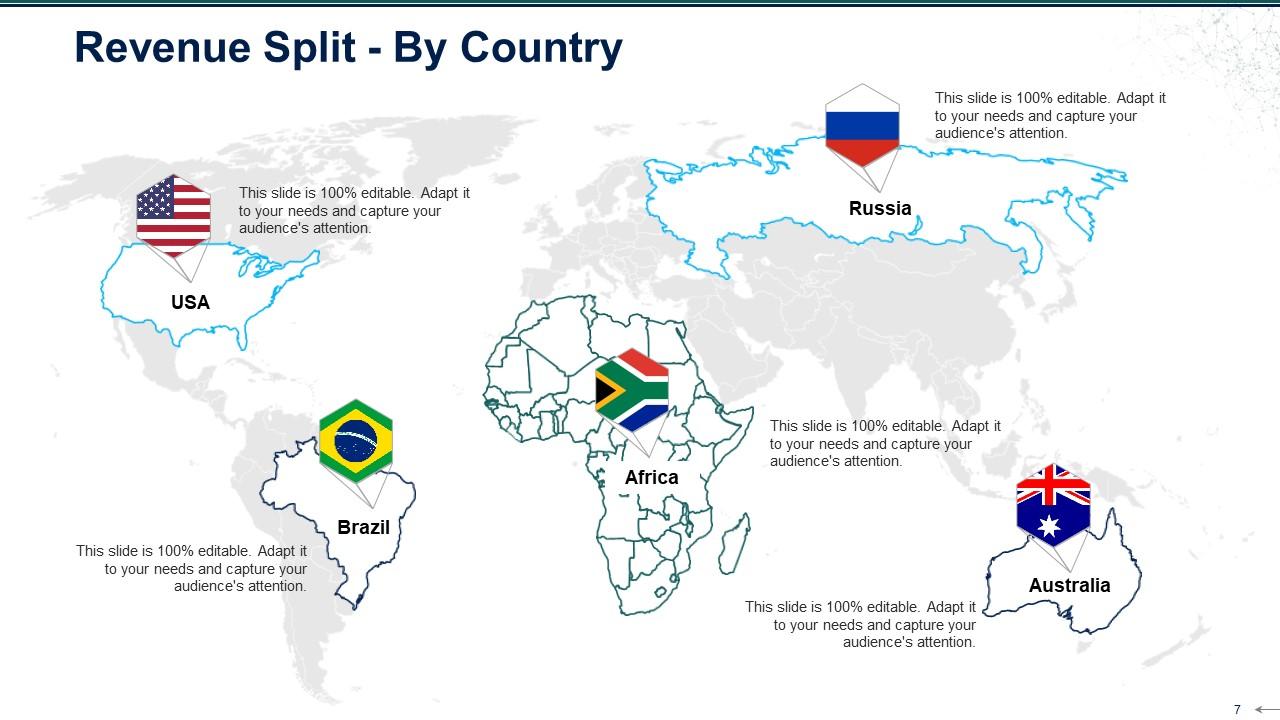
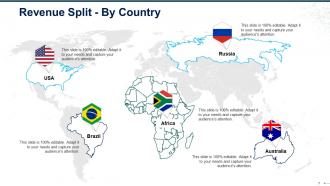
Gain the confidence of your stakeholders in your business by showcasing your organization's country-wise revenue split. This slide lets you present the actual numbers and other related details to showcase the revenue distribution in various countries. Within this template, you can showcase the revenue from countries like Russia, South Africa, Australia, Brazil, and the USA.
Template 4: Quarter Track Record
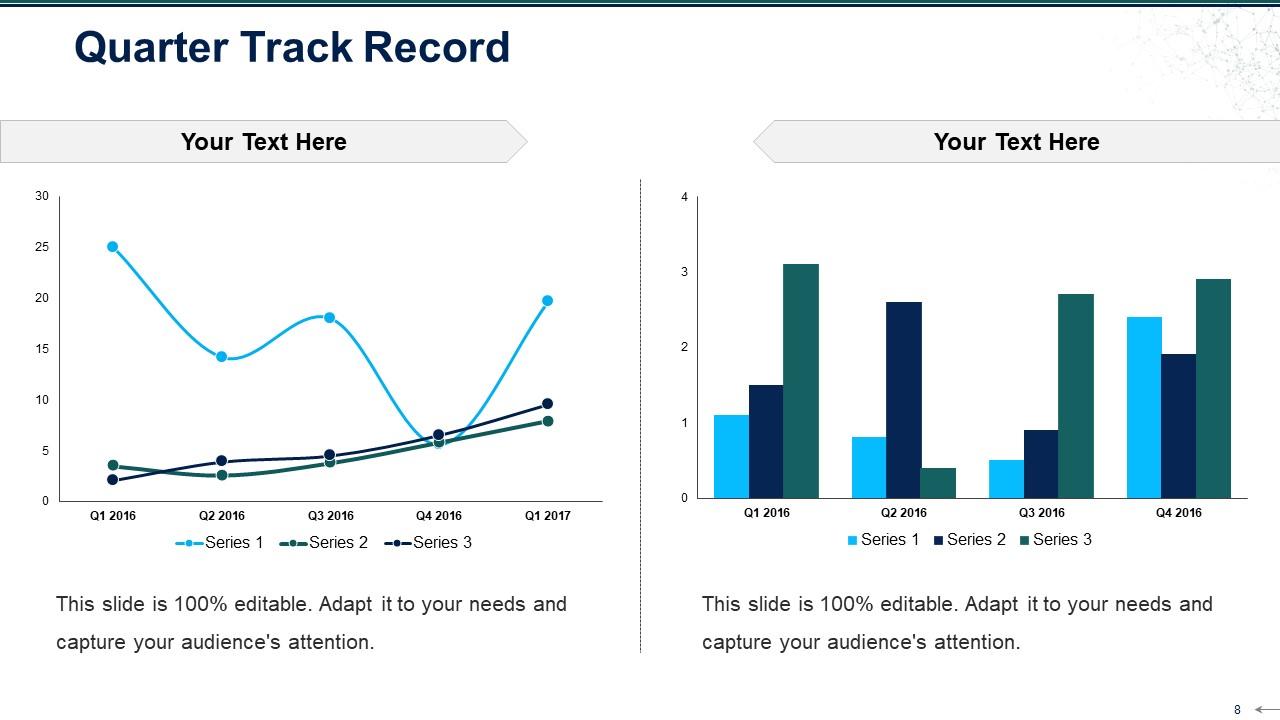
Use this PPT Template to highlight the track record of the business revenue within the previous quarters. For a feasible comparison of facts and figures, you can compare the data of up to five quarters of the precious years. The data is presented in line and bar graphs for your business and audience to comprehend. If required, you can also add explanatory texts below the graphs for a better understanding.
Template 5: Sales Performance Dashboard
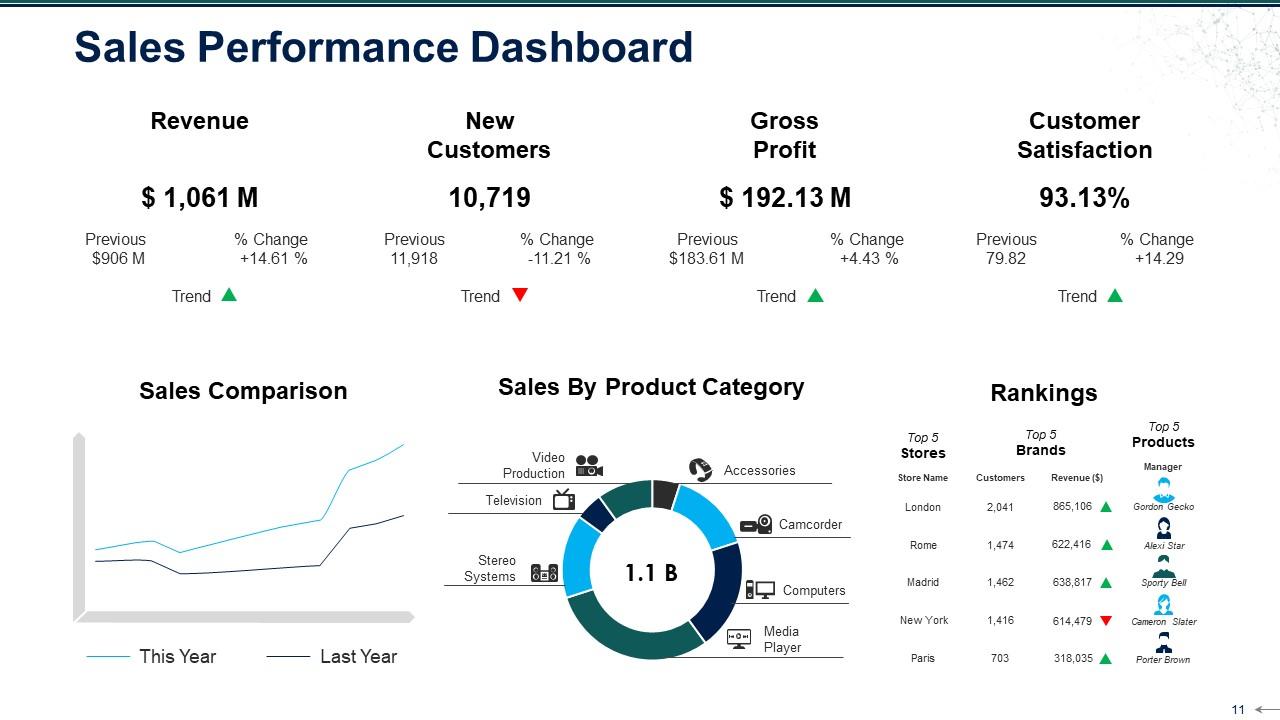
Using this sales dashboard, you can present data related to the overall revenue generated in the previous years, the total number of new customers gained by the business, the overall gross profit of the organization, and the performance of customers satisfied by your products and services. Apart from that, you can also use some charts to showcase sales comparisons, sales within any product category, and rankings of your products across different countries.
Template 6: Sales Rep Performance Scorecard
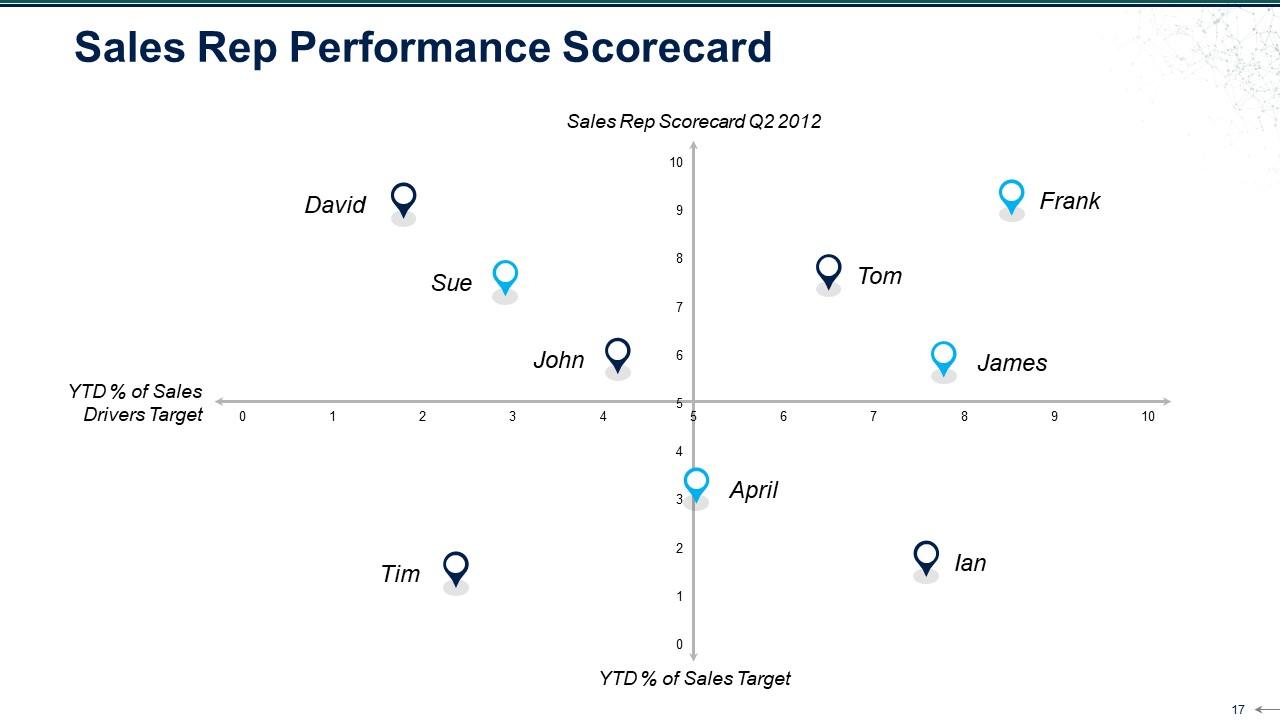
Use this PPT Template to present an analysis of your sales representatives' performance. This slide allows you to simultaneously compare the performance of multiple sales representatives in your organization. For extensive results, the comparison of representatives is done using two grounds, including the Date (YTD) percentage of Sales Drivers Target (x-axis) and the YTD percentage of Sales Target (y-axis). You can pin out the names of the sales representatives on the graph to showcase where their respective performances stand.
Template 7: Sales KPI Performance Summary
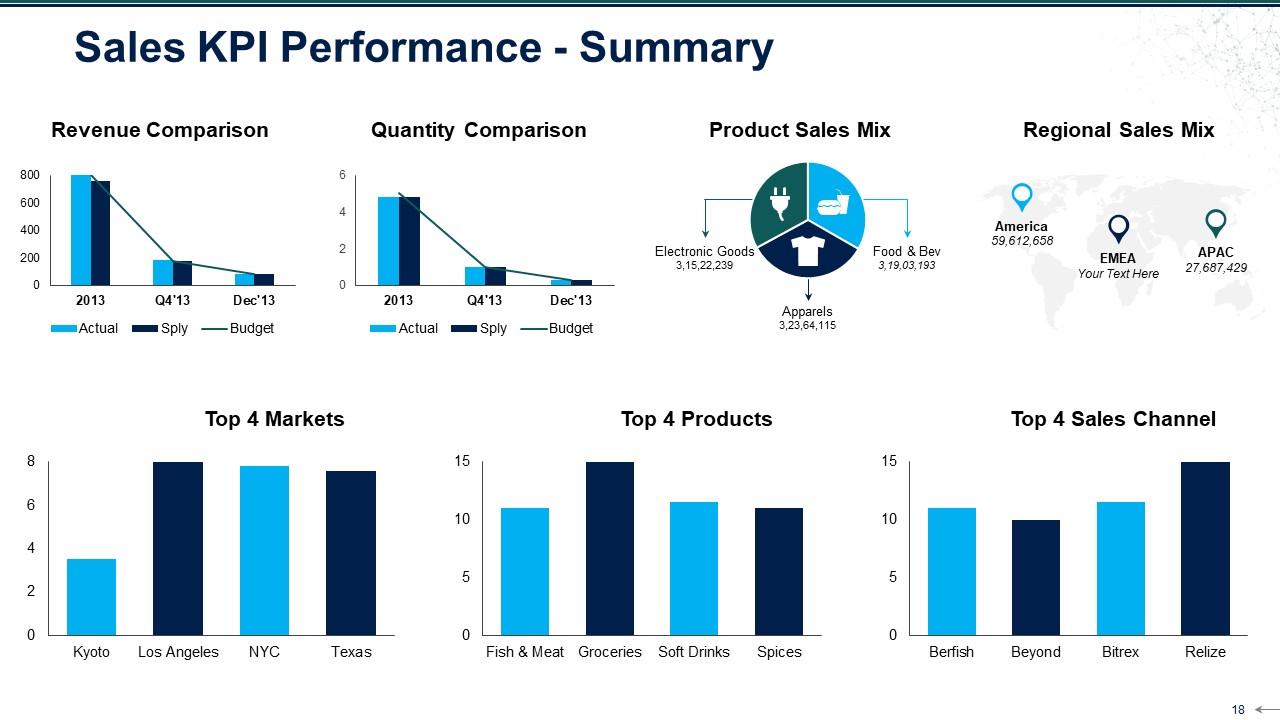
Showcase the entire summary of the sales performance KPIs for your audience with this PPT Slide. You can add bar/line graphs and charts for Revenue comparison, Quantity Comparison, Product Sales Mix, Regional Sales Mix, Top 4 Markets (for sales), Top 4 Products (sold), and Top 4 Channels (for sales).
Template 8: Sales Process Map
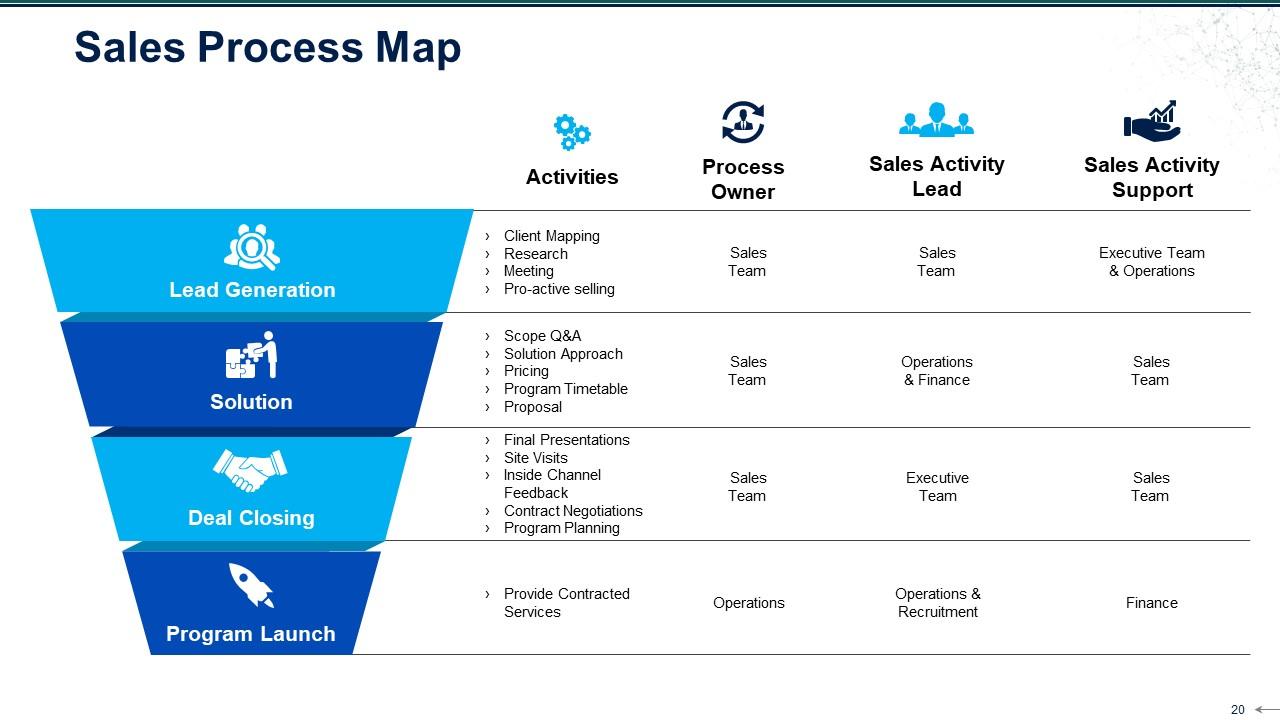
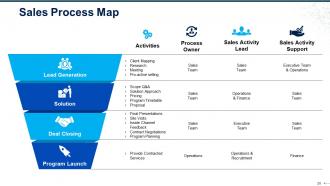
This PPT Slide helps introduce your audience to the entire sales process, from lead generation to conversion. It showcases the sales process using a tabular format. The columns represent Activities, Process Owner, Sales Activity Lead, and Sales Activity Support. The rows showcase the four steps of the process: Lead Generation, Solution, Deal Closing, and Program Launch.
Template 9: Sales Activities Dashboard
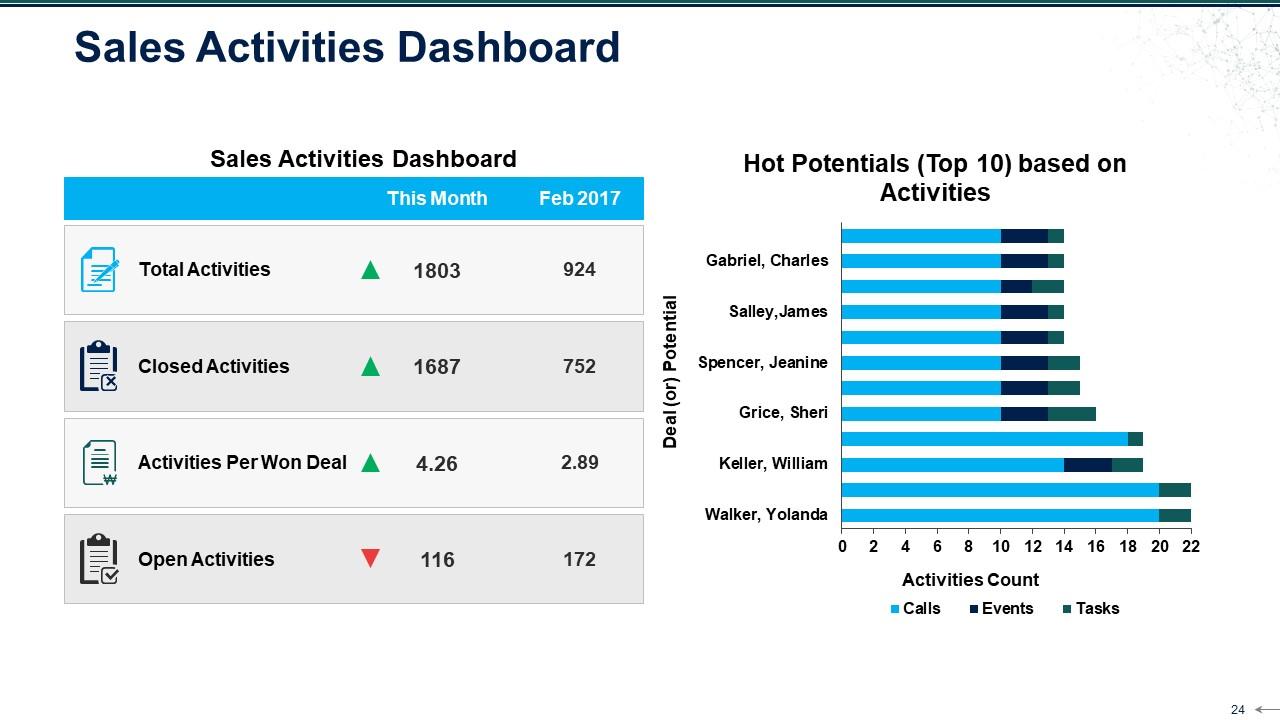
If you want to present a detailed presentation of your business's sales activities, this slide will help you immensely. You can represent everything from the Total Activities to closed Activities, Activities Per Won Deal, and Open Activities to showcase the growth or shrinkage in the data compared to the previous year using green and red arrows, respectively. Also, you can use a bar graph to showcase the top ten potentials generated from the activities.
Template 10: Sales Performance of Competitors
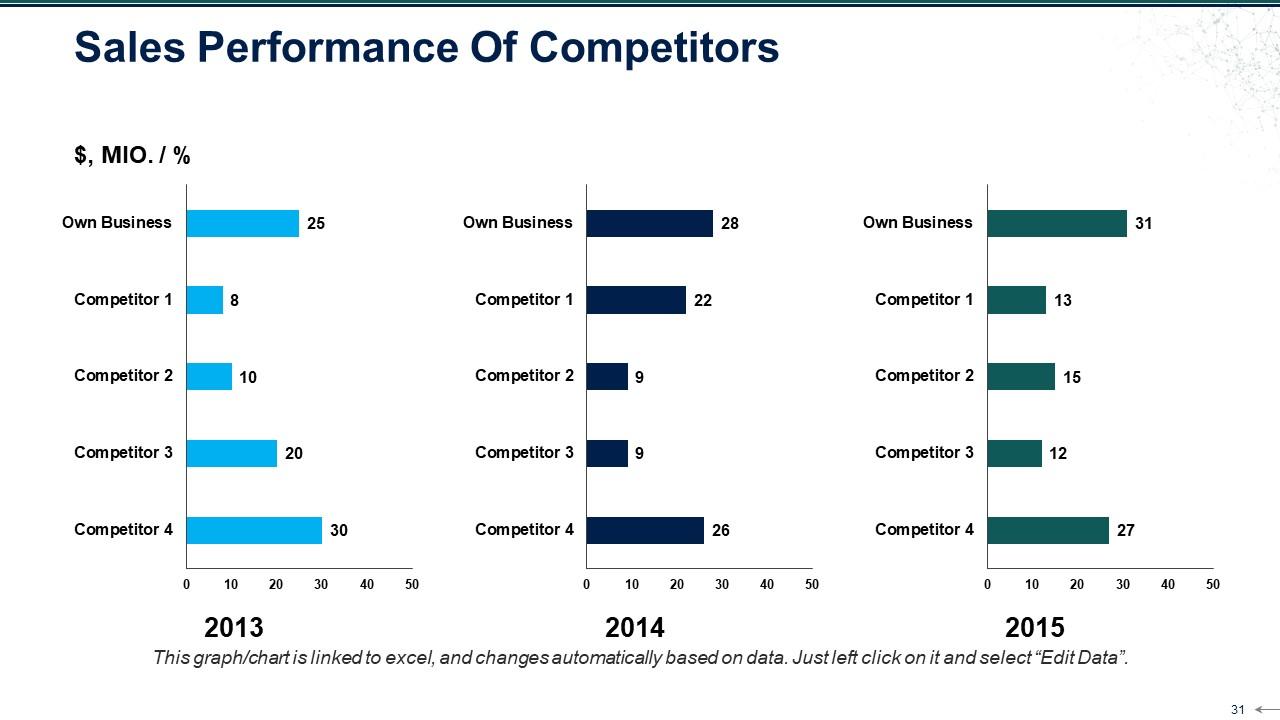
Stress from competitors is quite sensitive for any business. A sales review template is ineffective and weak if it does not represent the competitor's performance in previous years. This slide allows you to showcase the overall performance of the competitors in three previous years. You can compare the data of a maximum of four competitors for extensive understanding. Use this PPT Template to help your audience ascertain whether your business's sales performance has been adequate, sub-par, beyond expectations, or otherwise.
Sales Review and Analysis: The Game Changer for Your Business
A sales review is a smart and efficient way for a business to understand the previous year's sales performance and patterns and monitor the KPIs and competitors' performance for deeper analysis. Using the information from a sales review, the business and its audience can understand what's working and what's not in the sales domain and work further for improvements as the scope allows.
Sales Review Powerpoint Presentation Slides with all 65 slides:
Freedom gets a boost with our Sales Review Powerpoint Presentation Slides. Folks find their fears disappearing.
-

Sales Review
-
Content
-

Business Overview
-
Highlights
-
Financial Highlights
-
Products Offering
-
Revenue Split By Country
-
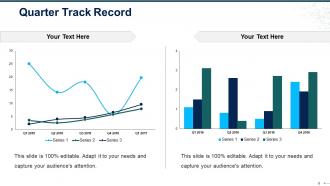
Quarter Track Record
-
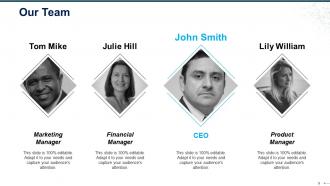
Our Team
-
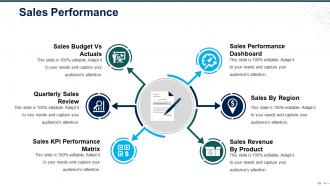
Sales Performance
-
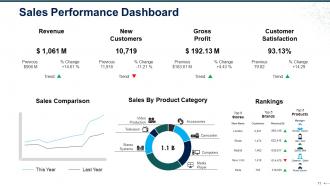
Sales Performance Dashboard
-
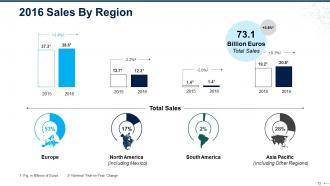
2016 Sales By Region
-
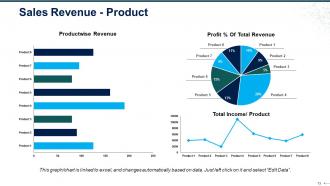
Sales Revenue Product
-
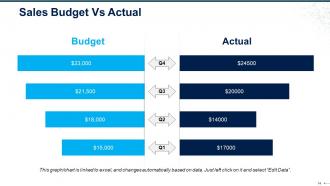
Sales Budget Vs Actual
-
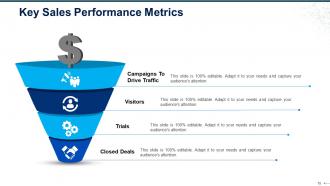
Key Sales Performance Metrics
-
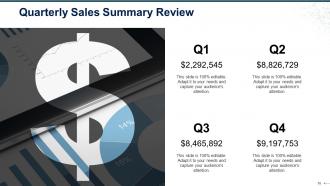
Quarterly Sales Summary Review
-
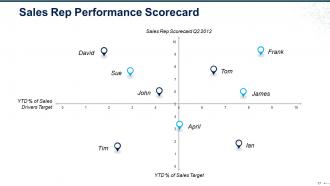
Sales Rep Performance Scorecard Q2 2012
-
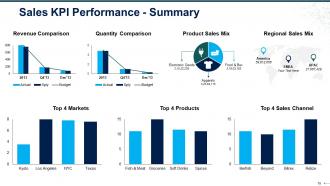
Sales KPI Performance Summary
-
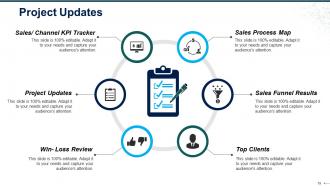
Project Updates
-
Sales Process Map
-
Sales Funnel Results
-
Top Customers Vendors
-
Top Debtors Creditors
-
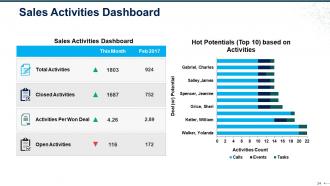
Sales Activities Dashboard
-
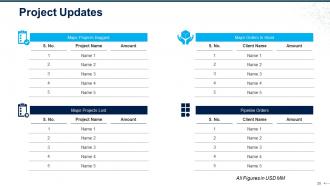
Project Updates
-
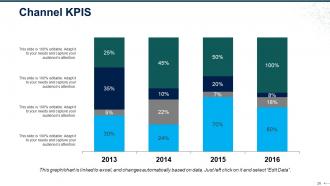
Channel KPIS
-

Sales KPI Tracker
-
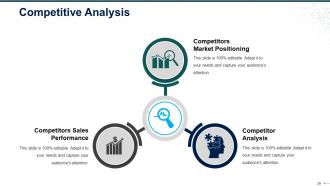
Competitive Analysis
-
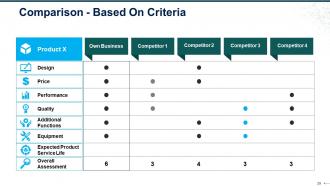
Comparison Based On Criteria
-
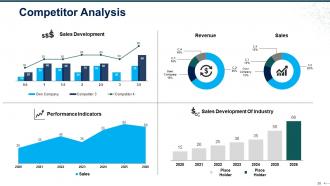
Competitor Analysis
-
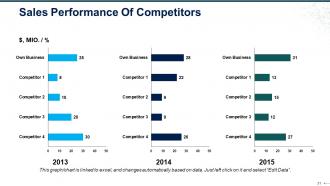
Sales Performance Of Competitors
-
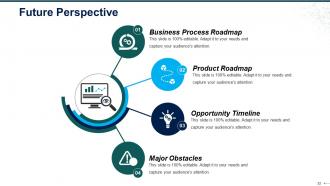
Future Perspective
-
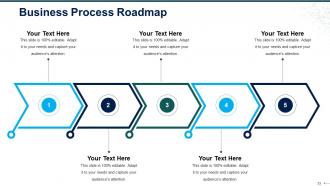
Business Process Roadmap
-
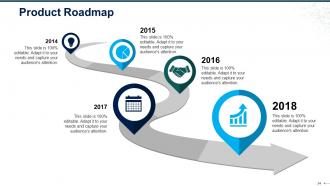
Product Roadmap
-
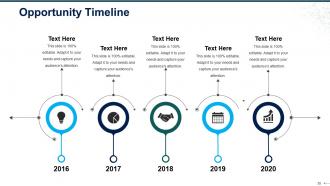
Opportunity Timeline
-
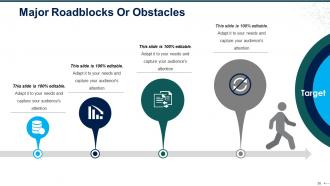
Major Roadblocks Or Obstacles
-

Coffee Break Time
-
Sales Review Icon Slide
-
Sales Review Icon Slide
-
Charts Graphs
-
Column Chart
-
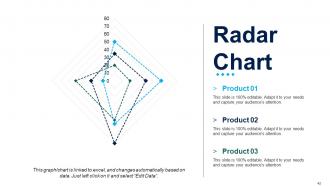
Radar Chart
-
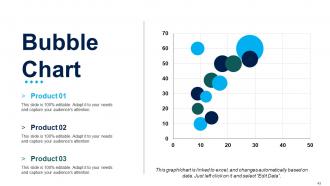
Bubble Chart
-
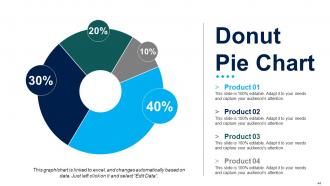
Donut Pie Chart
-
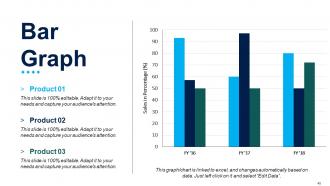
Bar Graph
-
Additional Slides
-
Our Mission
-

About Our Company
-
Quotes
-
Our Main Goal
-

Comparison
-
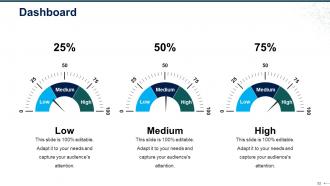
Dashboard
-
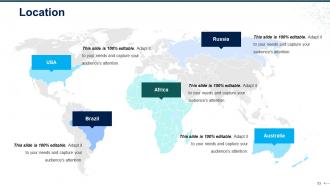
Location
-
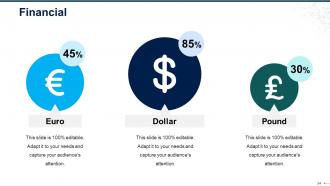
Financial
-
Puzzle
-
Target
-
Circular
-
Lego
-
Mind Map
-
Silhouettes
-
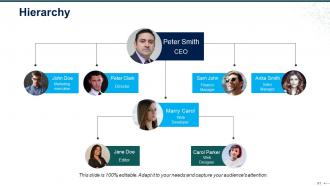
Hierarchy
-
Venn
-
Magnifying Glass
-
Bulb With Idea
-

Thank You Slide
FAQs for Sales Review
Check your pipeline growth first - is it actually growing consistently? Then look at conversion rates and how fast deals move through stages. Your reps probably aren't hitting their call/meeting numbers (they never do lol), so definitely check activity metrics. Lost deals are goldmines for figuring out where your process sucks. Deal size and cycle length tell you if you're going after the right people. Just pull up your CRM and compare this month to last month. You'll spot problems way faster that way.
Templates are a lifesaver for sales reviews - trust me on this one. Your team won't waste time wondering what to cover next. Hit the big stuff: pipeline health, conversion rates, deal movement. When everyone uses the same format, spotting trends becomes way easier. You can actually compare month-to-month without digging through random slides. Less prep time, more focus on what the numbers are telling you. Oh, and you won't accidentally skip important metrics when you're running behind (which let's be honest, happens). Start simple: last month's results, current pipeline, next month's forecast.
Don't turn it into a blame session - that kills everything. Your reps will clam up and you'll get zero useful info. Also avoid cherry-picking data just to prove your point. I've seen managers get lost analyzing every tiny detail instead of spotting the real patterns. Make it a conversation, not some boring presentation where you drone on. Ask stuff like "What caught you off guard this quarter?" before jumping into spreadsheets. Open questions work way better than accusations. Oh, and actually listen when they tell you what's happening out there - they're the ones dealing with customers daily.
Honestly, charts and graphs are game-changers for sales reviews. Your brain just processes visuals way faster than staring at spreadsheet cells all day. When I show bar charts for quota numbers or line graphs for monthly trends, people actually get it right away. No more squinting at endless rows trying to figure out if we're hitting targets or totally missing the mark. Dashboards let you dig into specific stuff too - like, you can click around and see what's actually driving the numbers. Trust me, once you start doing this your team meetings will be so much smoother.
Team feedback is where you'll get the real story - not just what the numbers say. Your reps are in the trenches talking to prospects all day, so they know which objections keep popping up and what messaging actually works. Some of my biggest strategy wins came from random comments during team meetings, honestly. Create a space where people can share what's broken, not just wins. Ask specific stuff about deal patterns and what competitors are doing. That's gold right there. Oh, and make sure they feel safe being honest - otherwise you'll just get fluff.
Look at your historical data first and aim for maybe 10-20% above last period. Then just watch what actually happens vs. what you planned. Hitting 120% consistently? You set it too easy (though that's not the worst problem to have lol). Stuck at 60%? Either the market changed or your assumptions were way off. I'd adjust every quarter based on those patterns, plus stuff like seasonality and what your team's telling you is actually realistic. You want to stretch people but not crush their soul, you know?
Honestly, ditch the spreadsheet reviews - nobody stays awake for those. Get your team talking about real deals and actual customer conversations instead. Have different reps share their wins and biggest challenges. Throw in some competition too, like leaderboards or spotlighting cool deals. Time-box everything so it doesn't drag on forever. Make it interactive with Q&A and problem-solving stuff rather than just lecturing at everyone. Always wrap up with clear action items and who's doing what. Oh, and this might sound obvious, but people need to walk away feeling like they actually learned something useful, not like they just survived another pointless meeting.
Honestly? Monthly is probably your best bet starting out. Gives you actual data to work with instead of just random daily chaos. I've seen teams try weekly and it's brutal - everyone's burnt out from constantly analyzing every tiny fluctuation. Bi-weekly is the sweet spot once you get rolling though. Keeps things moving without being overwhelming. The real trick is just being consistent about it. Pick whatever feels right and don't keep switching around. Your team will get into a groove and probably start asking for more frequent check-ins naturally. Start monthly, see how it goes.
Honestly, it totally depends on what kind of business you're running. B2B companies should watch deal size and how long sales cycles take - those enterprise deals are brutal. For retail/e-commerce, conversion rates and average order value matter way more. SaaS? You gotta track MRR and churn like your life depends on it (because it kinda does). Manufacturing is different - quote-to-close ratios and seasonal patterns. My advice? Pick 3-4 metrics that actually connect to how you make money. Don't get lost tracking everything under the sun. Start simple and stay consistent with whatever you choose.
Honestly, start by digging into your last 12-18 months of data - I know, spreadsheets aren't sexy but they'll save your ass here. Look for patterns like seasonality and what actually drove your big wins vs losses. Pipeline velocity and conversion rates by source are gold for predicting what's coming next. Map all this against whatever external stuff was happening at the time (market changes, that one competitor who kept undercutting everyone, etc). The trick is being real about what you can actually repeat versus those random one-off wins. Apply those patterns to your current pipeline and boom - way more realistic forecasts.
Here's what works for me - assign clear owners and deadlines right there in the meeting, none of that "we'll figure it out later" stuff. Always send a recap email within 24 hours listing who's doing what by when. I also drop action items in our Slack channel because let's be real, emails disappear into the void. Halfway through each deadline, I set calendar reminders to check in. The trick is making follow-up feel normal, not like you're being annoying. Everything goes in a shared doc so stuff doesn't get lost. Oh, and start your next meeting by reviewing what actually happened from last time - people hate this but it works.
Honestly, I just make different versions for different people - sounds like overkill but it works way better than trying to please everyone with one deck. Executives want the money stuff and big picture trends. Don't bog them down with details. Your team needs the opposite - pipeline breakdowns, coaching notes, what's actually blocking deals. Sales ops people are weird (in a good way) and get excited about process fixes and data cleanup. Figure out what's keeping each group up at night, then build backwards from there. Takes more time upfront but you'll actually get people to care about what you're saying.
First thing - dig into your funnel data and see where deals are dying. Call volume, email responses, meeting-to-close rates, all that stuff. Numbers don't lie, which honestly saves you so much guesswork. But here's the thing - data only tells half the story. Sit down with your struggling reps one-on-one. Could be skill issues, bad territory, or maybe they're just burnt out (happens more than people admit). Oh and don't just look at conversion rates overall - break it down by stage. You might find your team kills it at prospecting but sucks at closing. Fix the real problem, not just what looks broken on the surface.
During your performance reviews, spot the skill gaps and immediately create development plans right there. Don't just look at numbers - dig into what techniques actually worked and where they got stuck. Honestly, the best teams I've worked with turn these into mini coaching sessions instead of boring number reviews. Your CRM probably has tons of patterns you can pull from across reps. Build group training around those common issues everyone's hitting. Oh and make the training feel like it flows naturally from the review conversation - not some random corporate thing they'll get to eventually. Way more effective that way.
Salesforce or HubSpot are solid choices since they keep all your deal data in one place. For call analysis, Gong and Chorus are pretty great at spotting patterns you might miss. Don't sleep on a good Google Sheets setup though - sometimes simple beats fancy. The main thing is picking one system where you can grab performance metrics and forecasts fast. I'd start by figuring out what data you actually look at during reviews, then find the easiest tool that covers it all. Trust me, having everything scattered across different platforms is a nightmare.
-
good
-
Very good
-
Enough space for editing and adding your own content.
-
Designs have enough space to add content.