


Sales forecasting powerpoint presentation slides


Try Before you Buy Download Free Sample Product
 Impress Your
 Audience
Editable
of Time


Introducing our content ready Sales Forecasting PowerPoint Presentation Slides for market projection and analysis. Showcase process of estimating future sales with the help of this professionally designed demand analysis and forecasting. Market research and analysis PowerPoint complete deck includes a set of ready-to-use templates such as key statistics, market survey, understanding the market landscape, market analysis, opportunity size triangulation, market opportunity analysis, market sizing, intelligence framework, product opportunity evaluation, Ansoff matrix, identify underserved and unmet needs, bottom-up and top-down approach, recommendations, etc. The ready-to-use revenue forecast PPT slide allows users to strategically plan their moves to increase growth. Make use of this sales projection PowerPoint presentation to estimate likely revenues of a product. Besides this, the visually appealing market prediction PPT deck is also helpful to showcase your company plans for future sales. Therefore, download the high-quality professional looking to predict short term and long-term performance. Display an appropriate air of authority with our Sales Forecasting Powerpoint Presentation Slides. Arrive confidently at the helm of affairs.
People who downloaded this PowerPoint presentation also viewed the following :
Content of this Powerpoint Presentation
Slide 1: This slide introduces Sales Forecasting. State Your Company Name and begin.
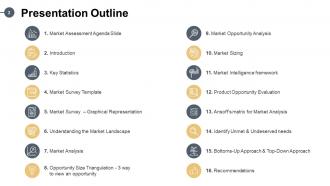
Slide 2: This slide shows Presentation Outline.
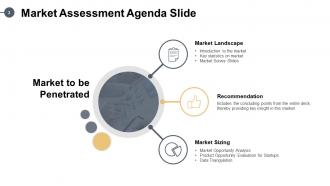
Slide 3: This slide presents Market Assessment Agenda Slide describing- Recommendation, Market Landscape, Market Sizing.
Slide 4: This is an Introduction slide with related imagery.
Slide 5: This slide displays Key Statistics describing- Cyber Attacks are Unnoticed, Devices are Vulnerable to Security, Users Don’t Protect Their Devices, Connected Devices Store Personal Information.
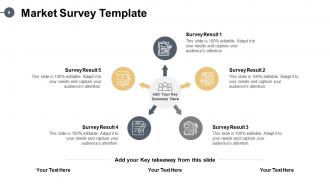
Slide 6: This slide showcases Market Survey Template with related icons.
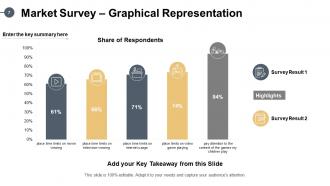
Slide 7: This slide shows Market Survey – Graphical Representation with data in percentage.
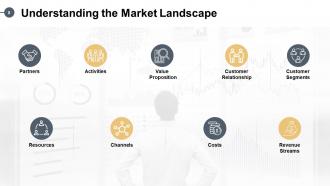
Slide 8: This slide presents Understanding the Market Landscape describing- Partners, Costs, Value Proposition, Customer Segments, Activities, Customer Relationship, Resources, Channels, Revenue Streams.
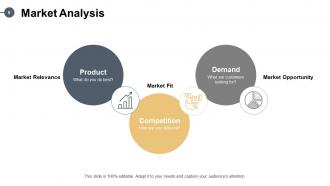
Slide 9: This slide displays Market Analysis describing- Market Relevance, Market Fit, Market Opportunity.
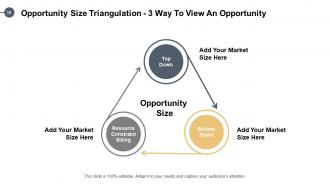
Slide 10: This slide represents Opportunity Size Triangulation - 3 Way To View An Opportunity.
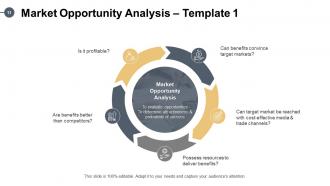
Slide 11: This slide showcases Market Opportunity Analysis – Template 1.
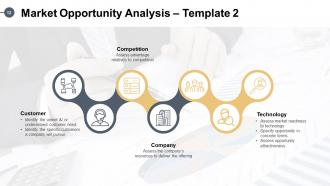
Slide 12: This slide shows Market Opportunity Analysis – Template 2 describing- Customer, Competition, Company, Technology.
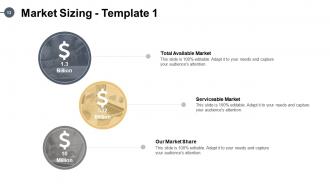
Slide 13: This slide presents Market Sizing - Template 1 describing- Total Available Market, Serviceable Market, Our Market Share.
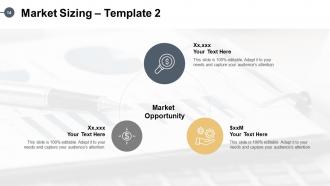
Slide 14: This slide displays Market Sizing – Template 2 with text boxes.
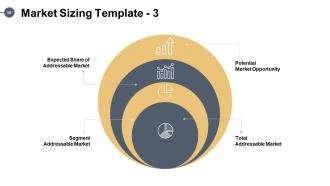
Slide 15: This slide represents Market Sizing Template - 3 describing- Potential Market Opportunity, Total Addressable Market, Segment Addressable Market, Expected Share of Addressable Market.
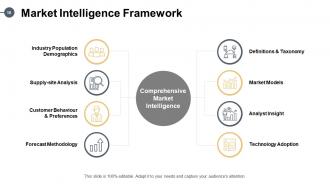
Slide 16: This slide showcases Market Intelligence Framework describing- Customer Behavior & Preferences, Supply-site Analysis, Definitions & Taxonomy, Market Models, Analyst Insight, Technology Adoption, Forecast Methodology, Industry Population Demographics.
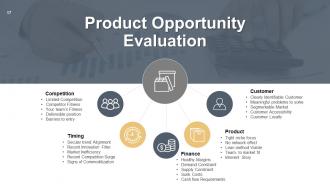
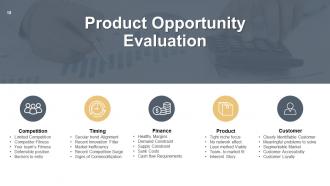
Slide 17: This slide shows Product Opportunity Evaluation describing- Customer, Product, Finance, Timing, Competition.
Slide 18: This is an optional slide for Product Opportunity Evaluation.
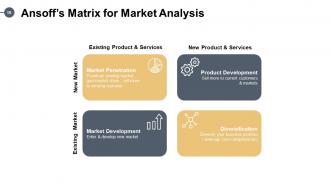
Slide 19: This slide presents Ansoff’s Matrix for Market Analysis describing- Market Penetration, Product Development, Market Development, Diversification.
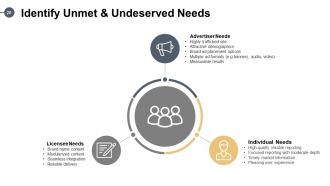
Slide 20: This slide displays Identify Unmet & Undeserved needs describing- Advertiser Needs, Individual Needs, Licensee Needs.
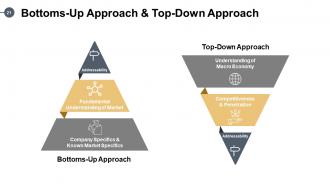
Slide 21: This slide represents Bottoms-Up Approach & Top-Down Approach with related diagram.
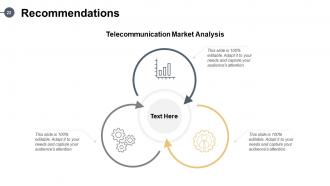
Slide 22: This slide showcases Recommendations for Telecommunication Market Analysis.
Slide 23: This slide displays Sales Forecasting Icons.
Slide 24: This slide is titled as Additional Slides for moving forward.
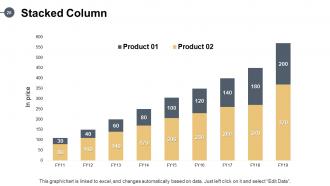
Slide 25: This slide displays Stacked Column chart with two products comparison.
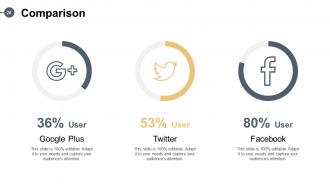
Slide 26: This is a Comparison slide to state comparison between commodities, entities etc.
Slide 27: This is Our Mission slide with related imagery and text.
Slide 28: This is a Puzzle slide with text boxes to show information.
Slide 29: This slide is titled as Post It Notes. Post your important notes here.
Slide 30: This is a Venn slide with text boxes.
Slide 31: This slide shows Circular diagram. Use it as per requirements.
Slide 32: This is a Lego slide with additional text boxes.
Slide 33: This is a Thank You slide with address, contact numbers and email address.
Sales forecasting powerpoint presentation slides with all 33 slides:
Use our Sales Forecasting Powerpoint Presentation Slides to effectively help you save your valuable time. They are readymade to fit into any presentation structure.


FAQs for Sales forecasting
Honestly, start with your historical data - that's your baseline. Then look at current trends and how your pipeline's actually performing. Your team knows which deals are real vs wishful thinking, so listen to them. Most people mess up by ignoring stuff like seasonality or when the economy's being weird. Track things that predict the future, not just what already happened. Oh, and customer patterns are way more telling than you'd think - I learned that the hard way. Quick win? Audit what data you're using now and find the obvious gaps. That'll probably give you the biggest boost right away.
Your forecasting models need historical sales data to work - it's literally how they learn what normal looks like for your business. Feed in past patterns, seasonality, growth trends, all that stuff, and the algorithm figures out what's probably coming next. Like showing someone thousands of driving examples before they hit the road, you know? More quality data = better predictions. Oh, and clean your data first because messy data gives you messy results. I'd say grab at least 2-3 years of solid historical data if you can swing it.
So basically, market research fills in all the gaps your sales data can't tell you. Like, your numbers won't warn you about new competitors or shifting customer attitudes. I got burned by this once - we kept missing our forecasts because nobody noticed this huge industry shift happening. Pretty embarrassing tbh. Research helps you catch trends early and adjust for stuff like seasonal patterns or economic changes. Historical data is useful but it's not everything, you know? I'd start simple - pick 2 or 3 market indicators that actually match your sales patterns and just track them monthly.
Dude, get yourself on Salesforce or HubSpot - they'll track your pipeline automatically and catch patterns you'd totally miss. Tools like Gong and Clari are insane at analyzing call data to predict deals. I'm talking scary-accurate stuff here. The machine learning gets better over time too, which is pretty cool. My buddy's team started seeing real results after running it for just one quarter. Import your existing sales data first, then let it do its thing. Way better than trying to crunch all those numbers yourself - trust me on this one.
Honestly, when markets are moving fast, historical data becomes pretty useless. You're better off focusing on real-time stuff and leading indicators instead. I'd suggest doing scenario planning - basically map out a few different "what if" situations. Track competitor moves, economic signals, customer feedback, that kind of thing. Machine learning can help spot patterns quicker, but garbage data in means garbage predictions out, you know? Also, ditch those quarterly forecasts. Update weekly or even daily if you can swing it. The whole point is staying flexible so when things inevitably change, you're not stuck with outdated assumptions.
Dude, seasonal trends will totally mess up your forecasts if you don't plan for them. Look at your sales data - I bet there's obvious patterns like Q4 spikes or summer bumps. I've watched so many teams crash and burn because they ignored this obvious stuff. You'll want at least 2-3 years of data to spot the real patterns. Then build separate models for busy vs slow seasons instead of averaging everything out - that never works well. Oh and don't even get me started on companies that realize this in December when they're already screwed.
Biggest thing I see is people being way too optimistic about timing - like deals will magically close faster than usual. Also don't ignore seasonality or if the market's shifting. Too many forecasts get wrecked by gut feelings over actual data, which honestly drives me crazy. Look at your team's real close rates first, then factor in pipeline velocity. Oh and always pad for deals that'll slip (trust me, they will). Start with hard numbers, add your insights on top, then test everything against last quarter's reality. Works way better than hoping for the best.
Honestly, your sales team sees stuff the numbers just can't capture. Like when Johnson Corp starts dodging calls or a competitor drops their prices overnight. These guys are on the phone all day - they'll know if that "50% likely" deal is actually a slam dunk. Just build in ways for them to quickly update you on the big stuff. Maybe adjust those probability scores when they flag something, or mark accounts that suddenly seem shaky. The trick is making it easy for reps to tell you when something major shifts before it tanks your forecast.
Honestly, economic indicators are like a crystal ball for sales forecasts. GDP shifts, unemployment changes, consumer confidence - all that stuff directly hits how much people buy. I got burned hard on my 2020 predictions because I wasn't paying attention! Don't just watch lagging indicators like unemployment though. Consumer sentiment and housing starts give you way better early warnings. Oh and actually build these into your forecasting model as real variables. Most people treat them like background noise, which is a mistake. Trust me on this one.
Honestly, monthly is the bare minimum but I'd go with every 2-4 weeks. Weekly makes sense if you're in something fast-paced or have quick sales cycles. Quarterly? Pretty much pointless unless you're selling houses or something super slow. The trick is finding what works without driving your team crazy with constant updates. I'd start monthly and see how it feels - you'll know pretty quick if market changes are happening faster than you're tracking them. Oh, and don't overthink it at first.
Track your engagement rates and hashtag performance - that stuff actually predicts demand spikes better than you'd think. Watch for mentions and trending topics in your space since they usually signal buying shifts before they happen. Honestly, tools like Hootsuite beat manually scrolling through feeds (though we've all called that "market research" before). Start with just 2-3 metrics that match your sales patterns. Don't overcomplicate it at first. Once you see what actually correlates with your historical data, then you can build fancier models. Simple wins here.
Time series works great if you've got decent historical data - it catches trends and seasonal stuff really well. But causal modeling? That's where you throw in the external factors that actually matter, like your marketing budget or what competitors are doing. I'll be honest, time series can feel backwards-looking sometimes. Though it nails short-term predictions. Causal models take more work to set up but they tell you *why* things are changing, not just what's coming next. My take? Use time series for your baseline, then add causal factors for the big stuff that moves the needle.
Look, most forecasting fights happen because sales and marketing work in separate bubbles then blame each other when things go sideways. Get everyone in the same room monthly to review pipeline data and actually talk through lead quality together. Both teams need shared dashboards - can't have people arguing over different numbers, that's just chaos. Marketing needs to get your sales cycle timing, and you gotta understand why their campaigns take forever to show impact. Oh, and don't let sales own the whole forecast process while marketing just throws stuff over the fence. Make it collaborative from day one.
Dude, customer behavior is literally everything for sales forecasting. Look at when they buy, how often, what they respond to during promotions - that's your roadmap right there. Historical data shows you the busy seasons and dead periods. Also track things like repeat purchases and average order size. Oh, and if customers always grab product A then product B? That's money in the bank for planning ahead. Break your customers into groups based on how they shop, then forecast each segment separately. Way more accurate than lumping everyone together. Trust me on this one.
Track MAPE first - that's your percentage error rate. Under 10% is solid. MAD shows the dollar difference between what you predicted vs actual sales. Then there's forecast bias, which catches if you're always guessing too high or low (huge for inventory stuff). Oh, and break it down by product line too - some reps might nail their numbers while others are completely off. I'd check these monthly since patterns show up pretty quick. Honestly, most people skip the bias part but it's probably the most useful one.
-
Easily Understandable slides.
-
Very well designed and informative templates.
-
Excellent template with unique design.