


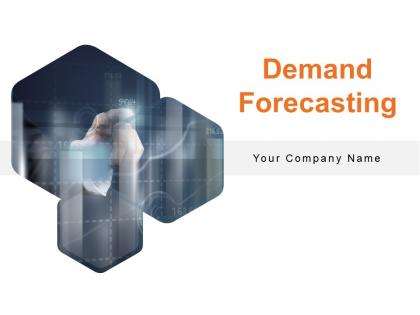
Demand forecasting powerpoint presentation slides


Try Before you Buy Download Free Sample Product
 Impress Your
 Audience
Editable
of Time


Determine the ways to monitor the future capacity requirements with the aid of our content ready Demand Forecasting PowerPoint Presentation Slides. By using the financial analysis PPT theme, you can explain how to predict consumer requirements and optimize business management. You can outline the important steps for accurate forecasting with the help of a market forecasting presentation template. Use the demand planning PowerPoint graphic and mention the methods to estimate the current demand of the product. Take the assistance of demand forecasting modeling PPT visual and determine how to predict the future product sales of your organization. Employ this professionally designed supply chain forecast PowerPoint layout and portray the steps to create effective and efficient planning. With the aid of demand chain presentation slides and clearly elaborate the direction of future trends. Therefore, download our ready-to-use market forecasting PowerPoint deck and express how to allocate budgets or plans.
People who downloaded this PowerPoint presentation also viewed the following :
Content of this Powerpoint Presentation
Slide 1: This slide introduces Demand Forecasting. State Your Company Name and begin.
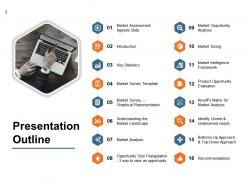
Slide 2: This slide shows Presentation Outline.
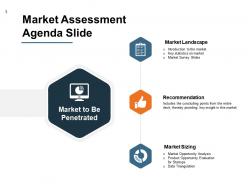
Slide 3: This is Market Assessment Agenda Slide describing- Market Landscape, Recommendation, Market Sizing.
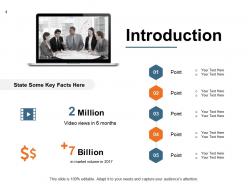
Slide 4: This is an Introduction slide with related imagery.
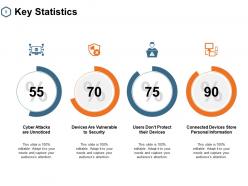
Slide 5: This slide presents Key Statistics as- Devices Are Vulnerable to Security, Users Don’t Protect their Devices, Connected Devices Store Personal Information, Cyber Attacks are Unnoticed.
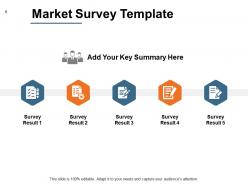
Slide 6: This is a Market Survey Template with related icons and text boxes.
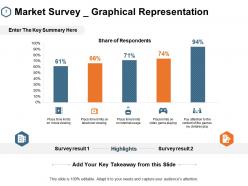
Slide 7: This slide displays Market Survey with Graphical Representation.
Slide 8: This slide represents Understanding the Market Landscape describing- Customer Segments, Partners, Resources, Channels, Activities, Customer Relationship, Value Proposition, Costs, Revenue Streams.
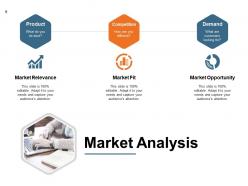
Slide 9: This slide showcases Market Analysis describing- Market Opportunity, Market Relevance, Market Fit.
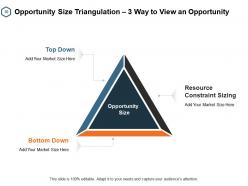
Slide 10: This slide shows Opportunity Size Triangulation – 3 Way to View an Opportunity.
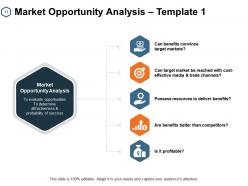
Slide 11: This slide presents Market Opportunity Analysis – Template 1.
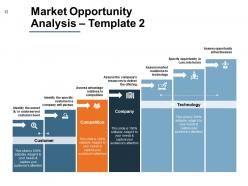
Slide 12: This slide displays Market Opportunity Analysis – Template 2.
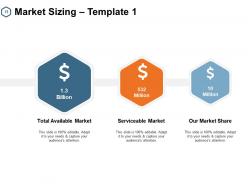
Slide 13: This slide represents Market Sizing – Template 1 describing- Total Available Market, Serviceable Market, Our Market Share.
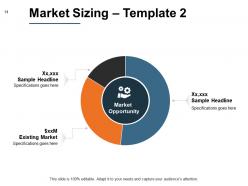
Slide 14: This slide showcases Market Sizing – Template 2.
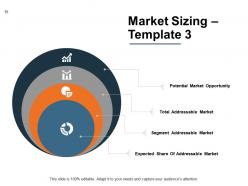
Slide 15: This slide shows Market Sizing – Template 3 describing- Expected Share Of Addressable Market, Segment Addressable Market, Total Addressable Market, Potential Market Opportunity.
Slide 16: This slide presents Market Intelligence Framework describing- Definitions & Taxonomy, Market Models, Analyst Insight, Technology Adoption, Forecast Methodology, Customer Behaviour & Preferences, Supply-site Analysis, Industry Population Demographics.
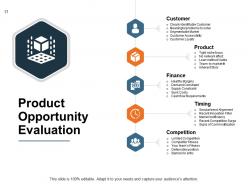
Slide 17: This slide displays Product Opportunity Evaluation describing- Customer, Product, Finance, Timing, Competition.
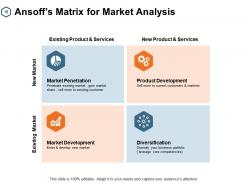
Slide 18: This slide represents Ansoff’s Matrix for Market Analysis.
Slide 19: This slide showcases Identify Unmet & Undeserved Needs describing- Advertiser Needs, Licensee Needs, Individual Needs.
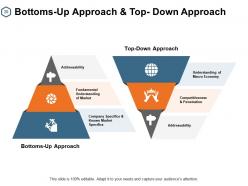
Slide 20: This slide shows Bottoms-Up Approach & Top- Down Approach with related diagram.
Slide 21: This is a Recommendations slide with related icons.
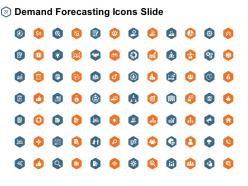
Slide 22: This slide displays Demand Forecasting Icons.
Slide 23: This slide reminds about a 30 minutes Coffee Break.
Slide 24: This slide is titled as Additional Slides for moving forward.
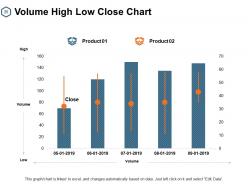
Slide 25: This slide shows Volume High Low Close Chart.
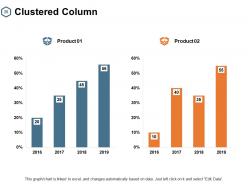
Slide 26: This slide presents Clustered Column chart with two products comparison.
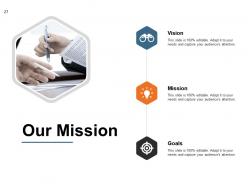
Slide 27: This is Our Mission slide with related imagery and text.
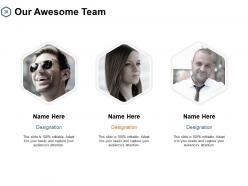
Slide 28: This is Our Awesome Team slide with names and designation.
Slide 29: This is a Comparison slide to state comparison between commodities, entities etc.
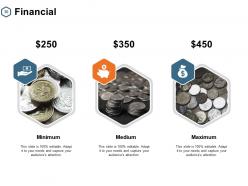
Slide 30: This is a Financial slide. Show your finance related stuff here.
Slide 31: This is a Quotes slide to convey message, beliefs etc.
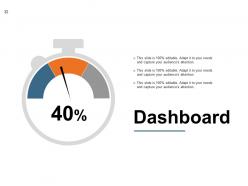
Slide 32: This is a Dashboard slide with text boxes.
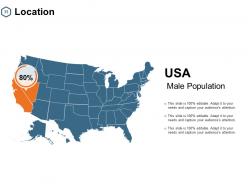
Slide 33: This is a Location slide with maps to show data related with different locations.
Slide 34: This is a Thank you slide with address, contact numbers and email address.
Demand forecasting powerpoint presentation slides with all 34 slides:
Use our Demand Forecasting Powerpoint Presentation Slides to effectively help you save your valuable time. They are readymade to fit into any presentation structure.


FAQs for Demand forecasting
So there's a few main approaches you'll see. Time series analysis (ARIMA models and stuff) is probably what you'll use most - it just looks at historical patterns to predict what's coming. Regression's great when you need to factor in things like pricing or seasonal changes. Machine learning is everywhere now, especially neural networks, though honestly they're kind of overkill sometimes. Expert judgment and market research work too when your historical data is sketchy. I'd start simple with basic time series models first. They're way easier to explain to your boss and usually work just as well as the fancy stuff.
Honestly, seasonality will mess up your forecasts big time if you don't factor it in. You'll be way off during busy seasons and slow periods. Holiday rushes, summer product spikes - that stuff follows patterns you can actually predict. Plot your data across a few years first to see what's happening. Then use methods like Holt-Winters or seasonal ARIMA that can handle those cycles. I learned this the hard way when I ignored Christmas trends once - total disaster. But yeah, you need decent historical data to make it work.
Your sales history is honestly your best bet for forecasting demand. Look for patterns - holiday rushes, dead seasons, steady growth over time. I'd dig into at least 12-24 months of data if you've got it. Past trends won't perfectly predict the future (obviously), but they're a solid starting point. Just make sure you're accounting for any big changes in your business or market that might throw off those patterns. Short bursts of data can be misleading. You'll start seeing real trends once you have enough history to work with.
Honestly, ML is a game changer for demand forecasting. You'll catch patterns in your historical data that would take forever to spot manually - seasonality, promos, weather, all that stuff gets processed at once. The algorithms actually learn as they go, which is wild. Start simple though, don't jump straight into complex neural networks. Random forests work great for most cases. Feed it clean data and test on your most predictable products first. Way more accurate than just looking at basic trends. I probably sound like a total data nerd but it really does work.
Oh man, the worst thing you can do is just rely on old data without thinking about what's changed in the market. I've seen so many teams overcomplicate things too - like they'll build these insanely complex models that somehow perform worse than basic ones lol. Don't skip seasonality patterns, that's huge. Marketing and sales actually know stuff you don't, so talk to them instead of working in a bubble. You gotta update forecasts regularly rather than just setting and forgetting. Honestly, I'd start by looking at what you're doing now and see where you're making these mistakes.
Oh man, external stuff will totally mess with your demand forecasts if you ignore it. Inflation, unemployment, consumer confidence - all that directly changes how people buy things. When folks feel broke or uncertain, they either buy less or go cheaper. Holiday spending and back-to-school rushes are huge too. Here's the annoying part though - these changes don't always show up right away. There's usually some lag time. You really need to track leading economic indicators and keep tweaking your assumptions based on what's happening now, not just what your historical sales look like. Way more reliable that way.
Honestly, it depends on what you're working with. Excel's built-in stuff is way better than people think for basic forecasting. Python libraries like Prophet are solid if you want to get nerdy with it - scikit-learn too. SAP IBP and Oracle Demantra handle huge datasets but they'll cost you a fortune. Power BI or Tableau work great for making your forecasts look pretty afterward. I've actually seen companies do fine with any of these options, which is kind of surprising. Just start with whatever you can get your hands on right now and level up later when things get more complicated.
Honestly, getting other departments involved in forecasting is a game-changer. Sales teams know what customers are actually requesting. Marketing can tell you when their campaigns will drive demand spikes. Operations understands supply bottlenecks that might screw up delivery. Finance keeps everyone grounded with budget realities (though they're fun at parties, right?). You're not just relying on old sales data anymore when everyone shares what they know. Monthly meetings work great - just get all these teams together with shared dashboards so nobody's working off different numbers. Trust me, your forecasts will be way more solid.
Look, you'll want to focus on MAE, MAPE, and RMSE mostly. MAE shows your average error in real units - pretty straightforward. MAPE's honestly my favorite because it gives you percentages, making it way easier to compare different products or explain to your boss. RMSE can be kind of brutal since it hammers you harder for big misses, but that's actually helpful for spotting disasters. Oh, and definitely track forecast bias too - catches whether you're always predicting too high or low. Start with MAPE though, it's the most stakeholder-friendly by far.
So basically, consumer behavior data shows you the "why" behind what people buy, making your forecasts way more accurate. You're not just looking at old sales numbers anymore. Now you can track browsing habits, social media buzz, seasonal stuff, even economic factors that mess with buying decisions. It's honestly pretty cool - you'll catch trends before they show up in actual sales data. Like people googling winter coats in August, you know? Start with connecting your web analytics to your forecasting model first. That's usually the easiest win and doesn't require tons of setup.
So there's two main ways to forecast stuff. Quantitative uses hard data and math models - basically crunching historical numbers. Qualitative is more about gut feelings, expert opinions, focus groups, that kind of thing. Here's the deal though - most teams I've seen pick one and stick with it religiously, which is kinda dumb. Use quantitative when you've got solid historical trends and things are stable. But if you're launching something new or the market's going crazy? That's when qualitative saves your butt because past data won't tell you much. My advice: start with the numbers, then let your team's insights adjust it.
Honestly, ditch those monthly forecasts - you need way faster updates, like weekly or daily. Live data feeds are where it's at now for tracking market shifts and competitor stuff. Quarterly models? Total death trap when everything's moving this fast. Machine learning can help since it adapts quickly, but here's the weird thing - sometimes basic moving averages actually work better than fancy algorithms during crazy volatile times. Main thing is building flexibility into whatever system you're using. That way you won't get stuck when the market does something completely unexpected.
Ugh, supply chain mess-ups totally screw with demand forecasts. People start hoarding when they can finally get stuff, then you've got these weird buying spikes that aren't real demand. Or they'll just buy whatever substitute they can find instead. Your historical data becomes basically useless - like, how do you predict normal patterns when nothing's been normal? I'd flag those crazy periods in your models and focus more on the data from right before everything went sideways. The disruption data is just noise honestly.
Since you don't have any sales history yet, check out similar products you've launched before - same price range or target audience works. Use their early adoption patterns as your starting point. Market research helps, but honestly people always claim they'll buy way more than they actually do (learned that the hard way). Bottom-up estimates work too - take the category growth rate and multiply by your expected market share. Oh, and definitely start conservative with your numbers. You can always adjust up once real data starts coming in, but it's way harder to walk back overly optimistic projections.
Honestly, you've gotta speed up those forecast cycles - ditch the monthly thing for weekly or daily updates. Pull in real-time sales data, social media buzz, whatever you can get your hands on. Machine learning is clutch here for catching patterns fast. Your sales team probably sees demand shifts before any algorithm does, so loop them in. Oh, and set up those feedback loops so your models auto-adjust when predictions go sideways. I'd start testing shorter cycles on your fastest movers first - less risky that way. Makes way more sense than overhauling everything at once.
-
Top Quality presentations that are easily editable.
-
Unique research projects to present in meeting.
-
Topic best represented with attractive design.
-
Very well designed and informative templates.