

Revenue Forecasting Powerpoint Presentation Slides




Try Before you Buy Download Free Sample Product
 Impress Your
 Audience
 100%
100% Editable
 Save Hours
 of Time


Estimate future financial outcomes of your company with the help of this content ready Revenue Forecasting Powerpoint Presentation Slides. The income forecast Power complete deck contains professional looking PPT slides such as retail store revenue projections, revenue forecast model, monthly revenue projection, income statement projection, revenue projection per share, earning sales forecast product-wise, revenue projections by active users, etc. The income forecast presentation deck also includes charts and graphs. You can use these charts & graphs to present your financial data in an organized way. All templates are fully editable, you can add or change the text if you wish to. Furthermore, the annual budgeting process and planning cycles can also be shown with the help of visually appealing earning projection PPT visuals. Not just this monetary forecast PPT slideshow also goes well with topics like financial projection, income forecast, earning projection, revenue management and so on. Download yield management PowerPoint template to showcase financial reports in a visual manner. Discuss the impasse with our Revenue Forecasting Powerpoint Presentation Slides. Figure out how to get around it.
People who downloaded this PowerPoint presentation also viewed the following :
Content of this Powerpoint Presentation
Slide 1: This slide introduces Revenue Forecasting. State Your Company Name and begin.
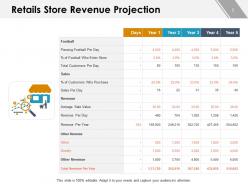
Slide 2: This slide shows Retails Store Revenue Projection describing- customers per day, sales, revenue, etc.
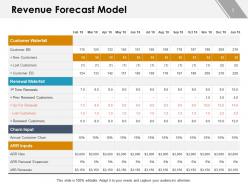
Slide 3: This slide presents Revenue Forecast Model describing- Customer waterfall, renewal waterfall, churn input, annual customer churn etc.
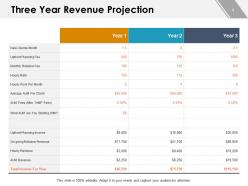
Slide 4: This slide displays Three Year Revenue Projection describing- New clients, upfront planning fee, monthly retainer fee, upfront planning income etc.
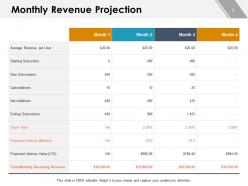
Slide 5: This slide represents Monthly Revenue Projection describing- average revenue per user, starting subscriber, new subscribers, Net additions,churn rate etc.
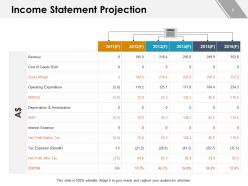
Slide 6: This slide showcases Income Statement Projection describing- Revenue, cost of goods sold, gross margin, operating expenditure etc.
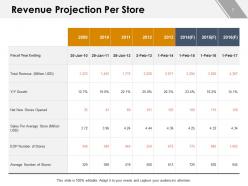
Slide 7: This slide shows Revenue Projection Per Store describing- Total revenue, net new stores opened, sales per average store etc.
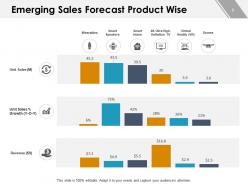
Slide 8: This slide presents Emerging Sales Forecast Product Wise describing- Unit Sales % Growth, Revenue, Unit Sales.
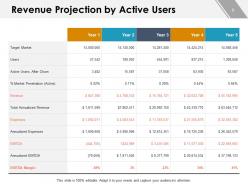
Slide 9: This slide displays Revenue Projection by Active users describing- Target market, users, Revenue, expenses etc.
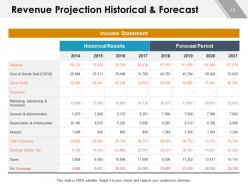
Slide 10: This slide represents Revenue Projection Historical & Forecast with Income statement, Historical results and forecast period.
Slide 11: This slide is titled as Additional Slides for moving forward.
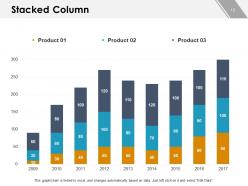
Slide 12: This slide shows Stacked column chart with three products comparison.
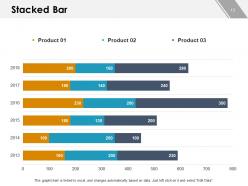
Slide 13: This slide presents Stacked Bar with three products comparison.
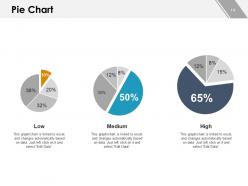
Slide 14: This slide shows Pie chart with data in percentage.
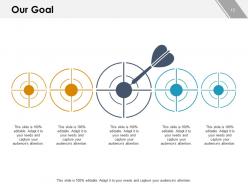
Slide 15: This is Our Goal slide. State your important goals here.
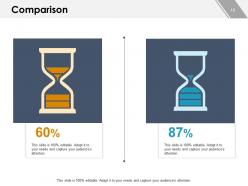
Slide 16: This is a Comparison slide to state comparison between commodities, entities etc.
Slide 17: This is a Financial slide. Show your finance related stuff here.
Slide 18: This is a Quotes slide to highlight or state anything specific.
Slide 19: This is a Thank you slide with address, contact numbers and email address.
Revenue Forecasting Powerpoint Presentation Slides with all 19 slides:
Use our Revenue Forecasting Powerpoint Presentation Slides to effectively help you save your valuable time. They are readymade to fit into any presentation structure.



FAQs for Revenue Forecasting
You'll need about 12-18 months of historical data first. Then map out your current pipeline with honest close probabilities - and I mean actually honest, not the inflated numbers your reps put in CRM. Factor in seasonality, economic stuff, team capacity too. Seriously, I've watched so many companies build these gorgeous forecasts then realize they don't have enough people to actually sell anything. Oh, and don't forget upcoming product launches or big renewals. The whole thing falls apart if you just tell leadership what they want to hear instead of reality. Start with nailing down your data sources, then build everything else around that foundation.
Honestly, your historical sales data is pure gold for forecasting. Plot out 2-3 years of monthly revenue and you'll start seeing the patterns pop up. Seasonal dips, growth spurts, weird months when that supply chain thing happened - it all tells a story. Break it down by product lines or regions too if you can. I always get nerdy about this stuff, but segmenting really shows you where the money's actually coming from. Look for those cyclical patterns first - that's your baseline. Once you've got that foundation, building realistic projections becomes way less of a guessing game.
Honestly, you can't just ignore what's happening in the economy when you're trying to predict revenue. Look at GDP growth, unemployment, inflation - that stuff directly hits how much people can spend on your products. Like, if we're sliding into a recession, you can't just assume last year's growth will repeat itself, you know? The trick is figuring out which economic signals actually matter for YOUR business specifically. Some companies track consumer confidence religiously, others watch interest rates like hawks. Once you know what moves the needle for you, work those indicators into your forecast as early warning signs. Makes your projections way more realistic.
Dude, you absolutely have to factor in seasonal stuff or your projections will be completely off. Like, retail always goes crazy during holidays, and B2B sales basically die in summer when everyone's at the beach. Then there's the bigger cyclical stuff - those industry-wide trends that play out over months or years. Here's where it gets tricky though: you'll go nuts trying to figure out what's just a seasonal thing versus actual growth. I swear, looking at 2-3 years of data minimum is the only way to spot real patterns. Otherwise you're just guessing and adjusting forecasts based on... well, nothing really.
Honestly? Start with surveys and basic market research - figure out if people actually want this thing. Check out similar products and how their launches went. I'd definitely do a small test run first instead of betting everything on projections (learned that one the hard way). You can build forecasts bottom-up too - estimate your customer pool, conversion rates, pricing, all that. It's honestly part guesswork at first, which sucks but whatever. Use a few different methods and just keep updating as real sales come in.
Honestly, AI forecasting is a game changer - it can crunch way more data than you'd ever manage manually. We're talking customer patterns, seasonal stuff, market shifts, even weird economic indicators. The algorithms actually learn as they go, which is kinda wild when you think about it. They'll catch connections you'd totally miss and update predictions as fresh data rolls in. Just make sure you're feeding it decent historical data and double-checking the results regularly. Oh, and don't go crazy at first - pick one revenue stream to test with. You can always expand later once you see how it performs.
Monthly updates are the bare minimum, but weekly's way better if things move fast in your industry. Honestly, consistency matters more than frequency though - same data sources, same assumptions, same review process every time. Pull in fresh pipeline data and recent win/loss patterns, plus any market shifts that could mess with your numbers. Document what changed and why instead of just tweaking randomly. Your team needs to see the patterns. Oh and definitely set up recurring reviews with key people - those meetings actually help catch stuff you'd miss flying solo.
Honestly, get your sales team involved from the start - let them help set the targets instead of just throwing numbers at them. People actually care when they build the goals themselves. Show them how their deals connect to the bigger revenue picture through dashboards or whatever works. Weekly pipeline reviews are clutch (way better than getting blindsided monthly). Here's the thing though - tie their comp to forecast accuracy, not just closing. Makes them think twice about sandbagging deals. Oh, and keep talking to them constantly about progress. Treat it like everyone's working toward the same thing instead of finance just dumping spreadsheets on them.
Segmenting your customers makes forecasting so much better - you're not just averaging everything out anymore. Enterprise clients renew quarterly while small biz churns way faster, right? So predict each group separately. Honestly, this changed how I think about revenue planning completely. Trends become obvious earlier too. Like when your biggest spenders start pulling back, or some random cohort is crushing it. I'd focus on your top revenue segments first since that's where better accuracy actually moves the needle. Makes way more sense than the spray-and-pray approach most people use.
Okay so when the market goes sideways on you, figure out what actually changed first - demand? Pricing? How customers are acting? Don't waste time guessing. Grab whatever recent data you can get, even if it's only a few weeks old, and redo your numbers. This is exactly why I always tell people to build multiple scenarios beforehand - saves your butt when everything hits the fan. Update your best/worst/realistic cases with what's happening now. Toss the old assumptions that don't make sense anymore. Oh, and switch to weekly reviews until things calm down. Monthly's too slow when stuff's moving this fast.
Honestly, most people get way too optimistic with their numbers - like assuming everything will go perfectly when it never does. Don't just copy last year's data without thinking about what's changed. New competitors? Different economy? That stuff matters. Sales cycles always take longer than you think they will, and conversion rates are usually worse than your best-case dreams. I learned this the hard way at my last job lol. Build in some cushion time and make a few different scenarios - best case, realistic, and "oh crap" case. Trust me, you'll thank yourself later when things inevitably get weird.
So it really depends on what actually makes your industry tick, you know? SaaS companies obsess over churn and customer lifetime value. Retail's all about seasonal swings and how fast inventory moves. Manufacturing focuses on production capacity and supply chain stuff - makes sense. Healthcare is honestly a nightmare with patient volumes and reimbursement cycles, probably the trickiest forecasting I've ever seen. B2B services? They build everything around contract renewals and pipeline conversions. The trick is figuring out what specifically drives your revenue instead of using some cookie-cutter approach that doesn't fit.
Track your forecast accuracy percentage first - that's your main tell. Pipeline conversion rates and win rates matter too, but honestly, if you're off by more than 10% consistently, something's broken. Average deal size and sales cycle length will show if your assumptions are actually right. Leading indicators like qualified leads give you early heads up before things go sideways. Compare forecasted vs actual numbers monthly, not just when the quarter ends. Oh, and demo-to-close ratios are clutch for spotting problems early.
Dude, you gotta get those three teams actually talking. Sales knows what deals are really coming through the pipeline. Marketing can tell you if the leads are actually any good. Finance spots the bigger trends everyone else misses - honestly, they're usually the most realistic about numbers. Without this? You're just guessing. Sales gets way too optimistic while marketing has no clue their leads suck. Finance will also catch outside stuff affecting revenue that sales and marketing totally overlook. Set up monthly meetings where everyone dumps their data and explains their thinking. Game changer.
Look, scenario analysis is just stress-testing your revenue forecasts with different "what if" situations. You model best case, worst case, realistic outcomes instead of betting everything on one prediction. What happens if a competitor swoops in? Economic downturn hits? Growth explodes? Honestly, most people skip this step and regret it later. You're basically building contingency plans so you won't panic when things go sideways - which they always do. Forces you to think about external stuff that could mess up your projections. Try three simple scenarios next quarter and see how it goes.
-
Topic best represented with attractive design.
-
Nice and innovative design.
-
Out of the box and creative design.
-
Qualitative and comprehensive slides.