


Budget Projection Powerpoint Presentation Slides


Try Before you Buy Download Free Sample Product
 Impress Your
 Audience
Editable
of Time


Introducing our content ready Budget Projection PowerPoint Presentation Slides. Financial projections help you to achieve your business goals. Utilize this professionally designed budgeting and forecasting presentation deck to estimate your firms anticipated revenues and expenditures. The topic-specific financial forecasting PowerPoint complete deck includes a set of self-explanatory templates such as actual cost vs budget, month-wise forecasting, overhead cost analysis, quarterly budget analysis, variance analysis, actual vs target variance, budget vs plan vs forecast, forecast and projection to name a few. Proper financial planning can create a better understanding of funding needs. Develop a strategic plan to meet your financial goals using the professional-looking cost projection PPT visuals. Incorporate budget analysis PowerPoint graphics to manage your budgeting process. Furthermore, the financial forecasting PPT slides allows users to monitor finances and develop plans for the fiscal year. Thus, download the budget planning process PowerPoint template to develop financial processes & procedures. Handle any burden with our Budget Presentation Slides. Nothing is ever too arduous for them.
People who downloaded this PowerPoint presentation also viewed the following :
Content of this Powerpoint Presentation
Slide 1: This slide introduces Budget Projection. State Your Company Name and begin.
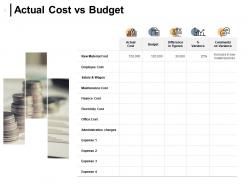
Slide 2: This slide shows Actual Cost vs Budget in tabular form.
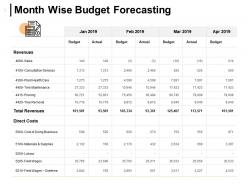
Slide 3: This slide presents Month Wise Budget Forecasting.
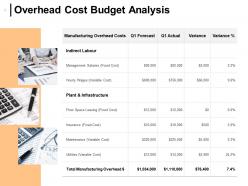
Slide 4: This slide displays Overhead Cost Budget Analysis.
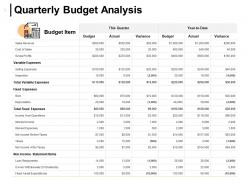
Slide 5: This slide represents Quarterly Budget Analysis in tabular form.
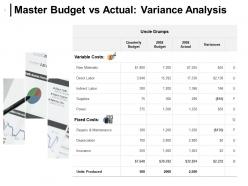
Slide 6: This slide showcases Master Budget vs Actual: Variance Analysis with variable and fixed costs.
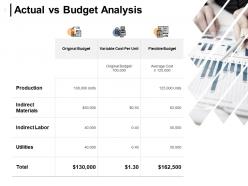
Slide 7: This slide shows Actual vs Budget Analysis with categories as original budget, variable cost per unit and flexible budget.
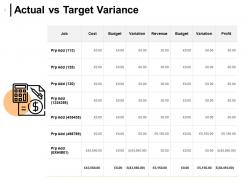
Slide 8: This slide presents Actual vs Target Variance.
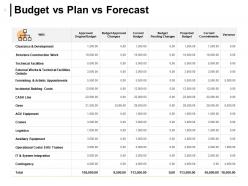
Slide 9: This slide displays Budget vs Plan vs Forecast. You can add data as per requirements.
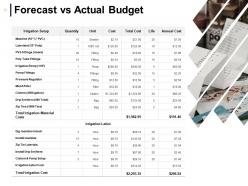
Slide 10: This slide represents Forecast vs Actual Budget.
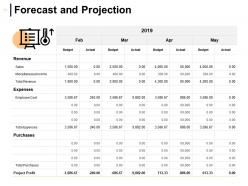
Slide 11: This slide showcases Forecast and Projection on monthly basis.
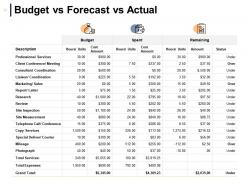
Slide 12: This slide shows Budget vs Forecast vs Actual.
Slide 13: This slide displays icons for Budget Projection.
Slide 14: This slide is titled as Additional Slides for moving forward.
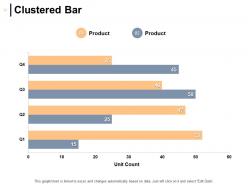
Slide 15: This slide shows Clustered Bar Chart with two products comparison.
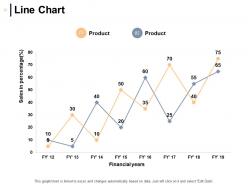
Slide 16: This slide displays Line Chart Chart with two products comparison.
Slide 17: This is Our Team slide with names and designation.
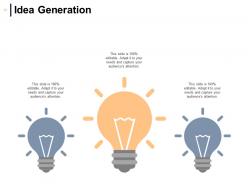
Slide 18: This is an Idea Generation slide to state a new idea or highlight information, specifications etc.
Slide 19: This is a Puzzle slide with text boxes.
Slide 20: This is a Thank You slide with address, contact numbers and email address.
Budget Projection Powerpoint Presentation Slides with all 20 slides:
Use our Budget Projection Powerpoint Presentation Slides to effectively help you save your valuable time. They are readymade to fit into any presentation structure.


FAQs for Budget Projection
You'll need at least 2-3 years of historical data if you've got it. Revenue forecasts are crucial - just don't be overly optimistic because that's where most people screw up. Break down expenses by category and factor in seasonal stuff (learned that one the hard way). Build contingency funds for random expenses that always pop up. Oh, and review your assumptions every quarter or so. Market trends matter too, obviously. Honestly, start simple with a basic template - you can always make it fancier later once you get the hang of it.
Honestly, looking at your old spending patterns beats just winging it for next year's budget. Pull up 2-3 years of data if you can - one random expensive year will mess up everything. What you're hunting for are the trends that keep showing up: seasonal stuff, categories where you always go over, that kind of thing. Your past budget vs actual reports are pure gold for this. I know it sounds super exciting (kidding), but those boring spreadsheets will show you exactly where your money actually goes. Way better than crossing your fingers and hoping.
Variance analysis is your budgeting reality check - compare what you planned against what actually went down. Look for patterns in your spending and revenue misses. Were you too optimistic about income? Do certain expenses always blow past estimates? Maybe you forgot about seasonal stuff (happens to everyone). Here's the thing though - don't just notice the differences exist. Dig into WHY they happened. That's where the gold is. Once you figure out your blind spots, your next budget won't suck as much. Boring? Yeah. But it beats repeating expensive mistakes over and over.
Quarterly at minimum, but monthly's way better if you've got the bandwidth. Market shifts or big unexpected costs? Update immediately - don't wait for your regular schedule. I've watched so many teams get totally screwed because they rode the same projections for like half a year. Obviously you don't want to spend every week obsessing over spreadsheets either. Find your balance. Set up calendar alerts for the routine stuff, then make a quick list of things that should trigger immediate updates. Trust me, staying on top of this beats scrambling later.
Honestly, just start with Excel or Google Sheets - they're still what most finance teams actually use. Super flexible once you get the hang of it. Bigger companies usually go for stuff like Adaptive Insights or Planful when they need fancy forecasting features. QuickBooks is solid too if you want the accounting stuff built right in (saves time, trust me). Really depends on how complex your budget is though. Don't blow money on expensive software if a decent spreadsheet does what you need.
Man, external stuff can totally wreck your budget if you're not paying attention. Inflation, interest rates, currency swings - they all mess with your revenue and cost estimates. Supply chain issues are still crazy right now, affecting both timing and what you'll pay for things. Customer demand shifts based on economic vibes too. Like, are we heading into a recession or not? Your sales numbers need to reflect that reality. Honestly, I'd build different scenarios with various economic assumptions. That way you won't get blindsided when things inevitably change.
Your sales folks know when that big renewal's actually at risk. Department heads see staffing shakeups coming. Procurement catches cost bumps you'd totally miss otherwise. I've watched forecasts crash because finance had no clue HR was dealing with some new compliance mess - awkward. Don't just throw out "any thoughts?" though. You need actual structure. Set specific deadlines, ask targeted questions. These people are in the weeds daily while you're looking at spreadsheets. Their input isn't just helpful, it's what keeps your projections from being fantasy numbers.
Honestly, the worst mistake is being way too optimistic about revenue while totally lowballing your expenses. Old data is basically useless - like, 2023 numbers probably won't help you much now. Seasonal stuff always catches people off guard too. Oh, and those random one-time costs that somehow aren't so "one-time"? Yeah, budget for those. Don't build some crazy complicated spreadsheet that'll make you want to cry every time you update it. Simple works better. Always pad your numbers because something weird will definitely happen that you never saw coming.
Don't just copy last year's numbers - that's lazy budgeting. Instead, figure out what your big strategic moves are first, then put money behind those specific things. Your finance people need to be in those strategy meetings from the start (seriously, why do companies always forget this?). They can tell you if your grand plans are actually realistic or just wishful thinking. Set up quarterly reviews where you're checking if you're hitting both your spending targets AND your strategic goals. When things inevitably change, you'll be ready to pivot instead of being stuck with some outdated budget that doesn't match reality anymore.
Track your variance percentages - that's the key metric you want. I'd check revenue and expense variances monthly, plus do rolling forecasts to catch patterns. Most people get way too worked up over small variances though and totally miss the bigger trends happening. Are you getting better at predicting over time? That's what really matters. Cash flow timing will bite you too - being right on amounts but wrong on when money moves still screws everything up. Set thresholds like +/- 5% so you know when it's actually worth digging into the weeds.
Honestly, scenario planning is a game changer for budgets. Build 3-4 different versions - best case, worst case, most likely. Yeah it's extra work upfront but whatever, it's so worth it. Each model accounts for different market conditions or revenue swings. When things inevitably go sideways (and they will), you're not scrambling because you've already thought through how to respond. Start by figuring out your biggest unknowns first. Then model how each situation would mess with your numbers. You'll catch risks way earlier this way.
Oh man, cash flow analysis is a lifesaver for budgets! Here's the thing - your budget might look amazing on paper, but if customers pay late while your bills are due tomorrow, you're screwed. I learned this the hard way lol. The timing of money moving around matters way more than people think. You could be "profitable" but still can't make payroll. Super frustrating. Run different cash flow scenarios when you're doing budget projections. Trust me, it'll help you spot those brutal cash crunches way ahead of time instead of scrambling last minute.
So basically you run "what if" scenarios with your budget - like what happens if sales tank by 10% or your costs jump 15%. Yeah, it's kinda tedious but super useful. You're testing how sensitive your numbers are to changes in key variables. Focus on maybe 3-5 things that could really mess with your projections. Way better than crossing your fingers and hoping one forecast works out. You'll see exactly where you're most vulnerable and can build in some cushion. My old boss used to make us do this monthly and I hated it at the time, but honestly it saved us from some nasty surprises.
Ugh, regulatory changes are the worst for budget planning. They hit you with random costs you never saw coming - compliance stuff, new reporting, training your team on whatever new rules they dreamed up. Timing's brutal too since they love changing implementation dates. Though honestly, sometimes you get lucky and save money when tax rules swing your way. I always throw in like 3-5% extra for regulatory surprises now. Learned that the hard way! Stay on top of industry news so you're not scrambling when something drops.
Dude, seriously - charts and graphs are game changers for budget presentations. People's brains just process visual stuff way faster than spreadsheet hell. I swear, I've watched board members completely zone out during number-heavy slides, then suddenly pay attention when you throw up a simple bar chart showing the same exact data. You can spot trends instantly, compare different budget categories without squinting at tiny cells, and actually see where you're over or under budget. Oh, and it helps you craft an actual narrative instead of just word-vomiting numbers at people. Start simple though - one clear visual per main point you're trying to make.
-
Very unique, user-friendly presentation interface.
-
Excellent Designs.
-
Innovative and attractive designs.
-
Professional and unique presentations.