


Budget Proposal Powerpoint Presentation Slides





Try Before you Buy Download Free Sample Product
 Impress Your
 Audience
 100%
100% Editable
 Save Hours
 of Time


Showcase anticipated project cost using Budget Proposal PowerPoint Presentation Slides. Present your executive summary and revenue split to give a fair idea to your boss. Execute your next plan with proper planning and strategy regarding finances with the help of budget proposal PowerPoint slideshow. This content-ready deck on budget proposal highlights all important aspects of the budget. You can present business highlights, financial summary, export analysis, market analysis, market share, income statement, cash flow statement, and more using this professionally designed ready-to-use budget plan presentation deck. Not just this, give a brief about your project’s goal and objectives to get a headstart to your presentation. Talk about cost estimation, cost assignment and factors, escalation factors at length by adding relevant and professional budget allocation PPT slides. Do not miss any of the important element of a budget proposal. Get your hands on the ready-made budget proposal complete PowerPoint deck to set an accurate budget limit for your next project. Guests are grateful for your attention due to our budget presentation Slides. They definitely feel duly honored.
People who downloaded this PowerPoint presentation also viewed the following :
Content of this Powerpoint Presentation
Slide 1: This slide introduces Budget Proposal. State Your Company Name and get started.
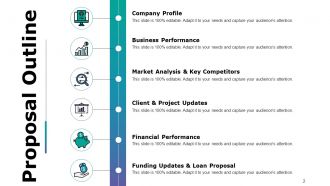
Slide 2: This slide showcases Proposal Outline displaying- Company Profile, Business Performance, Market Analysis & Key Competitors, Client & Project Updates, Financial Performance, Funding Updates & Loan Proposal.
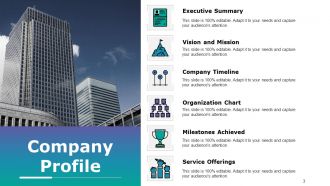
Slide 3: This slide shows Company Profile with- Executive Summary, Vision and Mission, Company Timeline, Organization Chart, Milestones Achieved, Service Offerings.
Slide 4: This slide presents Executive Summary displaying- Promoters and Shareholding, Financial Highlights, USD Million, Background, Capabilities, Accreditation, Company’s Vision, Company’s Mission, Revenue.
Slide 5: This slide presents Our Vision And Mission to be stated.
Slide 6: This slide showcases Company Timeline displaying- Accommodation, Registration, Establishment, Recruitment, Contract.
Slide 7: This is an Organization Chart slide to show team/company specifications.
Slide 8: This slide presents Our Service to be displayed.
Slide 9: This slide presents Our Service to be displayed.
Slide 10: This slide showcases Key Developments/Milestones Achieved.
Slide 11: This slide showcases Business Performance displaying- Revenue Split – By Geography, Revenue Split – By Products/Segment, Business Highlights, Financial Summary.
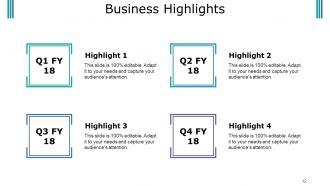
Slide 12: This slide presents Business Highlights to be displayed.
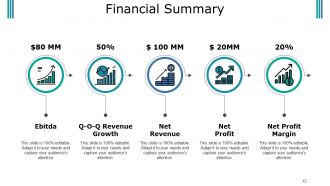
Slide 13: This slide showcases Financial Summary to be presented.
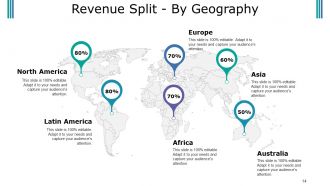
Slide 14: This slide showcases Revenue Split - By Geography.
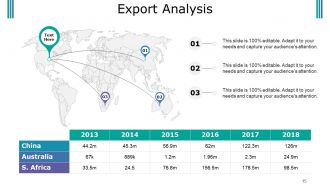
Slide 15: This slide presents Export Analysis to be shown.
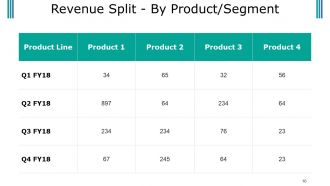
Slide 16: This slide shows Revenue Split - By Product/Segment.
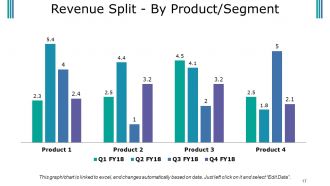
Slide 17: This slide shows Revenue Split - By Product/Segment.
Slide 18: This slide shows Market Analysis & Key Competitors displaying- Market Share, Competitive Landscape, Top Debtors & Creditors.
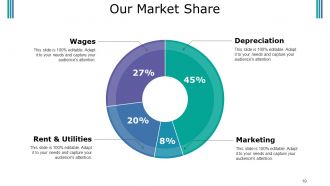
Slide 19: This slide presents Our Market Share in terms of- Depreciation, Marketing, Wages, Rent & Utilities.
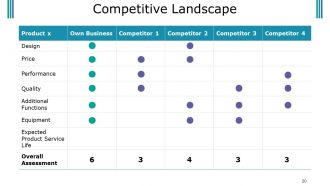
Slide 20: This slide showcases Competitive Landscape in tabular form.
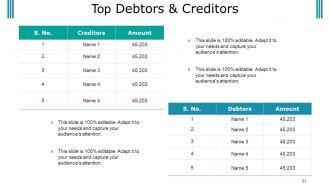
Slide 21: This slide shows Top Debtors & Creditors in table form.
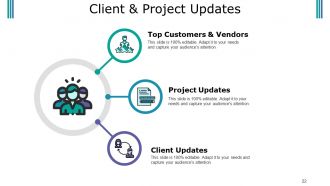
Slide 22: This slide shows Client & Project Updates.
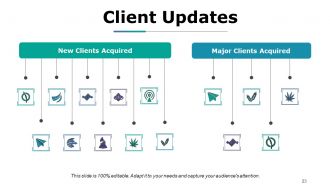
Slide 23: This slide presents Client Updates displaying- New Clients Acquired, Major Clients Acquired.
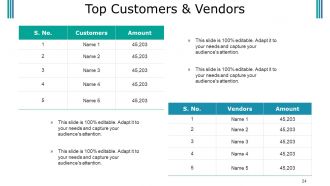
Slide 24: This slide presents Top Customers & Vendors to be presented.
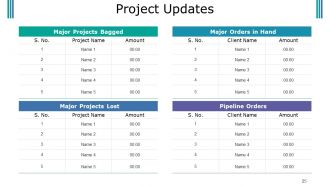
Slide 25: This is a Project Updates slide in tabular form.
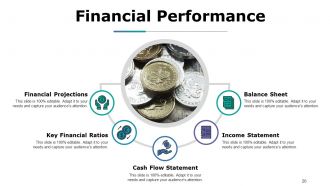
Slide 26: This slide shows Financial Performance displaying- Financial Projections, Cash Flow Statement, Key Financial Ratios, Balance Sheet, Income Statement.
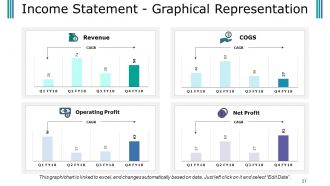
Slide 27: This slide shows Income Statement - Graphical Representation showcasing- CAGR of Net Profit, Revenue, Operating Profit, COGS.
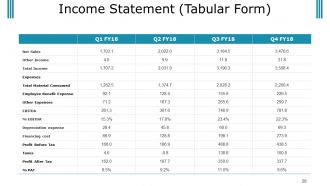
Slide 28: This is an Income Statement (Tabular Form) slide.
Slide 29: This slide shows Balance Sheet - Graphical Representation displaying- CAGR of- Current Liabilities, Total Liabilities, Total Assets, Current Assets.
Slide 30: This slide showcases Balance Sheet (Tabular Form) slide.
Slide 31: Cash Flow Statement - Graphical Representation CAGR of- Operations, Financing Activities, Net Increase in Cash, Investing Activities.
Slide 32: This slide shows Cash Flow Statement (Tabular Form) slide.
Slide 33: This slide presents Key Financial Ratios such as- P/E Ratio, Debt Equity Ratio, Current Ratio, Return On Assets, Return On Equity, Return On Investment.
Slide 34: This is Financial Projections – Income Statement slide in tabular form.
Slide 35: This is Financial Projections – Balance Sheet slide.
Slide 36: This slide showcases Funding Updates & Loan Proposal displaying- Funding Update - Debt, Funding Update - Equity, Loan Request & Usage of Funds, Debt Repayment Schedule, Collaterals.
Slide 37: This slide showcases Funding Updates - Debt in tabular form.
Slide 38: This slide showcases Funding Updates - Equity (Shareholding Pattern) in tabular form.
Slide 39: This slide showcases Loan Request in table form.
Slide 40: This slide showcases Debt Repayment in table form.
Slide 41: This slide showcases Collateral in table form.
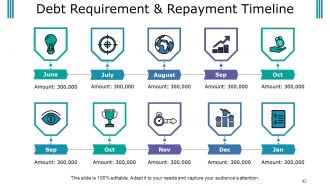
Slide 42: This slide presents Debt Requirement & Repayment Timeline with icon imagery.
Slide 43: This is a Budget Proposal Icon Slide. Use the icons as per need.
Slide 44: This is a Coffee Break slide to halt. You may change the slide content as per need.
Slide 45: This slide is titled Charts & Graphs. You may change the slide content as per need.
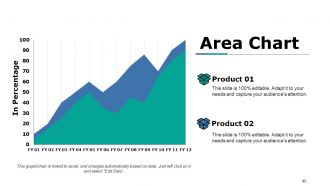
Slide 46: his is an Area Chart slide to show product/entity comparison, specifications etc.
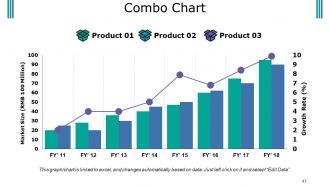
Slide 47: This is a Combo Chart slide. State specifications, comparison of products/entities here.
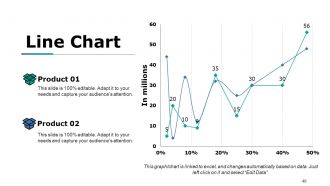
Slide 48: This is a Line Chart slide. State specifications, comparison of products/entities here.
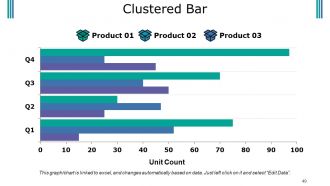
Slide 49: This is a Clustered Bar Chart slide. State specifications, comparison of products/entities here.
Slide 50: This slide is titled Additional Slides to move forward. You may change the slide content as per need.
Slide 51: This is Our Mission slide. State mission aspects here.
Slide 52: This is Our Team slide with image boxes to fill name, designation.
Slide 53: This is an About Us Company slide. State team/company specifications etc. here.
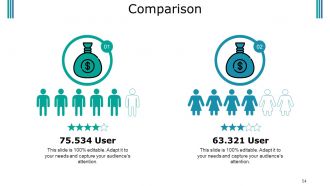
Slide 54: This is a Comparison slide to compare product/enitities etc.
Slide 55: This is Our Main Goal slide. State goals etc. here.
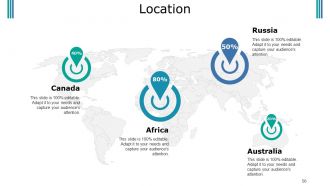
Slide 56: This is Location image slide of world map image to show global growth, presence etc.
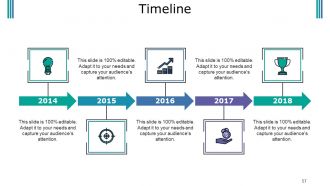
Slide 57: This is a Timeline image slide to show growth factors, milestones etc.
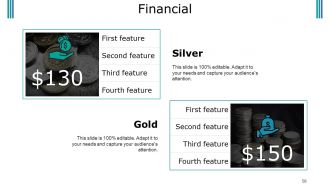
Slide 58: This is a Financial score slide. State financial aspects etc. here.
Slide 59: This is a Lego image slide to show information, specifications etc.
Slide 60: This is a Target image slide to show targets, goals, information, specifications etc.
Slide 61: This is a Puzzle image slide to show information, specifications etc.
Slide 62: This is a Quotes slide. State business message, beliefs etc. here.
Slide 63: This is a Venn Diagram image slide to show information, specifications etc.
Slide 64: This is a Mind map image slide to show information, segregation, specifications etc.
Slide 65: This is a Post It slide to show information, important events, specifications etc.
Slide 66: This slide shows a Magnifying glass image with text boxes. State information etc. here.
Slide 67: This is a Silhouettes image slide to show people related information, specifications etc.
Slide 68: This is a Bulb or Idea slide to state a new idea or highlight specifications/information etc.
Slide 69: This is a THANK YOU slide with Address# street number, city, state, Contact Numbers and email address.
Budget Proposal Powerpoint Presentation Slides with all 69 slides:
Give them enough cause to arrive at a firm decision with our Budget Proposal Powerpoint Presentation Slides. Bring an end to any dilemma.
-
Budget Proposal
-
Proposal Outline
-
Company Profile
-
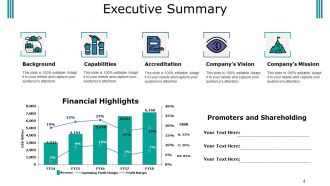
Executive Summary
-
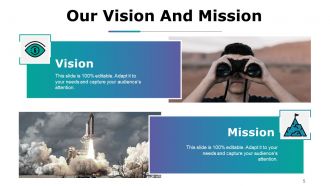
Our Vision And Mission
-
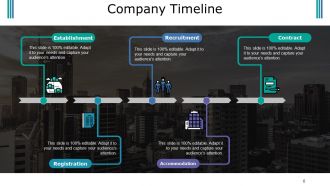
Company Timeline
-
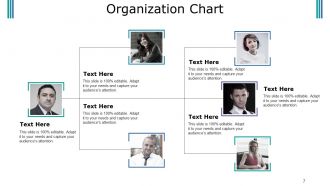
Organization Chart
-
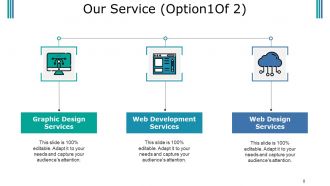
Our Service Option1Of2
-
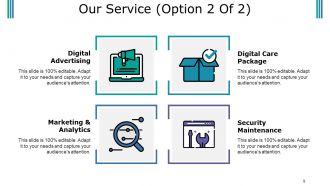
Our Service Option 2 Of 2
-
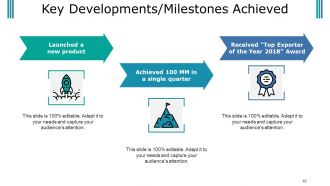
Key Developments Milestones Achieved
-
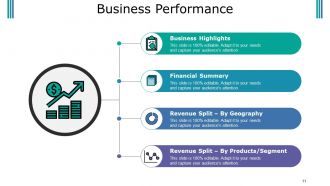
Business Performance
-
Business Highlights
-
Financial Summary
-
Revenue Split By Geography
-
Export Analysis
-
Revenue Split By Product Segment
-
Revenue Split By Product Segment
-

Market Analysis Key Competitors
-
Our Market Share
-
Competitive Landscape
-
Top Debtors Creditors
-
Client Project Updates
-
Client Updates
-
Top Customers Vendors
-
Project Updates
-
Financial Performance
-
Income Statement Graphical Representation
-
Income Statement Tabular Form
-
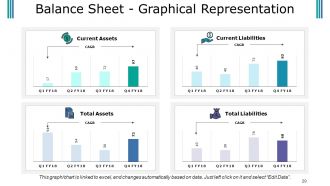
Balance Sheet Graphical Representation
-
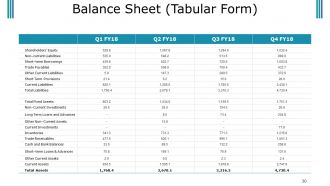
Balance Sheet Tabular Form
-
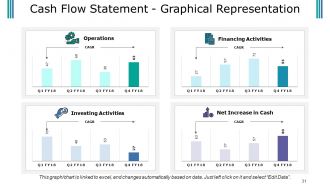
Cash Flow Statement Graphical Representation
-
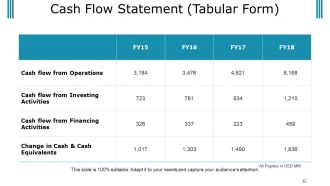
Cash Flow Statement Tabular Form
-
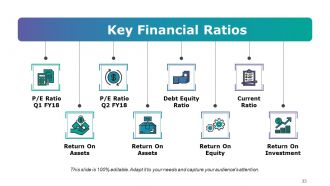
Key Financial Ratios
-
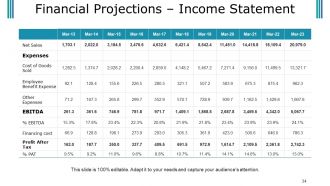
Financial Projections Income Statement
-
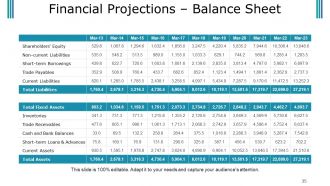
Financial Projections Balance Sheet
-
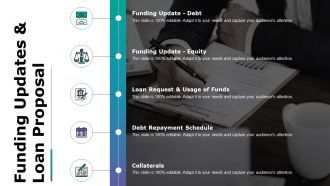
Funding Updates Loan Proposal
-
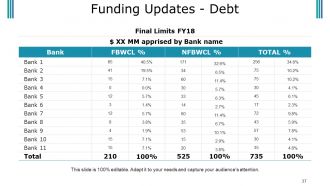
Funding Updates Debt
-
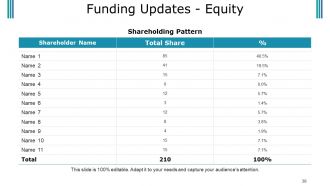
Funding Updates Equity
-

Loan Request
-
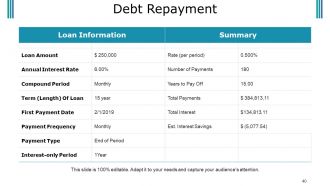
Debt Repayment
-
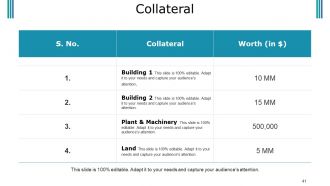
Collateral
-
Debt Requirement Repayment Timeline
-
Budget Proposal Icon Slide
-

Coffee Break
-
Charts Graphs
-
Area Chart
-
Combo Chart
-
Line Chart
-
Clustered Bar
-
Additional Slides
-
Our Mission
-

Our Team
-
About Us
-
Comparison
-
Our Main Goal
-
Location
-
Timeline
-
Financial
-
Lego
-
Target
-
Puzzle
-

Budget Proposal
-
Venn
-

Mind Map
-
Post It
-
Magnifying Glass
-

Silhouettes
-
Idea Or Bulb
-

Thank You
FAQs for Budget Proposal
Start with a solid executive summary, then break down every line item with real numbers - not just ballpark guesses. Most people totally bomb the timeline section because they're way too vague about milestones. Justify each expense so reviewers actually understand what they're approving. Include your assumptions and any risks that might mess with costs. Always add a contingency buffer (trust me on this one). Show them the expected ROI too. The whole point is being specific enough that they can actually evaluate your proposal instead of just skimming through it and hoping for the best.
Dude, trust me on this - clean budget proposals make SUCH a difference. Stakeholders can actually follow what you're asking for instead of drowning in messy spreadsheets. Nothing's worse than those confusing number dumps, right? You'll build way more trust when everything's transparent. People ask smarter questions too. The back-and-forth gets cut in half because nobody's confused about line items or totals. Honestly, I've seen proposals get approved in like half the time just because they were organized well. Takes longer upfront but it's so worth it.
Look at your spending from the last 2-3 years first - you'll spot patterns and seasonal stuff pretty quickly. Split everything into fixed costs like rent and salaries versus variable ones like supplies. I always throw in a 5-10% buffer because random expenses will hit you (trust me on this). Get actual quotes for new projects instead of just winging it. Monthly breakdowns work way better than yearly totals since you can catch problems early. Oh, and don't forget inflation is still crazy right now, so factor that in too.
Honestly, charts and graphs are game-changers for budget presentations. Nobody wants to sit through you reading numbers off a spreadsheet - trust me on that one. Bar charts work great when you're comparing different categories, and pie charts are solid for showing how you split up the total budget. For trends over time? Go with line graphs. Just don't overcrowd your slides with too much stuff. People actually remember things better when they can see what you're talking about. Oh, and throw a quick takeaway right on each visual so it's crystal clear.
Don't be vague with your numbers - that's the killer. Like, you can't just say "miscellaneous stuff $500" and think that'll fly. I made that mistake once, oof. Build in 10-15% extra for when things go sideways (they always do). Double-check your math because basic errors make you look sloppy. Your timeline needs to match when you're actually spending money too. Oh, and definitely look up what similar projects cost instead of pulling numbers out of thin air. Get someone else to look it over - you'll miss obvious stuff that they won't.
Oh man, so the big thing is where your money comes from and how you explain spending it. Nonprofits are all about showing mission impact and proving to donors you're using funds well - like every dollar has to clearly help your cause, you know? For-profits just care about ROI and profit margins. Way simpler honestly. Nonprofit budgets get messy though because of restricted funding rules. You'll constantly break down program costs vs admin expenses, plus allocate indirect costs differently. It's kind of a headache. Figure out who you're reporting to first - that'll shape everything else.
Honestly, you can't wing budget proposals anymore - executives will tear you apart without solid data backing everything up. Pull together your historical spending trends, ROI numbers, performance metrics, whatever shows your track record. Numbers help you catch wasteful spending and prove why new investments actually make sense. Oh, and don't just throw spreadsheets at people (learned that one the hard way). Instead, craft your data into a story that connects spending to real business results. Without this stuff, you're basically asking them to trust your gut feeling, which... good luck with that.
So basically you need solid numbers that prove your investment will actually make money back. Show the revenue boost, cost cuts, productivity jumps - whatever applies to your situation. Definitely add a timeline because bosses eat that stuff up, they want to know exactly when they'll see results. Hard dollars are key, but don't forget the softer wins like happier employees or better customer retention (those turn into money eventually anyway). Oh and don't go crazy with your estimates - I've seen people burn bridges by promising the moon. Keep it simple: here's what we spend, here's what we get back over the next few years.
Ugh, budget pushback is the worst. First thing - prep for their objections ahead of time. Have your ROI numbers, cost breakdowns, whatever data backs you up. Don't get defensive when they start poking holes (easier said than done, I know). Just listen and hit back with specifics. If they make a good point though? Just own it and show how you can tweak things. Everything needs to connect to outcomes they actually give a shit about. Oh, and bring backup plans - like two other scenarios minimum. You don't want to be stuck defending just one approach.
Check your variance reports from the past couple years - they're gold for spotting what actually happens vs your wishful thinking. Marketing events that blow their budget every single time? Note that. Departments that never hit those optimistic savings targets? Yep, track those too. I've noticed Q4 tends to get weirdly expensive across the board, so factor that in. Don't just copy last year's numbers and cross your fingers. Those patterns give you real data to back up your requests instead of just guessing. Makes your whole proposal way more bulletproof.
Check your variance between what you planned vs what you actually spent - that's the big one. ROI on major stuff matters too, plus cash flow trends. But honestly? The "soft" metrics are just as crucial - employee productivity, customer satisfaction, project completion rates. Those tell you if your money's actually working. I like adding leading indicators too, like pipeline metrics, since they give you a heads up before things go sideways. Monthly dashboards help you catch problems early. Oh and efficiency ratios - those are super telling.
Honestly, funding sources make a huge difference in how you set up your budget. Federal grants are super picky - they want every line item justified down to the last paperclip. Private foundations? Way more chill, they just want to see the big picture and impact. Corporate sponsors are all about what they get back - visibility, PR, that kind of stuff. So yeah, you'll be tweaking formats and emphasis depending on who you're asking. Oh, and definitely dig into their guidelines first before you start writing. I usually make one master budget then adapt it for each funder. Saves time in the long run.
Get everyone together first (Zoom works fine) and hammer out priorities before diving in - saves so much headache later. Give people ownership of specific budget chunks so nobody's duplicating work. Shared Google sheets are your friend here, way better than email hell. Schedule regular check-ins though, because someone always misses something obvious. Honestly, those walkthrough meetings where you review everything together? Super boring but they catch the dumb mistakes. Oh, and set your internal deadline like a week early. You'll need that buffer time when someone realizes they forgot about Q4 marketing spend.
Start with compliance from day one - don't try to squeeze it in later. Check your org's financial policies and whatever regs apply to your funding. My first budget got totally rejected because I missed some random procurement rule (still annoying honestly). Go through each line item against approved categories and spending limits. Your finance team catches stuff you'll miss, so loop them in early on drafts. Keep everything documented with clear approval chains. Oh, and make it a actual checklist item. Way easier than scrambling to fix compliance issues after the fact.
Look, you definitely want a contingency plan because stuff *always* goes sideways. Shows stakeholders you're not naive about how projects actually work, and they won't panic when you hit bumps. Smart risk management too - gives you breathing room for scope creep or those random costs that pop up. I learned this the hard way on my last project, honestly. Budget around 10-15% extra and spell out what specific scenarios you're covering. Way better than scrambling for emergency funds later when everything's on fire.
-
I discovered this website through a google search, the services matched my needs perfectly and the pricing was very reasonable. I was thrilled with the product and the customer service. I will definitely use their slides again for my presentations and recommend them to other colleagues.
-
Awesome presentation, really professional and easy to edit.