


Capital Budget Powerpoint Presentation Slides


Try Before you Buy Download Free Sample Product
 Impress Your
 Audience
Editable
of Time


Make an impressive business presentation with our Capital Budget PowerPoint Presentation Slides. Budgeting is a key component of every business. By using this investment decision PowerPoint complete deck, you can showcase a measurable way to determine long term economic and financial profitability. This investment appraisal PPT presentation includes creative slides on budgeting templates, channel marketing budget, planned/actual cost comparison, product launch budget plan, company budget, event budget, product launch marketing budget, social media budget etc. Our researchers thoroughly study the topics and covered every aspect of capital budgeting. Financial management PPT design can be used for related terms such as cost analysis, capital structure, financial management, cash flow, budget planning, revenue forecast, profitability index, capital management, financial plan, funding sources to name a few. Download capital expenditure PowerPoint template to present factors affecting financial decisions. Our Budget Presentation Slides create the framework for the final form. They contribute to the evolution of concepts.
People who downloaded this PowerPoint presentation also viewed the following :
Content of this Powerpoint Presentation
Slide 1: This slide introduces Capital Budget. State your company name and proceed.
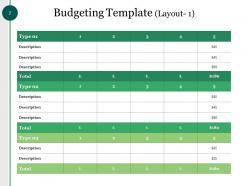
Slide 2: This slide shows Budgeting Template Layout- 1. Add relevant data and use it.
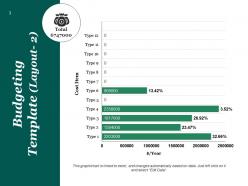
Slide 3: This slide shows Budgeting Template Layout- 2 in a bar graph/ chart form.
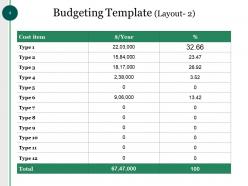
Slide 4: This slide presents Budgeting Template Layout- 2 with a table to add the cost item and other deatils.
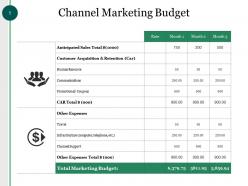
Slide 5: This slide shows Channel Marketing Budget table with icon imagery.
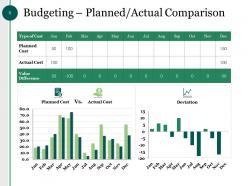
Slide 6: This slide shows Budgeting – Planned/Actual Comparison in charts and graph.
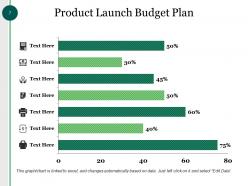
Slide 7: This slide presents Product Launch Budget Plan in a graphical form.
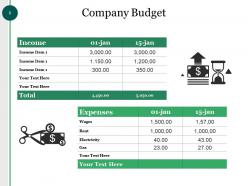
Slide 8: This slide shows Company Budget in a tabular form and icon imagery.
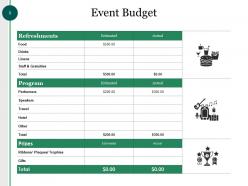
Slide 9: This slide shows Event Budget. Use it to show the budget decided by your company for each event.
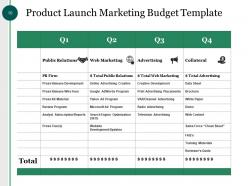
Slide 10: This slide shows Product Launch Marketing Budget Template containing Public Relations, Web Marketing, Advertising, Collateral.
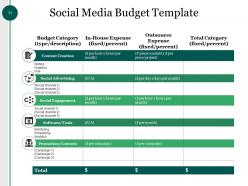
Slide 11: This slide shows Social Media Budget Template.
Slide 12: This is Capital Budget Icon Slide. Alter the icons as per your need.
Slide 13: This is a Coffee Break slide to halt. You may change it as per requirement.
Slide 14: This slide is titled Charts & Graphs to move forward. You may change it as per requirement.
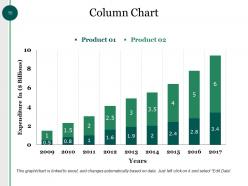
Slide 15: This is a Column Chart slide for product/ entity comparison.
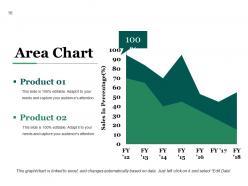
Slide 16: This is an Area Chart slide for product/ entity comparison.
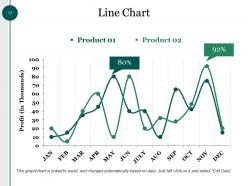
Slide 17: This slide shows a Line Chart for two product comparison.
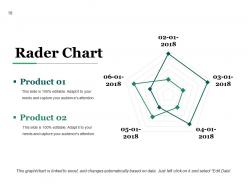
Slide 18: This slide presents a Radar Chart. Compare Product 01, Product 02 and use as per required.
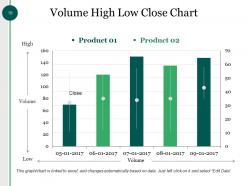
Slide 19: This slide presents Volume High Low Close Chart. Compare Product 01, Product 02 and use as per required.
Slide 20: This slide is titled Additional Slides to move forward. You can change the slide content as per need.
Slide 21: This slide showcases Our Mission. Show your company mission and vision here.
Slide 22: This is Meet Our Team slide with name, designation and image to add.
Slide 23: This is an About Us slide. State team/ company specifications here.
Slide 24: This is Our Goal slide. State your goals here.
Slide 25: This is a Dashboard slide to show information in percentages etc.
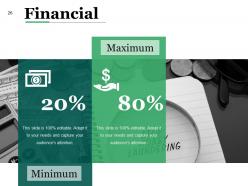
Slide 26: This slide presents Financial scores to display.
Slide 27: This is a Quotes slide to highlight, or state anything specific.
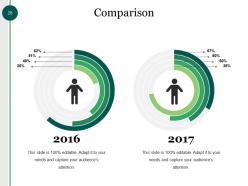
Slide 28: This slide shows Comparison between two entities/ products etc.
Slide 29: This is a Location slide to show global growth, presence etc. on a world map image.
Slide 30: This slide shows Target with text boxes. State your targets here.
Slide 31: This is a Puzzle pieces image slide to show information, specifications etc.
Slide 32: This is a Circular image slide. State specifications, information here.
Slide 33: This is a LEGO slide with text boxes to show information.
Slide 34: This is a Silhouettes slide to show information, specifications etc.
Slide 35: This is a Hierarchy slide to show information, organization/ team structure, specifications etc.
Slide 36: This is a Venn diagram image slide to show information, specifications etc.
Slide 37: This slide shows a Mind map for representing entities.
Slide 38: This is a Magnifying Glass image slide to show information, scoping aspects etc.
Slide 39: This is a Bulb With Idea image slide to show ideas, innovative information etc.
Slide 40: This is a Thank You image slide with Address, Email and Contact number.
Capital Budget Powerpoint Presentation Slides with all 40 slides:
Assess the interplay with our Capital Budget Powerpoint Presentation Slides. Analyze the interaction between different forces.


FAQs for Capital Budget
So you've got four main tools: NPV, IRR, payback period, and profitability index. NPV's honestly your best bet since it shows the actual dollar value you're adding. IRR gives you a percentage return - executives eat that stuff up because it's easier to understand than raw numbers. Payback period just tells you how long until you break even, though it totally ignores what happens after that (which is kinda dumb but whatever). When you're short on cash and comparing projects, profitability index works great. I'd start with NPV every time, then use the others to back up your argument.
So basically, money today beats money tomorrow - that's the whole deal with capital budgeting. You've got inflation eating away at value plus all those other investment opportunities you're missing out on. NPV and IRR methods exist for exactly this reason - they discount future cash flows back to what they're actually worth right now. Honestly, I've seen people mess this up so badly by treating a dollar in year 5 the same as today's dollar. Just use your company's cost of capital as the discount rate and you'll avoid making those rookie mistakes.
Honestly, you can't do capital budgeting right without thinking about risk first. What happens if your cash flows tank or the market shifts? Nobody knows the future, but you can still model different scenarios. I always stress-test my assumptions - like, what if sales drop 20%? Bump up your discount rates to account for uncertainty, and definitely run sensitivity analyses on the big variables. Oh, and build some cushion into your projections because things rarely go exactly as planned. Having backup plans saves you when stuff hits the fan.
So sensitivity analysis is basically stress-testing your financial model - you tweak key assumptions to see how much your NPV or IRR changes. Pick your 3-4 most uncertain variables (sales, costs, discount rate) and run them at ±10-20% to see what happens. The cool thing is you'll quickly spot which factors actually matter vs the ones that barely move the needle. Way better than presenting just one perfect scenario to your boss, because we all know those projections are usually too optimistic anyway. You'll have actual ranges to work with and won't get blindsided later.
So NPV tells you the actual dollar amount your project adds to the company. IRR just gives you a percentage return rate. Honestly, NPV is way more reliable since it uses your real cost of capital. IRR gets weird sometimes - you'll end up with multiple rates or funky results when cash flows don't follow normal patterns. Super annoying. Plus IRR assumes you can reinvest everything at that same high rate, which is pretty unrealistic most of the time. When you're picking between projects, NPV wins because it shows which one actually creates more value. Go with NPV.
Oh absolutely, those soft factors can totally trump the numbers. Employee morale, brand stuff, regulatory headaches - they matter way more than spreadsheets sometimes. I've watched companies green-light projects with awful NPVs just because they needed to enter new markets or avoid getting hammered by regulators. Safety improvements are huge too, even if they don't pencil out perfectly. Here's the thing though - try to put some kind of dollar figure on these benefits early on. Don't go crazy ignoring math completely, but yeah, sometimes the intangible stuff is what really drives decisions.
Dude, you definitely need to include opportunity costs. When you put $1M into Project A, you're not just spending money - you're missing out on whatever Project B could've made you. Or hell, even just parking it somewhere safe. Most companies somehow still screw this up though. Your NPV is basically useless without it because you'll approve projects that actually lose money compared to your alternatives. I learned this the hard way in my first finance job. Bottom line: always think "what am I giving up here?"
So payback period is basically just "how long until I get my initial investment back?" Super easy to calculate and executives eat it up because it's so straightforward. The thing is, it totally ignores what happens after you break even. Like, maybe Project A pays back in 2 years but then makes bank for another decade - payback period doesn't care about that at all. Also doesn't factor in time value of money, which is kinda a big deal. I'd use it as a quick first pass to weed out obvious duds, but you'll definitely want to run NPV or IRR before making any real decisions.
So basically you've got two ways to deal with inflation in capital budgeting. Use nominal cash flows with nominal discount rates, or go with real flows and real discount rates. Just don't mix them - that's where people screw up. Honestly, I'd stick with the nominal approach since you're already dealing with actual dollar amounts and market rates anyway. Real rates are kind of a pain to estimate accurately. The main thing is staying consistent throughout your whole analysis. Both your cash flow projections and discount rate need the same inflation assumptions. Unless your boss specifically wants the real analysis, nominal is way more straightforward.
For cash flow forecasting, start with the basics - scenario analysis where you map out best case, worst case, and what'll probably happen. Sensitivity analysis is solid too since it shows how tweaking key variables changes your numbers. Monte Carlo gets pretty nerdy with probability distributions, but honestly it's overkill unless you're dealing with massive investments. Look at historical data from similar projects if you've got it. Don't forget inflation adjustments - that stuff adds up over time. Factor in your initial investment, ongoing operations cash flow, and what the project's worth at the end. Simple methods first, then get fancy later.
So market conditions basically control everything when it comes to capital budgeting. Good markets with cheap money? You can take bigger risks and accept lower returns. But when things go south, you'll want higher IRRs and faster paybacks - makes total sense. Interest rates mess with your discount rates and financing costs too. Honestly, uncertainty just makes everyone more conservative (learned that the hard way in 2020). You've gotta adjust your hurdle rates based on what's actually happening in the market and how easy it is to get funding.
Think about who gets hurt or helped - employees, communities, shareholders, the environment. Don't just focus on profits. Job losses matter. So do environmental costs. Be honest about your risk assumptions too, and don't cherry-pick data to make your favorite project look amazing (we've all seen that happen). Create some kind of stakeholder checklist for big projects. Honestly, it's crazy how much these financial decisions ripple out into people's actual lives. Transparency is huge here - if you're hiding something in your analysis, that's usually a red flag.
Dude, the whole capital budgeting game has changed so much. Data analytics basically does the heavy lifting now - you can run crazy scenarios in minutes that used to take forever. Real-time dashboards are clutch for tracking how projects are actually performing. Most people still live in Excel (honestly can't blame them), but Oracle's Capital Planning and Python models are becoming the norm. Oh, and integrating live market data with AI forecasting? Total game-changer for accuracy. You should definitely try one new tool this quarter - even just to mess around with it.
Here's what's worked for me - never rely on just one estimation method. Mix it up with scenario planning (best case, worst case, realistic). Get people from different teams involved early since they actually know the nitty-gritty details. Finance people sitting alone in a room making guesses? Recipe for disaster. Rolling forecasts are your friend - update estimates as new info comes in. Oh, and always pad your numbers with contingency buffers because something unexpected will definitely happen. The trick is being methodical about collecting inputs from everywhere and tweaking your projections as things progress.
Look, capital budgeting is basically your roadmap for smart long-term investing. Before running NPV or IRR calculations, I always map potential investments back to our actual strategic goals first - sounds backwards but it works. You're asking "will this project get us closer to our 5-10 year vision?" Market expansion, competitive edge, better operations - whatever matters most to your business. Set your hurdle rates around those real priorities, not just quick financial wins. Think of it like a GPS for your company's future, honestly. The numbers matter, but only after you know where you're actually trying to go.
-
Understandable and informative presentation.
-
Thanks for all your great templates they have saved me lots of time and accelerate my presentations. Great product, keep them up!