


Revenue Projection Powerpoint Presentation Slides




Try Before you Buy Download Free Sample Product
 Impress Your
 Audience
 100%
100% Editable
 Save Hours
 of Time


Forecast revenue & growth with this content ready Revenue Projection PowerPoint Presentation Slides. The yield management PowerPoint complete deck includes a set of visually appealing templates such as retail store revenue projections, revenue forecast model, monthly revenue projection, income statement projection, revenue projection per share, earning sales forecast product-wise, revenue projections by active users, etc. Our team of experts’ designers has come up with this deck after in-depth research and analysis of topics. All templates provided in this presentation are fully customizable, users can add or delete the content as per their needs. Furthermore, financial forecasting PPT visuals are apt to present various related concepts such as financial projection, income forecast, earning projection, revenue management, earning projection, monetary forecast and so on. Showcase annual budgeting process and financial planning cycles using this visually appealing cash flow forecasting PPT visuals. Download the professionally designed income projection PPT slides to make your business presentation more interactive. Ensure access to critical information with our Revenue Projection Powerpoint Presentation Slides. Give them the desired inputs.
People who downloaded this PowerPoint presentation also viewed the following :
Content of this Powerpoint Presentation
Slide 1: This slide introduces Revenue Projection. State Your Company Name and begin.
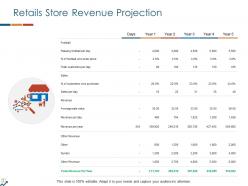
Slide 2: This slide shows Retails Store Revenue Projection describing- customers per day, sales, revenue, etc.
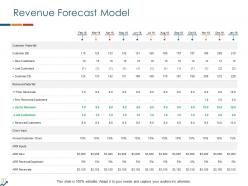
Slide 3: This slide presents Revenue Forecast Model describing- Customer waterfall, renewal waterfall, churn input, annual customer churn etc.
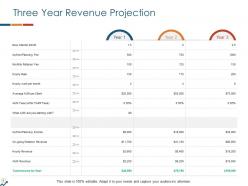
Slide 4: This slide displays Three Year Revenue Projection describing- New clients, upfront planning fee, monthly retainer fee, upfront planning income etc.
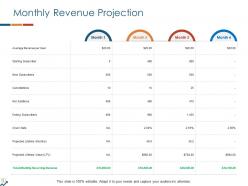
Slide 5: This slide represents Monthly Revenue Projection describing- average revenue per user, starting subscriber, new subscribers, Net additions,churn rate etc.
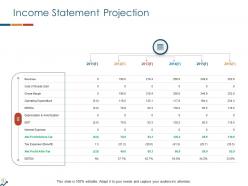
Slide 6: This slide showcases Income Statement Projection describing- Revenue, cost of goods sold, gross margin, operating expenditure etc.
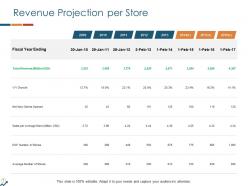
Slide 7: This slide shows Revenue Projection Per Store describing- Total revenue, net new stores opened, sales per average store etc.
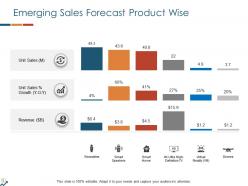
Slide 8: This slide presents Emerging Sales Forecast Product Wise describing- Unit Sales % Growth, Revenue, Unit Sales.
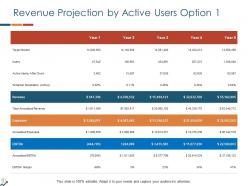
Slide 9: This slide displays Revenue Projection by Active users describing- Target market, users, Revenue, expenses etc.
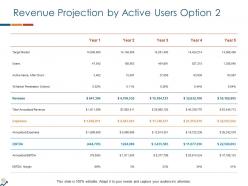
Slide 10: This is another slide on Revenue Projection by Active users in a tabular form.
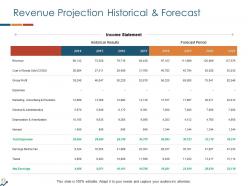
Slide 11: This slide represents Revenue Projection Historical & Forecast with Income statement, Historical results and forecast period.
Slide 12: This slide is titled as Additional Slides for moving forward.
Slide 13: This is Our Mission slide with related imagery.
Slide 14: This is Meet Our Team slide with names and designation.
Slide 15: This is About Us slide to show company specifications etc.
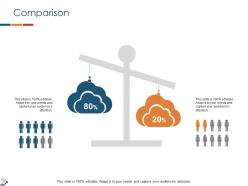
Slide 16: This is a Comparison slide to state comparison between commodities, entities etc.
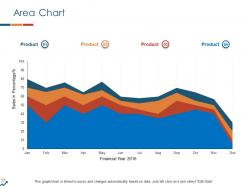
Slide 17: This slide shows Area Chart with four products comparison.
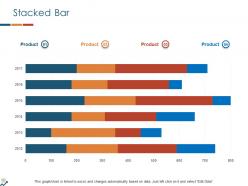
Slide 18: This slide presents Stacked Bar chart with four products comparison.
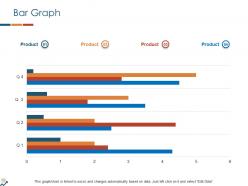
Slide 19: This slide displays Bar graph to compare products.
Slide 20: This is a Thank you slide with address, contact numbers and email address.
Revenue Projection Powerpoint Presentation Slides with all 20 slides:
Use our Revenue Projection Powerpoint Presentation Slides to effectively help you save your valuable time. They are readymade to fit into any presentation structure.





FAQs for Revenue Projection
Start with your old sales numbers - that's everything. Market trends and seasonal stuff come next, plus whatever big changes are hitting your business. Your sales pipeline matters a lot, and conversion rates too. New products launching? Factor those in. Pricing changes will mess you up if you don't model them right - I've seen that bite people before. Customer retention is huge, especially if you've got subscriptions or repeat buyers. Build a few scenarios though. Best case, worst case, and something realistic. That way you won't be blindsided when things get weird.
Look, you really need that historical data as your starting point - it shows actual patterns instead of just making stuff up. I'd go back 2-3 years if you can. Plot out your monthly revenue and you'll start seeing cycles and seasonal trends. Way more reliable than those crazy optimistic forecasts people throw around (you know the type). Short sentences work too. Just make sure you adjust for any big changes in your business or market conditions that might've thrown things off. Once you spot the patterns, projecting forward becomes way easier.
Honestly, I'd go with trend analysis if you've got decent historical data - that's usually my go-to. Market projections work too, especially when you factor in how your industry's actually growing. Bottom-up forecasting is solid if you can break it down by product lines or customer segments. Don't just pick one method though, that's asking for trouble. I always run at least two different models because single approaches can be wildly wrong (learned that the hard way). Bottom-up's typically more accurate when your customer data is clean. See where your different models overlap - that's probably your realistic range.
Look, market trends are basically your sanity check for revenue projections. Check GDP growth, unemployment, consumer spending - stuff that actually affects your business. You can't realistically project 20% growth when your entire industry is tanking, you know? Find maybe 3-4 indicators that historically match your performance patterns. Then build different scenarios around various economic conditions. Honestly, I'd focus more on industry-specific trends than broad economic stuff - they're usually better predictors. The whole point is adjusting for external factors that'll mess with demand and pricing.
Honestly, competitor analysis is like your reality check for revenue forecasts. You're tracking their pricing moves, new product drops, market share changes - all that stuff helps you spot threats that could mess with your numbers or opportunities you might've missed. Think of it as legal spying on your industry. Instead of crossing your fingers and hoping your projections work out, you can actually adjust based on what's really happening. Customer acquisition costs, pricing power, market growth - all get more realistic when you factor in competitive dynamics. I'd say check this quarterly so you don't get blindsided.
Dude, seasonality will totally mess up your revenue forecasts if you're not careful. I made this mistake once - projected smooth growth and completely forgot about our brutal Q1 slump. Rookie move. Look at 2-3 years of old data to find the patterns. Some companies crush it during holidays or summer, others tank. Don't just split revenue evenly across months like I did. Build those seasonal ups and downs right into your model. Oh, and definitely call out these assumptions when you present. Makes you look way more prepared than just winging it.
Dude, being too optimistic with your revenue numbers will absolutely wreck your cash flow planning. You end up hiring way too fast and blowing through money. Seen it happen so many times - startups just burn through their funding chasing these pie-in-the-sky targets. Your investors start losing faith when you keep missing projections, which makes raising more money a nightmare later. Teams get demoralized too when they can't hit impossible goals. Honestly, base your numbers on real data and what similar companies actually did. Then add some cushion because shit always goes sideways.
Honestly, you've gotta build in different scenarios - best case, worst case, realistic case. 2020 taught me that lesson the brutal way when everything just imploded overnight! Monthly updates are your friend here, not those rigid annual forecasts that become useless by March. Track stuff like pipeline health and churn rates since they'll warn you before revenue actually tanks. Rolling forecasts work way better than static ones. Look, your projections should change as the market changes - they're not carved in stone. Start reviewing monthly and don't be afraid to adjust when you see shifts happening.
Honestly? Just start with Excel or Google Sheets - they're still the best for most financial modeling stuff. LivePlan's pretty solid if you want something more business-plan focused. Bigger companies usually go with Adaptive Insights or Anaplan for complex scenarios, but that's probably overkill for you right now. I've literally seen people build incredible models in basic Excel that work better than fancy $10K software. The real trick is finding good templates and actually understanding what drives your revenue. Start simple with spreadsheets first - you can always upgrade later when you need better collaboration or outgrow what you've got.
Look, you've gotta break down those revenue projections by product line. Each one has totally different growth patterns and pricing - your SaaS might be crushing it at 30% growth while consulting stays flat. When you lump everything together, you're basically flying blind. Investors hate that, by the way. They want to see what's actually working and what isn't. Build separate forecasts for each line first, then add them up. Way smarter for deciding where to put your money and you'll catch problems before they get ugly. Trust me on this one.
Honestly, just ask your customers directly - way better than playing guessing games with your pipeline. Do quarterly check-ins about renewal plans or timeline stuff. The data you'll get is actually useful, unlike whatever assumptions you're making now. Teams I know have bumped their forecast accuracy up like 20-30% doing this. Plus you'll catch things you missed - maybe there's some feature everyone wants that could speed up deals. I'd start simple though, just survey them about purchase timing and budget approval status. Sounds boring but it works.
Start with your methodology upfront - builds way more credibility than just dropping numbers on people. I always do three scenarios: conservative, realistic, optimistic. Stakeholders need to see the full range, you know? Don't just hand over spreadsheets that look like ancient Greek. Explain what's actually driving those numbers. Include the risks too because let's be real, nothing ever goes perfectly to plan. Visuals help a ton for showing trends. Oh, and have real data ready to back up your assumptions when people inevitably challenge them. Update regularly and own up to variances - transparency's everything.
Monthly updates are your baseline, but honestly quarterly deep dives usually work better for most teams. Watch for big market shifts, competitor moves, or when your actual numbers are off by 15-20% from what you projected. Sales team changes are another trigger. I've watched way too many teams cling to old forecasts forever and it always comes back to haunt them. Seasonal stuff you didn't catch initially, regulatory changes, major client wins or losses - all reasons to revisit. Oh, and set a recurring reminder. Treat it like any other critical review because your future budget planning will definitely thank you later.
Honestly, diversification is like having multiple safety nets for your income. One stream tanks? No big deal - the others keep you afloat. I learned this the hard way when I was way too dependent on one client type. Now I spread things across different products, customer groups, maybe even locations. The key is finding revenue sources that don't all crash at once - like, if your B2B stuff struggles during recessions, maybe add some consumer products that actually do better then. It makes forecasting so much easier when you're not sweating every little market hiccup.
Okay so basically you make like 3-4 different versions of your revenue forecast instead of just one. Pick your biggest revenue drivers and build scenarios around those - what if your competitor slashes prices by 20%? What if the economy goes to shit? What if you actually land that huge client? Way smarter than just making one forecast and praying it works out. You get a whole range of possibilities instead of one random guess. I learned this the hard way after my projections were completely off last quarter lol. Start with best case, worst case, and realistic scenarios. Then you're not totally screwed when things inevitably go sideways.
-
Appreciate the research and its presentable format.
-
Designs have enough space to add content.
-
Excellent design and quick turnaround.
-
Amazing product with appealing content and design.
-
Great product with effective design. Helped a lot in our corporate presentations. Easy to edit and stunning visuals.