


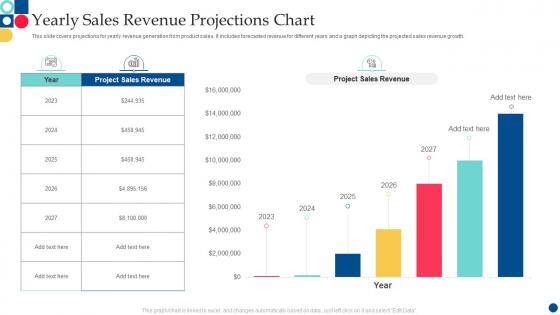
Yearly Sales Revenue Projections Chart




Try Before you Buy Download Free Sample Product
 Impress Your
 Audience
 100%
100% Editable
 Save Hours
 of Time


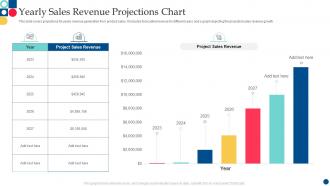
This slide covers projections for yearly revenue generation from product sales. It includes forecasted revenue for different years and a graph depicting the projected sales revenue growth.
People who downloaded this PowerPoint presentation also viewed the following :
Yearly Sales Revenue Projections Chart with all 7 slides:
Use our Yearly Sales Revenue Projections Chart to effectively help you save your valuable time. They are readymade to fit into any presentation structure.





FAQs for Yearly Sales
You'll need your historical sales data and pipeline health - that's honestly your best bet if you're tracking it right. Market trends matter too. Seasonality patterns can mess with your numbers more than you think, so definitely include those. Oh, and don't overlook lead conversion rates and sales cycle length - I've seen people get burned by ignoring that stuff. Economic indicators and upcoming campaigns should factor in somehow. Start simple though, maybe just 3-4 components first. You can always add more once you're not drowning in spreadsheets.
Market trends basically control whether your sales forecasts are spot-on or total garbage. You've got to think about economic shifts, how people are buying stuff differently, seasonal ups and downs - all that external noise. Nobody saw the whole remote work explosion coming, right? That's the perfect example. Sometimes trends will push your numbers way higher than expected. Other times they'll tank everything, even if you were being super conservative. Honestly, I think most people don't update their forecasts nearly enough. Build in some wiggle room and keep adjusting as new data comes in.
Look, historical data is honestly your best friend when forecasting sales. Pull at least 2-3 years of monthly numbers if you've got them - one year can be totally misleading (thanks a lot, pandemic). You're hunting for patterns here. Which months always crush it? When do things slow down? I always get surprised by how much seasonality affects businesses that seem like they shouldn't have any. Economic shifts will show up in your data too, plus you'll see what growth rate is actually realistic instead of just wishful thinking. Start with those monthly trends - they'll tell you everything.
Start with your marketing calendar - that's your foundation. Take each campaign you've planned and estimate leads based on what's worked before. Conversion rates for each stage of your customer journey matter too. I hate when teams don't coordinate on this stuff, but honestly it happens all the time. Don't forget seasonal patterns and competition when you're crunching numbers. Testing new channels? Build in some conservative estimates there. The whole point is connecting your actual marketing plans to realistic sales numbers instead of just guessing.
Look at your past forecasts vs what actually happened - that's the best reality check. I still cringe remembering how wrong my Q3 numbers were last year, ugh. Cross-check against your pipeline health and conversion rates too. Your sales team knows customers better than spreadsheets do, so get their input. Monthly check-ins help you spot patterns early. If you're consistently off by 20% in one direction, adjust your method. Back-testing previous projections shows you where your blind spots are. Market conditions change fast, so don't rely on historical data alone.
Look, seasonal stuff will absolutely wreck your forecasts if you ignore it. Retail goes crazy during holidays, but B2B software? Total ghost town in Q4 when everyone's budget is locked up. You need like 3-4 years of data to really see what's happening - ice cream spikes are obvious, but some patterns are weird. Construction basically dies in winter while tax people make bank in spring. My advice? Build those seasonal multipliers right into your baseline instead of crossing your fingers. Just plot your monthly sales over a few years first though - you'll spot the trends pretty quick.
Honestly, if you're already on Salesforce or HubSpot, just use their built-in analytics - saves you so much time since it pulls straight from your pipeline. Excel's actually pretty solid too if you know your way around formulas (their forecasting stuff is better than people think). Tableau and Power BI look amazing but yeah, bit of a learning curve there. Oh, and some teams swear by Anaplan or Adaptive Insights for the specialized features. Main thing though? Pick whatever plays nice with your current setup. I've seen people waste weeks manually entering data because they went with something fancy that doesn't integrate well.
Honestly, tracking competitors is pretty straightforward once you get into it. Set up Google alerts for your main rivals and check what they're doing monthly. Their earnings calls are goldmines - companies spill way more than they should about future plans. When they drop prices or launch competing products, dial your projections down. If they're hemorrhaging clients or struggling, bump yours up. I usually look at how their past moves actually hit our numbers, then use that pattern going forward. Takes maybe an hour a month but it'll save you from those "wait, what happened to Q3?" moments.
Biggest mistake? Being way too optimistic about your numbers. Don't just copy last year's data without thinking about what's actually changed - market's different now. Sales cycles always take longer than you think they will, trust me on this one. Your sales team knows what's realistic way better than spreadsheets do, so actually talk to them before finalizing anything. Seasonality will mess you up if you ignore it. I always start conservative and build in extra time, then bump things up if we're crushing it. Way better than scrambling when projections fall short.
Look, customer feedback is basically your crystal ball for sales projections. Happy customers raving about features? Boost those numbers. Getting complaints? Yeah, dial back your estimates because people won't buy stuff they're complaining about. What's smart is tracking how the feedback changes over time - you'll spot trends way before they actually mess with your sales figures. Don't treat feedback like some separate thing either. Pull those metrics right into your quarterly meetings. I mean, it's literally free market research sitting in your inbox. Makes way more sense than guessing, right?
AI and machine learning can spot patterns you'd never catch on your own - honestly, some of the predictions still blow my mind. Real-time CRM integration gives you way cleaner data to work with. The predictive stuff factors in seasonality, customer behavior, all that good stuff. Automated cleaning cuts out human errors too, which is huge. Plus better visualization tools actually help you make sense of what you're looking at instead of just staring at spreadsheets. Oh, and definitely start by connecting your existing data sources first - that alone will improve your baseline predictions before you get fancy with anything else.
Honestly, start by figuring out what economic stuff actually hits your market - like are you sensitive to interest rates or unemployment? Then just update your assumptions based on that. If we're heading into a recession (which feels likely tbh), I'd definitely be more conservative with growth projections. Maybe add a few weeks to your sales cycles too. I got burned hard in 2020 by being too optimistic! Try stress-testing your numbers against a couple different scenarios first. Then pick something realistic for your baseline. Oh, and update this quarterly - not just once a year when you remember.
Honestly, data beats guessing every single time. You'll catch trends that would totally fly under your radar otherwise. When you walk into those leadership meetings, people actually listen because you've got real numbers - not just "I think Q4 will be great!" Historical data shows you what's really moving the needle too, which is kind of eye-opening. Seasonal patterns are huge, so grab at least a year's worth of data and start there. Way fewer nasty surprises when the actual results roll in. Trust me, your stakeholders will thank you for not pulling numbers out of thin air like everyone else does.
So basically sales projections help you figure out how much stuff to order and when. Avoid those annoying stockouts when everyone wants your product, plus you won't get stuck with tons of inventory nobody's buying. Your procurement team will love you for sharing these numbers - they can negotiate better deals when they know exactly what's coming. Oh and the supply chain planning gets way easier too. I swear half the inventory disasters I've seen could've been avoided if teams just updated their projections regularly. It's not rocket science but for some reason people treat it like this separate thing instead of connecting it to their actual ordering decisions.
Focus on conversion rates through your funnel first - that's like your bread and butter. Average deal size and how long sales cycles take matter too. Lead quality scores are huge because let's be real, some leads are just garbage. Pipeline velocity shows which deals actually move vs the ones that sit there forever. Win/loss ratios by rep or product help you figure out what's working. Oh, and track how accurate your forecasts actually are over time - you'd be surprised how off most people are at first. Start simple with these basics, then add more detailed stuff once you're not drowning in data.
-
The visual appeal of the templates is just unparalleled! I was so worried about the design of my presentation but SlideTeam made it all so easy.
-
Design layout is very impressive.