

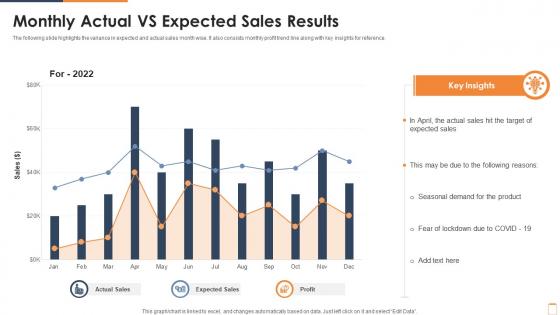
Monthly Actual Vs Expected Sales Results




Try Before you Buy Download Free Sample Product
 Impress Your
 Audience
 100%
100% Editable
 Save Hours
 of Time


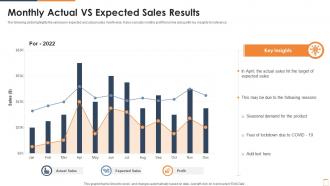
The following slide highlights the variance in expected and actual sales month wise. It also consists monthly profit trend line along with key insights for reference.
People who downloaded this PowerPoint presentation also viewed the following :
Monthly Actual Vs Expected Sales Results with all 7 slides:
Use our Monthly Actual Vs Expected Sales Results to effectively help you save your valuable time. They are readymade to fit into any presentation structure.





FAQs for Monthly Actual Vs
Businesses should focus on conversion rates, average deal size, sales cycle length, customer acquisition cost, and revenue per sales representative during analysis. These metrics enable organizations to identify bottlenecks, optimize pricing strategies, and enhance team performance, with many companies finding that tracking these indicators ultimately delivers improved forecasting accuracy and sustainable revenue growth.
Sales trends can be identified through historical sales data by analyzing patterns in revenue, volume, seasonality, customer behavior, and product performance over time. Through data visualization tools and statistical analysis, organizations streamline forecasting, optimize inventory management, and enhance strategic planning, with many retail and manufacturing companies finding that trend analysis ultimately delivers improved sales predictions and competitive market positioning.
Customer segmentation plays a crucial role in sales analysis by enabling businesses to identify distinct customer groups based on demographics, purchasing behavior, geographic location, and buying patterns. Through targeted segmentation strategies, companies streamline resource allocation, enhance personalized marketing approaches, and optimize pricing strategies, ultimately delivering improved conversion rates and customer retention, with many organizations finding that segmented analysis increases sales effectiveness significantly.
Statistical methods enhance sales forecasts through regression analysis, time series modeling, moving averages, seasonal decomposition, and predictive analytics algorithms. These approaches analyze historical patterns, market trends, and customer behavior data, enabling organizations to minimize forecasting errors, optimize inventory management, and improve resource allocation, with many retailers and manufacturers finding significantly more accurate demand predictions.
The most effective sales analysis tools include CRM systems like Salesforce, analytics platforms such as Tableau and Power BI, pipeline management software, and specialized tools like HubSpot Analytics. These technologies streamline data collection, automate reporting processes, and deliver actionable insights, with many organizations finding that integrated dashboards significantly enhance forecasting accuracy and strategic decision-making capabilities.
Market competition influences sales performance analysis by requiring businesses to benchmark against rivals, analyze market share dynamics, and identify competitive positioning gaps. Through competitive intelligence tools and comparative metrics, organizations can uncover pricing strategies, product differentiation opportunities, and customer retention weaknesses, ultimately enabling data-driven decisions that enhance market positioning and drive sustainable revenue growth in increasingly competitive landscapes.
Seasonality significantly affects sales data interpretation by creating predictable fluctuations that can mask underlying trends, distort year-over-year comparisons, and complicate forecasting accuracy. Retailers, hospitality businesses, and consumer goods companies increasingly use seasonal adjustment techniques and multi-year trend analysis to distinguish between natural seasonal patterns and genuine performance shifts, ultimately enabling more accurate strategic planning and inventory management.
Sales analysis identifies growth opportunities by examining customer behavior patterns, product performance metrics, market segment profitability, seasonal trends, and geographic data. Through advanced analytics, businesses can pinpoint underperforming territories, discover cross-selling opportunities, and optimize pricing strategies, while many organizations find that targeted analysis of customer lifetime value and purchase patterns ultimately delivers enhanced revenue streams and competitive market positioning.
Common sales analysis pitfalls include relying on incomplete data, ignoring seasonal trends, focusing solely on revenue without considering profitability, and failing to segment customer data effectively. These oversights can mislead strategic decisions, with many organizations finding that comprehensive analysis incorporating market context, customer behavior patterns, and competitive positioning ultimately delivers more accurate insights and sustainable growth strategies.
Integrating customer feedback enhances sales insights by revealing purchasing motivations, identifying product gaps, and uncovering satisfaction drivers that traditional metrics miss. Through sentiment analysis and feedback correlation, sales teams pinpoint which features drive conversions, optimize pricing strategies, and predict customer lifetime value, ultimately delivering more targeted approaches and improved retention rates across diverse market segments.
Conversion rates reveal the percentage of prospects who complete desired actions, serving as critical indicators of sales funnel efficiency, marketing effectiveness, and revenue optimization potential. By tracking conversion rates across different stages, channels, and customer segments, businesses can identify bottlenecks, optimize resource allocation, and enhance overall sales performance, ultimately delivering higher ROI and competitive advantage.
Visualization techniques improve sales data understanding by transforming complex numbers into clear charts, graphs, and dashboards that reveal patterns, trends, and performance gaps instantly. Through interactive visualizations, sales teams can identify top-performing products, seasonal fluctuations, and regional variations more effectively, while managers gain actionable insights for strategic decision-making, ultimately enhancing forecasting accuracy and revenue optimization.
Sales analysis supports product development strategies by identifying customer preferences, market gaps, seasonal trends, pricing sensitivities, and performance patterns across different segments. Through comprehensive data evaluation, companies can prioritize feature development, optimize product portfolios, and align innovation efforts with market demand, with many organizations finding that data-driven product decisions significantly reduce development risks while enhancing market success rates.
Sales data optimizes pricing strategies by revealing customer price sensitivity, demand patterns across segments, and competitive positioning insights through historical transaction analysis. Through advanced analytics, organizations can implement dynamic pricing models, identify optimal price points for different customer segments, and adjust strategies based on seasonal trends, ultimately enhancing profit margins while maintaining market competitiveness.
Ethical considerations in sales data analysis include customer privacy protection, data security measures, transparent consent processes, avoiding discriminatory practices, and ensuring accurate representation of findings. These principles help organizations build trust while complying with regulations like GDPR, with many companies finding that ethical data practices ultimately enhance customer relationships and competitive advantage.
-
SlideTeam just saved my project! Thank you so much. The variety of templates helped me showcase multiple perspectives easily.
-
The content is very helpful from business point of view.