


Monthly business analysis powerpoint presentation slides


Try Before you Buy Download Free Sample Product
 Impress Your
 Audience
Editable
of Time


Demonstrate the ways that help to plan and monitor the business functions or activities by using our content ready Monthly Business Analysis PowerPoint Presentation Slides. With the aid of this visually appealing monthly business review PPT theme, you can display the financial performance and stability of your organization. Use the corporate performance analysis PowerPoint graphics and explain how to maintain the monthly balance sheet of the overall cost manufacturing and other operational costs. You can elaborate on the valuable data insights of your organization with the help of the business analysis process flow presentation template. Take the assistance of the financial planning & analysis PowerPoint layout and portray the steps that solve the business-related issues. Employ this professionally designed monthly performance review PPT visuals and define the business requirements more efficiently. By using the company analysis presentation slides, you can determine the key financial ratios of your business. Hence, download our ready-to-use monthly performance review PowerPoint deck and analyze the monthly reports of your company.
People who downloaded this PowerPoint presentation also viewed the following :
Content of this Powerpoint Presentation
Slide 1: This slide introduces Monthly Business Analysis. State Your Company Name and begin.
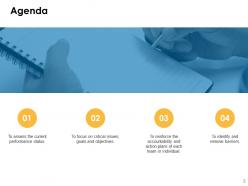
Slide 2: This is an Agenda slide. State your agendas here.
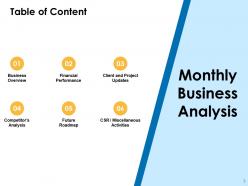
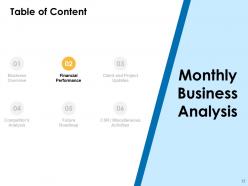
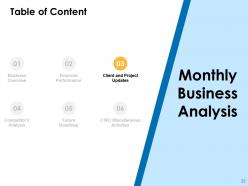
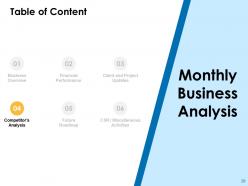
Slide 3: This slide shows Table of Content for the presentation.
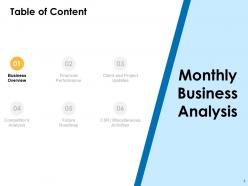
Slide 4: This slide highlights Business Overview from Table of Content.
Slide 5: This slide displays Highlights with related icons and additional text boxes.
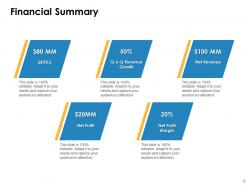
Slide 6: This slide presents Financial Summary describing- EBITDA, Net Profit, Q-O-Q Revenue Growth, Net Profit Margin, Net Revenue.
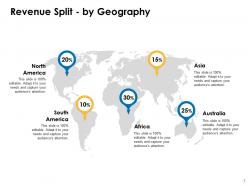
Slide 7: This slide showcases Revenue Split - by Geography showing data in percentage.
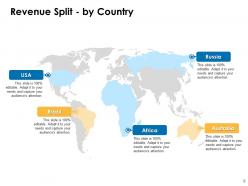
Slide 8: This slide represents Revenue Split - by Country including countries as- Asia, Australia, South America, North America, Africa.
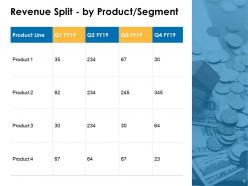
Slide 9: This slide shows Revenue Split - by Product/ Segment in tabular form.
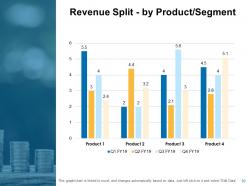
Slide 10: This slide presents Revenue Split - by Product/ Segment in graphical form.
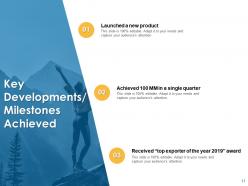
Slide 11: This slide displays Key Developments/ Milestones Achieved with related imagery.
Slide 12: This slide highlights Financial Performance from Table of Content.
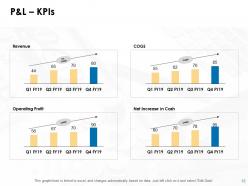
Slide 13: This slide represents P&L - KPIs describing- Revenue, COGS, Operating Profit, Net Increase in Cash.
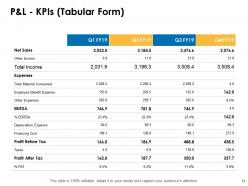
Slide 14: This slide shows P&L - KPIs in Tabular Form.
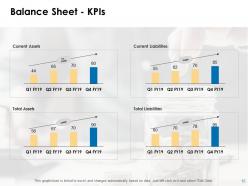
Slide 15: This slide presents Balance Sheet - KPIs in graphical form.
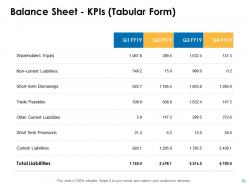
Slide 16: This slide presents Balance Sheet - KPIs (Tabular Form) showing liabilities.
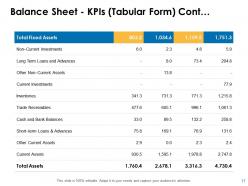
Slide 17: This slide displays Balance Sheet - KPIs (Tabular Form) showing assests.
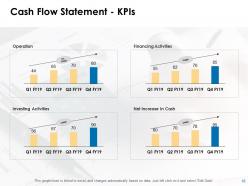
Slide 18: This slide represents Cash Flow Statement - KPIs describing- Operation, Financing Activities, Investing Activities, Net Increase In Cash.
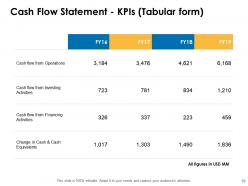
Slide 19: This slide showcases Cash Flow Statement - KPIs (Tabular Form).
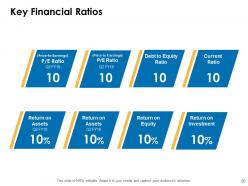
Slide 20: This slide shows Key Financial Ratios including- P/E Ratio, Debt to Equity Ratio, Current ratio, Return on Assets, Return on Equity, Return on Investment.
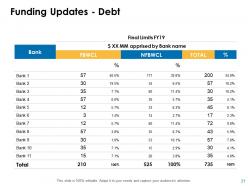
Slide 21: This slide presents Funding Updates showing Debts.
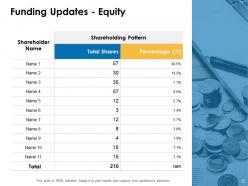
Slide 22: This slide presents Funding Updates showing Equity.
Slide 23: This slide highlights Client and Project Updates from Table of Content.
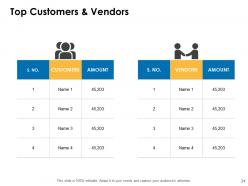
Slide 24: This slide displays Top Customers & Vendors in tabular form.
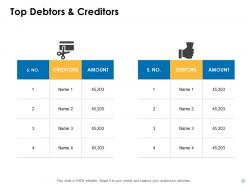
Slide 25: This slide represents Top Debtors & Creditors.
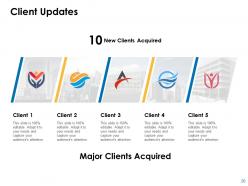
Slide 26: This slide showcases Client Updates with related images.
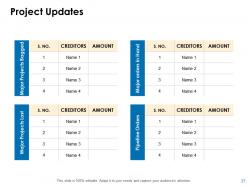
Slide 27: This slide shows Project Updates on major projects bagged, major orders in hand, major projects lost and pipeline orders.
Slide 28: This slide highlights Competitor's Analysis from Table of Content.
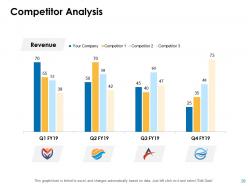
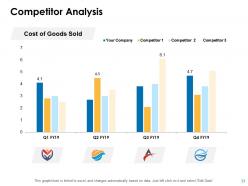
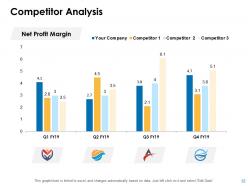
Slide 29: This slide shows Competitor Analysis with the help of bar graph.
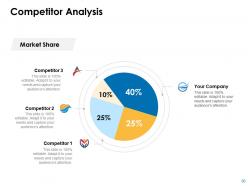
Slide 30: This slide presents Competitor Analysis with the help of Pie Chart.
Slide 31: This is an optional slide on Competitor Analysis.
Slide 32: This is another optional slide on Competitor Analysis.
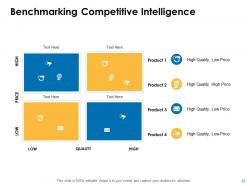
Slide 33: This slide showcases Benchmarking Competitive Intelligence in matrix form.
Slide 34: This slide highlights Future Roadmap from Table of Content.
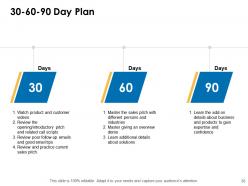
Slide 35: This slide shows 30-60-90 Day Plan with text boxes.
Slide 36: This slide presents Light Bulb with Time Planning Ideas.
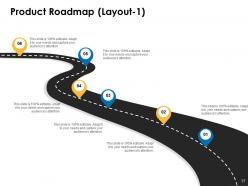
Slide 37: This slide displays Product Roadmap (Layout - 1) in timeline form.
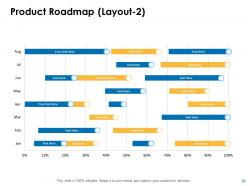
Slide 38: This slide represents Product Roadmap (Layout - 2) in graphical form.
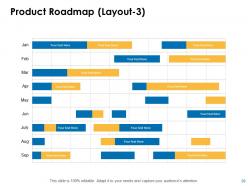
Slide 39: This slide showcases Product Roadmap (Layout - 3).
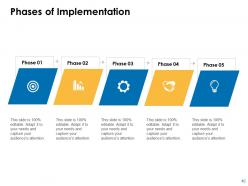
Slide 40: This slide shows Phases of Implementation with text boxes.
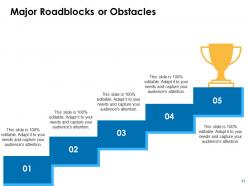
Slide 41: This slide presents Major Roadblocks or Obstacles.
Slide 42: This is an optional slide for Major Roadblocks or Obstacles.
Slide 43: This slide displays Swot Analysis. Describe your firm's Strengths, weaknesses, opportunities and threats.
Slide 44: This slide highlights CSR / Miscellaneous Activities from Table of Content.
Slide 45: This slide represents Corporate Social Responsibility (CSR) with related diagram and text boxes.
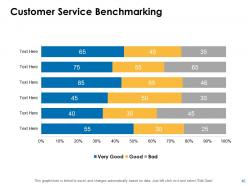
Slide 46: This slide showcases Customer Service Benchmarking in graphical form.
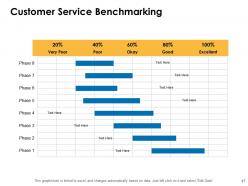
Slide 47: This is an optional slide for Customer Service Benchmarking.
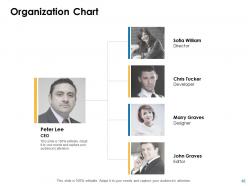
Slide 48: This slide shows Organization Chart with names and designation.
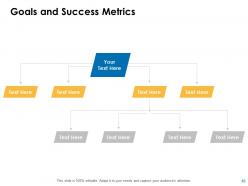
Slide 49: This slide presents Goals and Success Metrics. Add data as per needs.
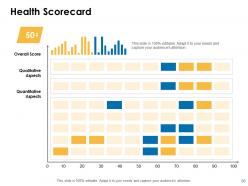
Slide 50: This slide displays Health Scorecard with Overall Score, Qualitative Aspects, Quantitative Aspects.
Slide 51: This slide showcases Monthly Business Analysis Icons.
Slide 52: This slide reminds about 15 minutes coffee break.
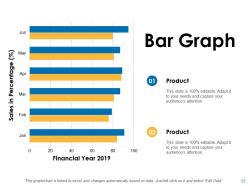
Slide 53: This slide shows Bar Graph with two products comparison.
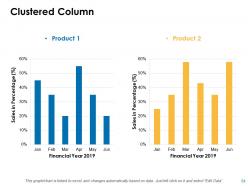
Slide 54: This slide displays Clustered Column chart with two products comparison.
Slide 55: This slide is titled as Additional Slides for moving forward.
Slide 56: This is Our Mission slide with related imagery and text.
Slide 57: This is Meet our Team slide with names and designation.
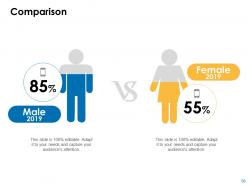
Slide 58: This is a Comparison slide to state comparison between commodities, entities etc.
Slide 59: This is a Quotes slide to convey message, beliefs etc.
Slide 60: This is a Target slide. State your targets here.
Slide 61: This is a Venn slide with text boxes.
Slide 62: This is a Puzzle slide with text boxes to show information.
Slide 63: This is an Idea Generation slide to state a new idea or highlight information, specifications etc.
Slide 64: This slide shows Magnifying Glass to highlight information.
Slide 65: This is a Thank You slide with address, contact numbers and email address.
Monthly business analysis powerpoint presentation slides with all 65 slides:
Use our Monthly Business Analysis Powerpoint Presentation Slides to effectively help you save your valuable time. They are readymade to fit into any presentation structure.


FAQs for Monthly business analysis
You've gotta get good at breaking down messy problems and spotting trends in data - that's the bread and butter stuff. Communication is huge too since you're basically a translator between the tech people and everyone else. Requirements gathering sounds boring but it's actually pretty critical. Oh, and learn some SQL or at least get solid with Excel. Project management basics don't hurt either. But honestly? Stay curious. The analysts who just crush it are the ones always asking "what if we tried this instead" or digging into why something works the way it does.
Oh totally, BA methods change depending on your industry. Healthcare is brutal with all the HIPAA stuff - you're drowning in documentation. Financial services? Risk assessments everywhere. Tech companies love their agile sprints and constant pivoting (honestly the most fun environment IMO). Manufacturing sticks to lean principles and process optimization. Retail's all about mapping customer journeys and dealing with crazy seasonal swings. Your core BA skills transfer, but you've got to adjust your tools and timeline expectations. Each industry has its own regulatory headaches and stakeholder quirks you'll need to navigate.
Look, proper business analysis is a game changer for project success. It helps you nail down requirements from the start so everyone's on the same page. Catches scope creep before it kills your timeline. I've watched way too many projects crash because teams just dove in without doing this groundwork first - it's painful to see honestly. Requirements workshops are clutch for figuring out what actually matters vs what sounds cool. Regular stakeholder check-ins keep things from going sideways. Try it on your next project and you'll wonder why you didn't do this sooner.
Honestly, stakeholder engagement makes or breaks everything you do as a BA. First thing - map out everyone who cares about this project early on. Then dig into what they actually need and what's driving them crazy right now. Here's the thing though: don't just collect requirements once and vanish. That's a recipe for disaster. You've gotta keep checking back with people, making sure you're still on track. I learned this the hard way when I built something perfect... for nobody. Regular check-ins with each group will save your sanity later.
Honestly, data analytics just makes everything so much clearer when you're trying to figure out what's actually happening in your business. No more guessing about customer behavior or whether your ideas will work - you've got real patterns to back up your decisions. I've seen people discover opportunities they never would've spotted just by looking at the numbers. Plus you can actually track if your changes made a difference later on. My advice? Pick one thing you're unsure about and find whatever data might help answer it. You'll probably be surprised by what comes up. Way better than flying blind, trust me.
Definitely send the agenda ahead of time - saves you from explaining everything twice. Ask stuff like "walk me through how you do this now" rather than yes/no questions that kill the conversation. Keep it to 5-7 people max or it gets messy fast. Honestly, a whiteboard or shared screen is your best friend here. People get way more engaged when they can see things mapped out. Have someone else take notes so you're not frantically scribbling while trying to facilitate. Don't solve anything during the session - that's a rookie mistake I made early on. Just capture everything first. Send the summary within 24 hours while it's all still fresh.
Look, first thing - figure out what actually matters for the business and what's just noise. Some stakeholders get super worked up over features that honestly won't change anything. Map everything against your main goals to see what drives real value. Get the conflicting people in a room and hash it out. Usually there's some middle ground if you dig deep enough. Write down your reasoning so nobody forgets why you made certain calls later. The trick is being upfront about how you'll decide stuff from the start. That way when the next fire drill happens, people already know your process.
Start with whatever your company already has - saves you the headache of getting approvals later. Visio's the go-to for flowcharts and process maps. Lucidchart's pretty solid too if you're doing everything cloud-based. Excel might seem basic but pivot tables are actually insane for data analysis - same with Google Sheets. If you're working agile, Jira or Azure DevOps handle requirements really well. Power BI and Tableau are your friends when you need to make data look impressive for stakeholders. Honestly, I'd just pick based on what projects you're tackling first.
You know, business analysis is like the foundation for any change management project that doesn't completely blow up. Map out what you're doing now, spot the problems, then figure out where you want to end up. Stakeholder analysis and process modeling - boring but so worth it. They give you actual data to get people on board instead of just hoping for the best. I swear, half the failed projects I've seen could've been saved with better upfront analysis. Document everything about your current state first (I know, tedious) but trust me, you'll thank yourself later when things get messy.
Track delivery stuff first - requirements quality, stakeholder happiness, timeline hits. That's the easy part though. What really matters is outcome metrics: did users actually adopt it? Is there real ROI? Did you solve the original problem or just create fancy documentation? I used to obsess over delivery metrics until I realized nobody cares if you delivered on time if the solution sucked. Set up tracking from day one and review quarterly. Oh, and don't skip post-implementation reviews - that's where you'll learn what actually worked.
Oh man, cultural stuff totally throws off BA work if you're not careful. Some people are brutally direct, others drop hints you'll completely miss. Japan taught me that lesson the hard way! Time perspectives are wild too - certain cultures want results yesterday while others think in decades. Decision-making processes? Completely different depending where you are. Hierarchy matters way more in some places than others, which changes how you gather requirements and who you actually need to talk to. Honestly, just do your homework on the culture beforehand and adjust your approach. Saves so much headache later.
Dude, AI and machine learning are totally changing requirements gathering - automated pattern recognition and predictive analytics are becoming must-haves. Low-code platforms let you prototype crazy fast now. Cloud analytics give you real-time insights that used to take forever. Everyone's going nuts for data visualization too, which honestly makes sense. But here's the cool part - process mining actually shows you how workflows really work versus what people claim happens. Night and day difference sometimes. I'd mess around with these tools on smaller projects first so you're not behind the curve later.
Dude, just ditch all the tech jargon and talk about what actually matters to them - money, deadlines, goals. I always use analogies that make sense, like comparing data flow to how their supply chain works. Honestly, visuals save my butt every time - nothing beats a simple diagram. Test your explanation on someone who doesn't work in tech first. That's been a game changer for me. If you can't connect it to their bottom line or something they actually care about, you're going too deep into the weeds. Keep it simple and always circle back to business impact.
Oh dude, you and UX designers should totally be besties! You're both trying to figure out what users actually need, just from different sides. You handle the "what should this thing do" part while they tackle "how do people interact with it." Your requirements work basically sets them up for success with their research and design stuff. Getting together early saves you both from those nightmare scenarios where dev finds major usability problems later. Honestly, bring your UX person to stakeholder meetings - they'll catch interaction stuff that completely flies over your head.
Dude, you're actually sitting pretty as a BA for this stuff. You see how everything connects across the company, right? That's huge. Take all those process gaps you find and spin them into strategic opportunities instead. All that stakeholder data you're constantly collecting? Pure gold for strategy work. Here's the thing though - don't pitch it as "process improvements." Frame everything around money. Revenue gains, cost cuts, beating competitors. That's what executives actually care about. Your analysis can literally drive where the company goes next year. It's kind of wild how much influence BAs can have if they position things right.
-
Wonderful templates design to use in business meetings.
-
Excellent template with unique design.
-
Designs have enough space to add content.
-
Very well designed and informative templates.
-
Unique design & color.