


Monthly Business Review Powerpoint Presentation Slides


Try Before you Buy Download Free Sample Product
 Impress Your
 Audience
Editable
of Time


Increase the impact of the joke with our Monthly Business Review Powerpoint Presentation Slides. Enhance it with comical images.
People who downloaded this PowerPoint presentation also viewed the following :
Content of this Powerpoint Presentation
Slide 1: This slide introduces Monthly Business Review. State Your Company Name and begin.
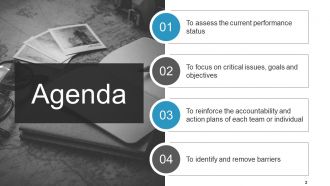
Slide 2: This is an Agenda slide. Some examples of agendas are- To assess the current performance status, To focus on critical issues, goals and objectives, To reinforce the accountability and action plans of each team or individual, To identify and remove barriers.
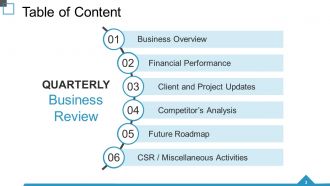
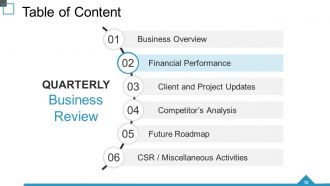
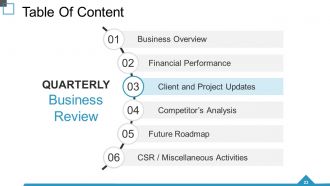
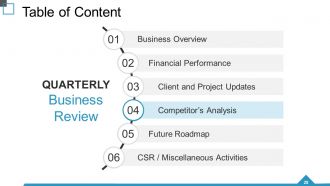
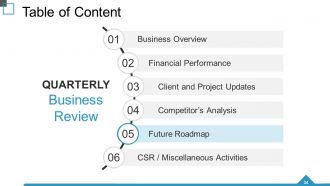
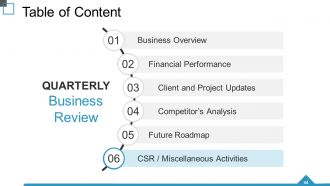
Slide 3: This slide shows the Table of Content. The contents are- Business Overview, Financial Performance, Client and Project Updates, Competitor’s Analysis, Future Roadmap, CSR / Miscellaneous Activities, QUARTERLY Business Review.
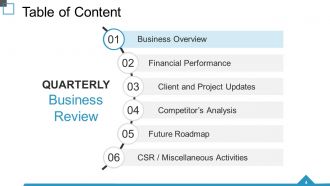
Slide 4: This slide continues the Table of Content. The contents are- Business Overview, Financial Performance, Client and Project Updates, Competitor’s Analysis, Future Roadmap, CSR / Miscellaneous Activities, QUARTERLY Business Review.
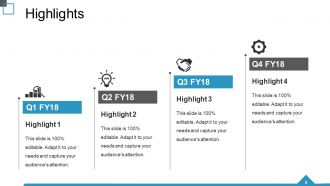
Slide 5: This slide presents Highlights for four quarters.
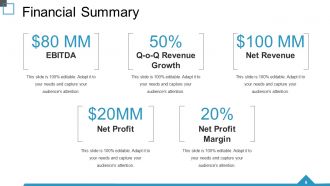
Slide 6: This slide showcases Financial Summary. The constituents are- EBITDA, Q-o-Q Revenue Growth, Net Revenue, Net Profit, Margin, Net Profit.
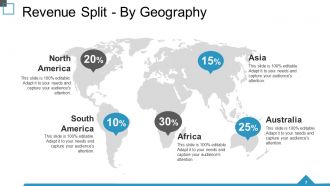
Slide 7: This slide showcases Revenue Split - By Geography on a world map image.
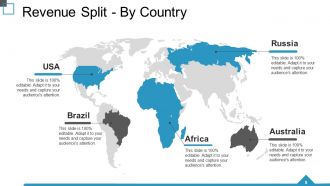
Slide 8: This slide showcases another variation of Revenue Split - By Geography on a world map image.
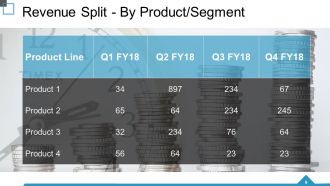
Slide 9: This slide presents Revenue Split - By Product/Segment in table form.
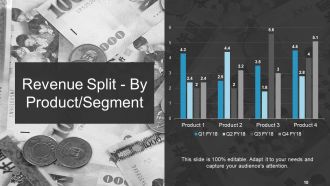
Slide 10: This slide presents Revenue Split - By Product/Segment in graph form.
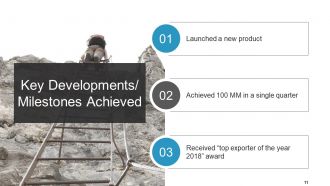
Slide 11: This slide presents Key Developments/ Milestones Achieved with the following content- Launched a new product, Achieved 100 MM in a single quarter, Received “top exporter of the year 2018” award.
Slide 12: This slide presents Table of Content of Quartrely Business Review. The content included is- Business Overview, Financial Performance, Client and Project Updates, Competitor’s Analysis, Future Roadmap, CSR / Miscellaneous Activities, Quarterly Business Review.
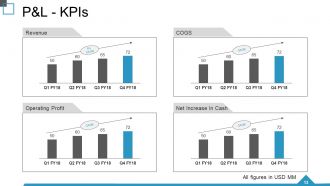
Slide 13: This slide presents graphs on P&L - KPIs with the subheadings- Revenue, Operating Profit, Net Increase In Cash.
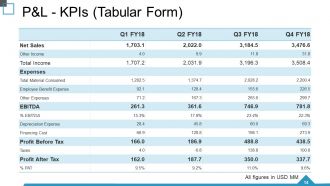
Slide 14: This slide presents P&L - KPIs in tabular form.
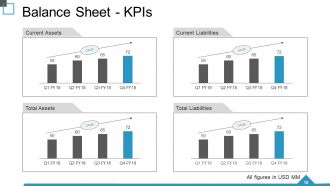
Slide 15: This slide shows the Balance Sheet - KPIs. The included subheadings are- Current Assets, Total Assets, Current Liabilities, Total Liabilities.
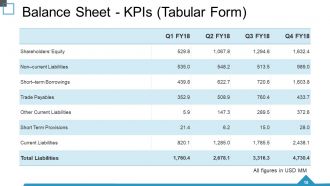
Slide 16: This slide shows the Balance Sheet - KPIs in tabular form.
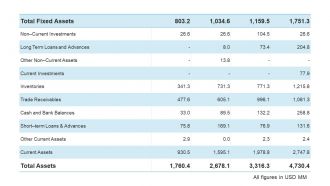
Slide 17: This slide presents Total Fixed Assets in tabular form.
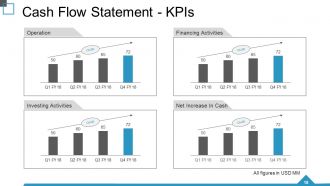
Slide 18: This slide shows Cash Flow Statement - KPIs in graph form. The constituents include- Operation, Investing Activities, Financing Activities, Net Increase In Cash.
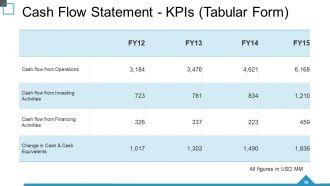
Slide 19: This slide presents Cash Flow Statement - KPIs in Tabular Form.
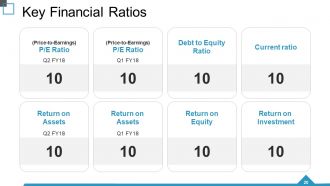
Slide 20: This slide presents Key Financial Ratios with the following points- P/E Ratio, Debt to Equity Ratio, Current ratio, Return on Assets, Return on Equity, Return on Investment.
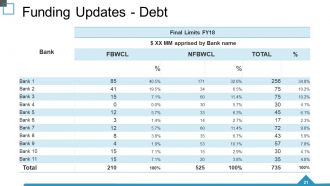
Slide 21: This slide showcases Funding Updates - Debt table.
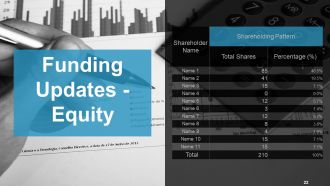
Slide 22: This slide showcases Funding Updates - Equity table.
Slide 23: This slide shows Table Of Content for Quarterly Business Review. The points are- Business Overview, Financial Performance, Client and Project Updates, Competitor’s Analysis, Future Roadmap, CSR / Miscellaneous Activities.
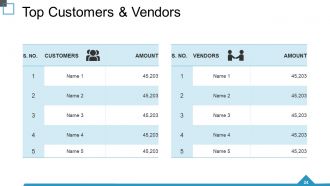
Slide 24: This slide presents Top Customers & Vendors table.
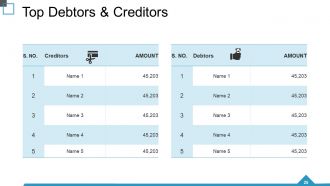
Slide 25: This slide presents Top Debtors & Creditors table.
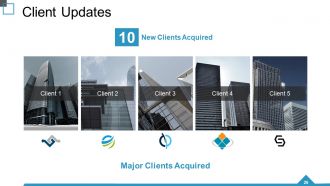
Slide 26: This slide shows Client Updates with the main subheadings- New Clients Acquired, Major Clients Acquired.
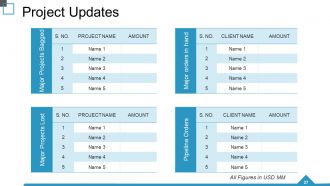
Slide 27: This slide presents Project Updates table.
Slide 28: This slide presents Quarterly Business Review with Table Of Content. The points are- Business Overview, Financial Performance, Client and Project Updates, Competitor’s Analysis, Future Roadmap, CSR / Miscellaneous Activities.
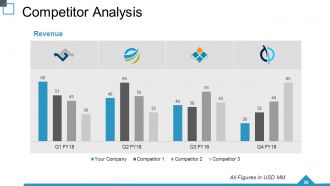
Slide 29: This slide presents Competitor Analysis with Revenue for four quarters.
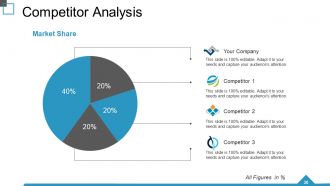
Slide 30: This slide shows Competitor Analysis with Your company and Competitor.
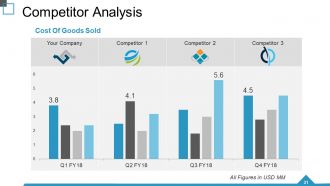
Slide 31: This slide shows Competitor Analysis showing Cost of Goods sold.
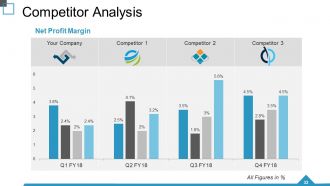
Slide 32: This slide presents Competitor Analysis showing Net Profit Margin.
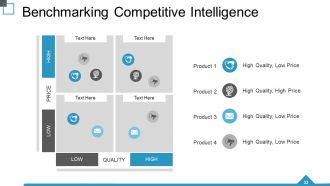
Slide 33: This slide presents Benchmarking Competitive Intelligence Matrix in terms of Quality and High-Low parameters.
Slide 34: This slide displays Table of Content for Quarterly Business Review with the following points- Business Overview, Financial Performance, Client and Project Updates, Competitor’s Analysis, Future Roadmap, CSR / Miscellaneous Activities.
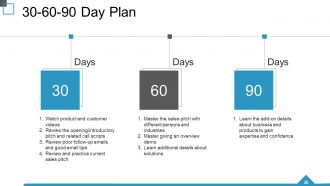
Slide 35: This slide presents a 30-60-90 Day Plan.
Slide 36: This slide presents a Light Bulb With Time Planning Ideas. State them here.
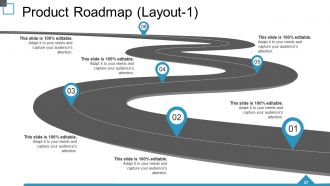
Slide 37: This slide presents a Product Roadmap. State milestones etc. here.
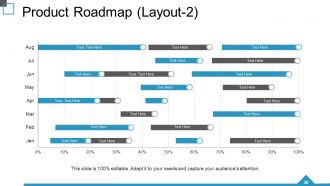
Slide 38: This slide presents a Product Roadmap in Swimlane form. State milestones etc. here.
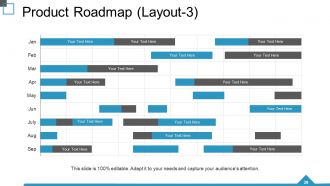
Slide 39: This slide also presents a Product Roadmap in Swimlane form. State milestones etc. here.
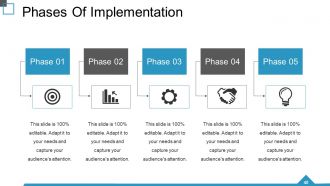
Slide 40: This slide shows Phases Of Implementation. State phases here.
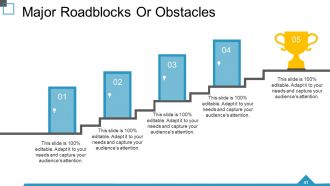
Slide 41: This slide showcases Major Roadblocks Or Obstacles with relevant imagery and text boxes to go with.
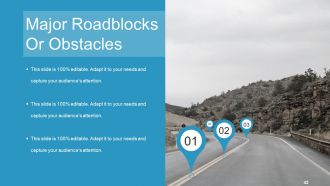
Slide 42: This slide shows Major Roadblocks Or Obstacles in another variation.
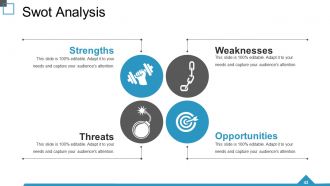
Slide 43: This slide shows a Swot Analysis with imagery and text boxes.
Slide 44: This slide showcases Table of Content for Quarterly Business Review. The contents are- Business Overview, Financial Performance, Client and Project Updates, Competitor’s Analysis, Future Roadmap, CSR / Miscellaneous Activities.
Slide 45: This slide presents Corporate Social Responsibility to be stated.
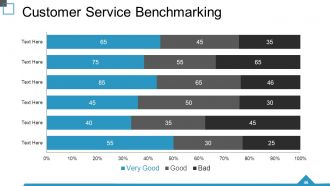
Slide 46: This slide shows Customer Service Benchmarking in terms of Very Good, Good, Bad in graph form.
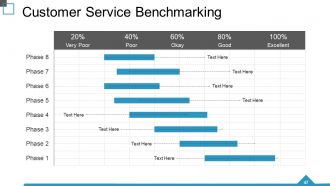
Slide 47: This slide shows another variation of Customer Service Benchmarking in terms of Very Good, Good, Bad.
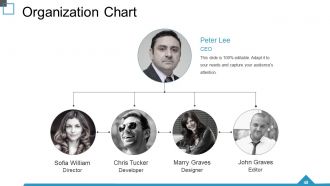
Slide 48: This slide shows an Organization Chart with name, designation and image boxes in hierarchy form.
Slide 49: This slide showcases Goals And Success Metrics in hierarchy form.
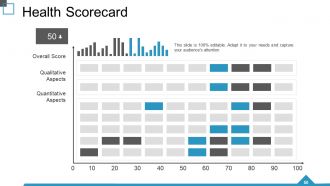
Slide 50: This slide displays a Health Scorecard. Overall Score, Qualitative Aspects, Quantitative Aspects.
Slide 51: This is a Coffee Break slide to halt. You can change the slide content as per need.
Slide 52: This slide is titled Charts & Graphs for moving forward.
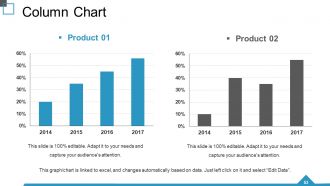
Slide 53: This is a Column Chart slide for product/entity comparison.
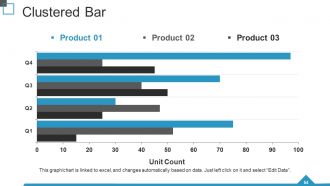
Slide 54: This is a Clustered Bar slide for product/entity comparison.
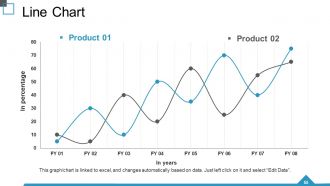
Slide 55: This is a Line Chart slide for product/entity comparison.
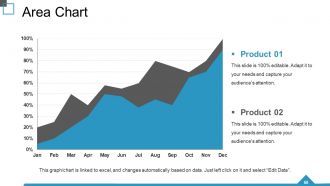
Slide 56: This is an Area Chart slide for product/entity comparison.
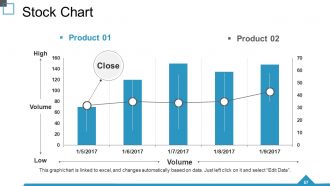
Slide 57: This is a Stock Chart slide for product/entity comparison.
Slide 58: This slide is titled Additional Slides to proceed forward. You can change the slide content as per need.
Slide 59: This is Our Mission slide displaying Vision, Mission and Goals.
Slide 60: This is an About Us slide. State company/team specifications here.
Slide 61: This is Our Team slide with name, designation and image box to go with.
Slide 62: This is a Dashboards slide to display Kpi, metrics etc.
Slide 63: This is a Post it slide to show events, important notes etc.
Slide 64: This is a Puzzle image slide to show information, specifications etc.
Slide 65: This is a Target slide to show targets, goals etc.
Slide 66: This is a Circular image slide to show information, specifications etc.
Slide 67: This is a Lego image slide to show information, specifications etc.
Slide 68: This is a Venn Diagram image slide to show information, specifications etc.
Slide 69: This is a Mind Map image slide to show information, specifications etc.
Slide 70: This is a Silhouettes image slide to show people related information, specifications etc.
Slide 71: This is a Magnifying Glass image slide to show information, specifications etc.
Slide 72: This is a Thank You slide with Address# street number, city, state, Email Address, Contact numbers.
Monthly Business Review Powerpoint Presentation Slides with all 72 slides:
Our Monthly Business Review Powerpoint Presentation Slides team believe in being facilitating. They do their best to make it easy for you.


FAQs for Monthly Business Review
For your MBR, definitely cover the big four: revenue, customer metrics, ops efficiency, and team updates. Month-over-month and year-over-year comparisons are crucial - execs eat that stuff up. Don't skip customer acquisition costs, churn, and pipeline health either. Context matters huge, so call out any major wins or roadblocks that actually impacted your numbers. Honestly, I've seen too many reports that just dump data without explaining the "why" behind it. Focus your slides on what genuinely moved things forward this month. Oh, and come with 2-3 specific asks for leadership so you're driving action, not just presenting numbers.
Trust me, charts and graphs are game-changers for your MBR. Nobody wants to dig through spreadsheet hell when they could spot trends instantly with good visuals. Dashboards work great for showing KPIs upfront. Before/after comparisons really drive your progress home too. Oh, and infographics make complex stuff way easier to follow. Color-coding saves lives – I swear by the red/yellow/green thing for status updates. Just don't go overboard with fancy effects. Clean visuals that actually support your main points? That's what keeps people engaged instead of mentally checking out halfway through.
Dude, make it interactive! Ask questions and get people talking - even awkward silence is better than glazed-over faces. I like rotating who presents different sections so everyone stays awake (and honestly, spreads out the work). Skip the boring charts and use real customer stories instead. Oh, and don't try to cover everything in one meeting - people totally check out. The whole point is making everyone feel heard, not just sitting there while leadership drones on. Short discussions after each section work way better than one giant presentation dump.
Yeah, so basically you gotta tailor everything to who's gonna read it. Executives just want the big picture stuff - KPIs, major wins, anything they need to make decisions on. Department heads? They want more detail about their specific areas plus how it affects other teams. Your actual team members need all the granular metrics and what they're supposed to do next. Honestly, I just make one big version then copy different chunks for each group. Way easier than starting from scratch every time. The trick is figuring out what each person actually cares about and can do something about. I'd ask each stakeholder what updates they find most useful - saves you from guessing.
Honestly, the worst thing you can do is just blast people with a ton of charts and numbers without explaining what any of it actually means. Like, cool graph bro, but what does this mean for our business? Also don't try to paint everything as sunshine and rainbows - people can smell BS from a mile away. Show the problems too and what you're doing to fix them. Oh, and don't make it all about looking backwards at what already happened. Sure, celebrate the wins, but spend time on what's next. Balance is everything here.
Honestly, your past data is like having cheat codes for marketing. I used to wing everything until I realized the numbers don't lie - they show you what's actually crushing it vs what just looks pretty on paper. Grab your conversion rates and customer acquisition costs from the last few months. Seasonal patterns will jump out at you too, which is super helpful for planning ahead. Pick your top 3 metrics from last quarter and see what they're saying. Double down on whatever's working and ditch the stuff that's bleeding money. Trust me, it's way better than guessing your way through campaigns.
Honestly, storytelling makes your MBR way more memorable than just dumping numbers on people. Six months later, you'll remember the narrative, not some random spreadsheet cells. Structure it like any good story - here's the setup, here's what went wrong, here's how we fix it. Pick one metric that moved significantly and explain why. Was it the new product launch? Market conditions? That competitor who undercut pricing? People connect with stories way better than data points. Your execs will actually retain what you're saying instead of zoning out during slide 12.
Definitely shoot out a summary email within a day or two - don't let people forget what was decided. List out who's doing what and by when. Tables are honestly a lifesaver for this stuff, way easier to read than paragraphs. Also mention any updates from old action items, especially if deadlines got pushed or someone new took over. Being super clear upfront saves you from those annoying "oh I didn't realize" conversations later. CC the managers too and keep it all in the same email thread so there's a trail.
Dude, just get Tableau or Power BI set up first - they'll pull all your metrics automatically so you're not doing spreadsheet hell every month. Google Slides works fine for templates too, nothing fancy needed. Honestly, I've watched people burn entire afternoons making things look pretty when the numbers are what actually matter. Miro's solid for brainstorming with your team in real time. The biggest win though? Connect your CRM directly to whatever dashboard you pick. Way less manual work. Oh and don't try to build everything at once - pick one dashboard this month and go from there.
Build a template with the same KPIs and format every month - that's your baseline. Everyone needs to use identical definitions too (revenue recognition gets weird when different teams interpret it their own way). Pick someone to be the template police who checks everything before it goes out. Deadlines are non-negotiable because late stuff messes up the whole flow. Oh, and do quarterly calibration sessions where you go through old MBRs with your team. Honestly, that's where you'll catch most of the inconsistencies that creep in over time. Works way better than you'd think.
When I dig into MBR data, I always start with three buckets. Revenue patterns are obvious but crucial - check month-over-month and year-over-year for seasonal stuff or growth spurts. Then dive into operational metrics: customer acquisition costs, churn rates, conversion funnels. That's where you'll find what's actually driving those revenue numbers. Leading indicators are huge too - pipeline health, market share changes, customer satisfaction scores. Honestly depends on your industry, but I'd start by spotting which metrics jumped significantly from last month. Then just keep asking "why" until you hit the real root cause. Works every time.
Here's the thing - you gotta actually close that feedback loop or it's pointless. Give each action item from your MBR a specific owner and deadline. Track everything in a shared doc so people can't hide. Then (this is crucial) follow up next month to see what actually happened. Otherwise you're just having meetings about having meetings, which is my personal hell. Split your feedback into quick wins vs bigger changes - knock out the easy stuff first to build momentum. Oh, and do quarterly check-ins on how well your feedback process is working. Sounds meta but it helps.
Get those action items locked down within 48 hours while people still remember what you talked about. I always shoot over a quick email with the biggest 3-5 takeaways and who's doing what by when. Then I literally put 15-minute check-ins on people's calendars - otherwise this stuff just dies in their inbox, trust me. Make sure your next MBR agenda has a progress update section so nothing vanishes. The magic trick? Each insight needs an actual person's name attached to it, not some vague "the team will look into this" nonsense.
Look, benchmarking gives your MBR actual context instead of staring at numbers that mean nothing. That 15% growth you're celebrating? Maybe everyone else hit 25% and you're actually behind. It helps spot where competitors are killing it while you're not even paying attention to those metrics - which honestly happens more than we'd like to admit. The real win is turning your MBR from a boring report-fest into something strategic. Pick 3-5 metrics your industry actually cares about and find decent benchmark sources. Makes all the difference.
Keep it to 15-20 slides tops - that's roughly 30-45 minutes. Trust me, I've sat through those brutal 2+ hour MBRs where everyone's checking their phones by minute 60. Nobody wants that. Hit the big stuff: key metrics, major wins, any blockers that need executive input, and what's coming next month. Skip all the granular details - people can always ask questions later if they want to dig deeper. Honestly, your executives will thank you way more for keeping things tight and focused. The whole point is getting everyone aligned strategically, not drowning them in every single data point you've got.
-
Amazing product with appealing content and design.
-
Commendable slides with attractive designs. Extremely pleased with the fact that they are easy to modify. Great work!