


Monthly Marketing Performance Report Powerpoint Presentation Slides


Try Before you Buy Download Free Sample Product
 Impress Your
 Audience
Editable
of Time


Making a monthly marketing PPT presentation that is having fair amount of text and contemporary design is very tough job. So, to address this our team has come up with a 58 slides ready-made Monthly Marketing Performance Report Powerpoint Presentation Slides PPT deck for marketing companies and teams to highlight compelling performance activities. To make it easier for you this PPT presentation deck sample has slides like monthly marketing calendar, sales performance reporting, sales by region, product wise performance, key financials, marketing roadmap, website performance review, search engine rankings, organic visits and backlinks, new customer by source, website update plan, email marketing report and performance chart, monthly pipeline and many more. Furthermore, our PPT show will help you to shed spotlight on the marketing plans for the month. Best part is that you can use this PowerPoint show to share business as well as market information with your management. In addition, there are slides designs like our mission, our team. Timeline, bar graph, etc. Simply download our Monthly Marketing Performance Report Powerpoint Presentation Slides and showcase the importance of marketing and related topics. Our Monthly Marketing Performance Report Powerpoint Presentation Slides evoke a feeling of absolute confidence. You will appear cool and casual.
People who downloaded this PowerPoint presentation also viewed the following :
Content of this Powerpoint Presentation
Slide 1: This slide introduces Monthly Marketing Performance Report. State Your Company Name and begins.
Slide 2: This slide showcases Agenda. You can add the company agenda and use it.
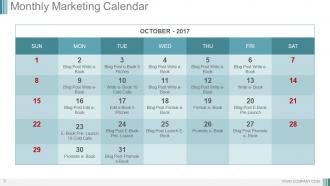
Slide 3: This slide presents Monthly Marketing Calendar.
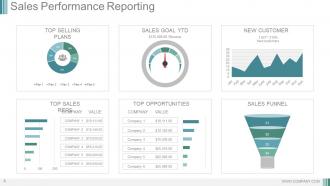
Slide 4: This slide showcases Sales Performance Reporting.
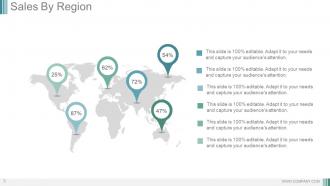
Slide 5: This slide shows Sales By Region.
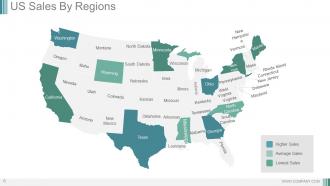
Slide 6: This slide showcases US Sales By Regions.
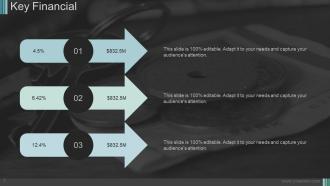
Slide 7: This slide presents Key Financial with three of the points with percentage you can use.
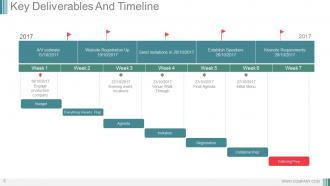
Slide 8: This slide showcases Key Deliverables And Timeline with the the week wise discription.
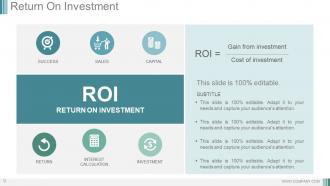
Slide 9: This slide presents Return On Investment.
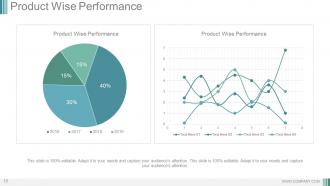
Slide 10: This slide showcases Product Wise Performance.
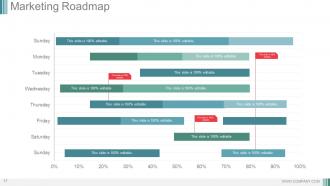
Slide 11: This slide shows Marketing Roadmap with further you can add the steps and stages of the marketing.
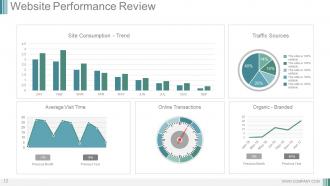
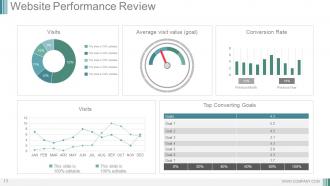
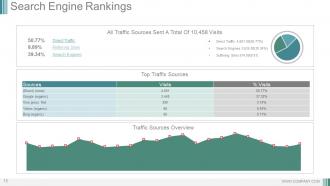
Slide 12: This slide showcases Website Performance Review.
Slide 13: This slide presents Top Converting Goals.
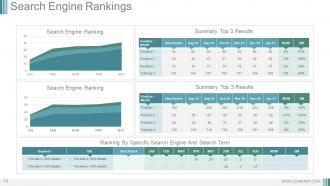
Slide 14: This slide shows Search Engine Rankings with some of the parameters.
Slide 15: This slide presents Search Engine Rankings. Use it for the top traffuc sources and for adding the overview.
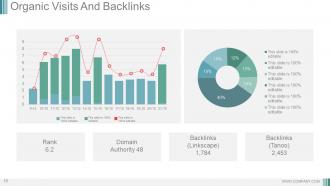
Slide 16: This slide showcases Organic Visits And Backlinks.
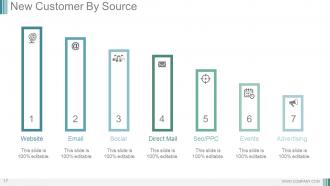
Slide 17: This slide presents New Customer By Source with different types of the sources we have taken.
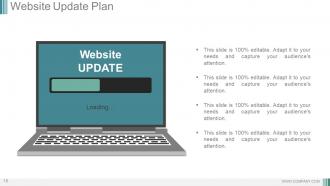
Slide 18: This slide showcases Website Update Plan. You can add as per your requirement.
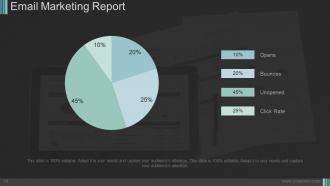
Slide 19: This slide shows Email Marketing Report. You can add the percentage as per your need.
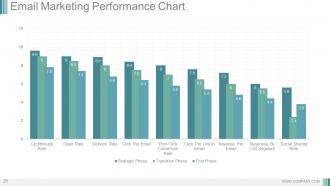
Slide 20: This slide presents Email Marketing Performance Chart. With which you can add the data and use it.
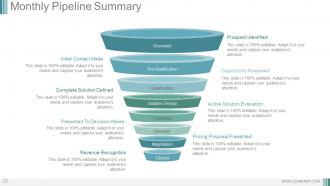
Slide 21: This slide showcases Monthly Pipeline Summary. You can add the content and use it as per your requirement.
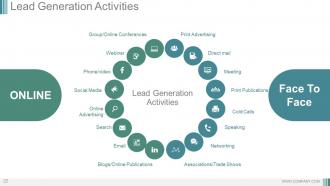
Slide 22: This slide shows Lead Generation Activities.
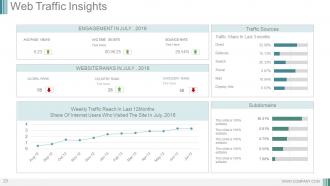
Slide 23: This slide showcases Web Traffic Insights. With these dashboard you can add the different factors.
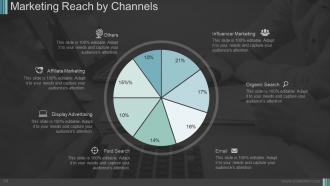
Slide 24: This slide presents Marketing Reach by Channels.
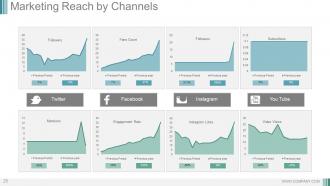
Slide 25: This slide showcases Marketing Reach by Channels. You can add the data and use it.
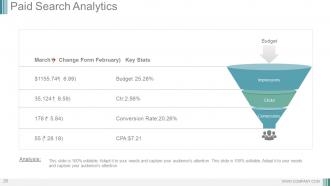
Slide 26: This slide presents Paid Search Analytics.
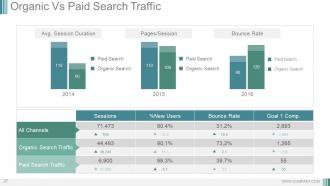
Slide 27: This slide showcases Organic Vs Paid Search Traffic.
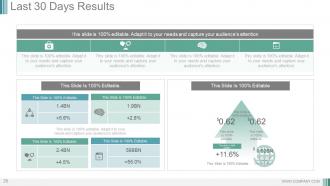
Slide 28: This slide shows Last 30 days results. You can use as per you want.
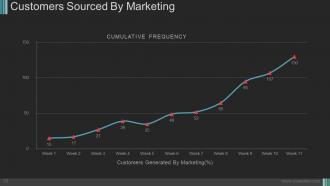
Slide 29: This slide presents Customers Sourced By Marketing graph which further shows the weekly data.
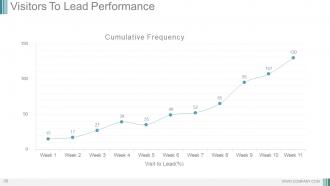
Slide 30: This slide showcases Visitors To Lead Performance.You can use as per your requirement.
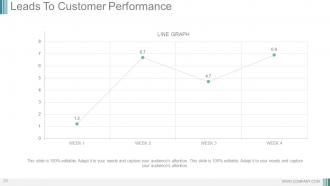
Slide 31: This slide shows Leads To Customer Performance chart and use it for your own use.
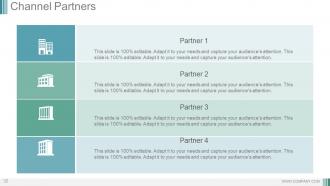
Slide 32: This slide presents Channel Partners. You can add the partners and use it as per your requirement.
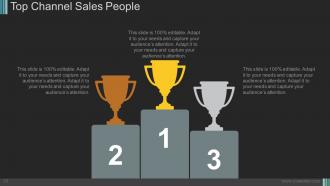
Slide 33: This slide showcases Top Channel Sales People with the three of the position we have shown.
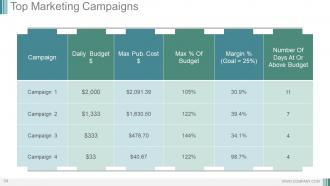
Slide 34: This slide shows Top Marketing Campaigns with different campaigns. Add as per your requirement.
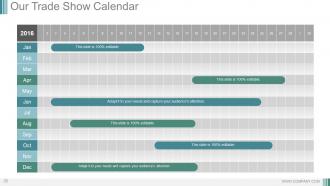
Slide 35: This slide presents Our Trade Show Calendar.
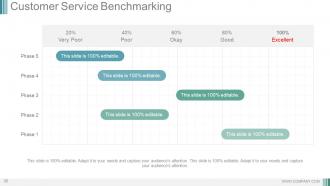
Slide 36: This slide showcases Customer Service Benchmarking with different phases and different levels.
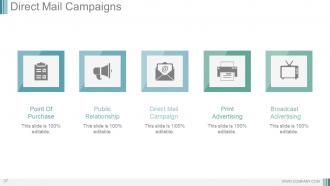
Slide 37: This slide presents Direct Mail Campaigns with these five parameters- Point Of Purchase, Public Relationship, Direct Mail Campaign, Print Advertising, Broadcast Advertising.
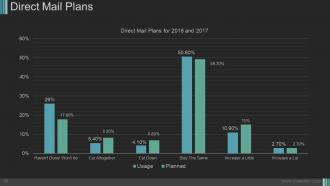
Slide 38: This slide showcases Direct Mail Plans with some of the graphical representation.
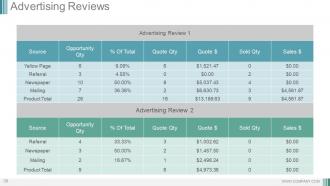
Slide 39: This slide presents Advertising Reviews.
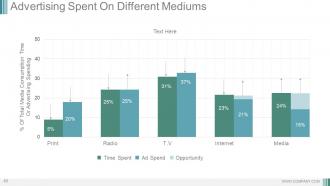
Slide 40: This slide shows Advertising Spent On Different Mediums with advertising review.
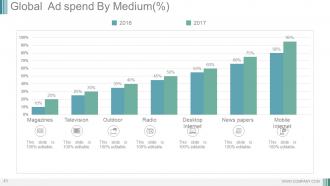
Slide 41: This slide presents Global Ad spend By Medium(%) with these of the parameters- Magazines, Television, Outdoor, Radio, Desktop Internet, News papers, Mobile Internet.
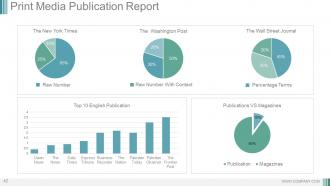
Slide 42: This slide showcases Print Media Publication Report Top 10 English Publication, Publications VS Magazines, Raw Number, Raw Number With Context, Percentage Terms.
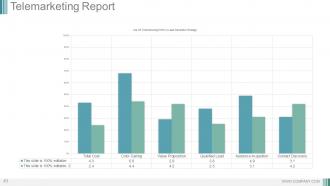
Slide 43: This slide presents Telemarketing Report with some of the parameters.
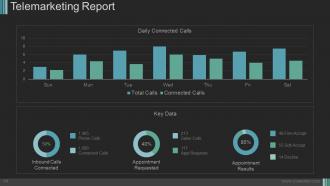
Slide 44: This slide shows Telemarketing Report with some of the factors.
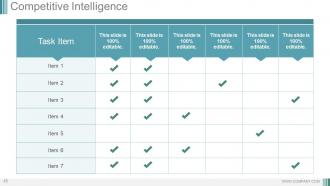
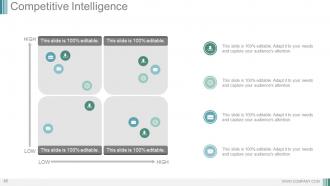
Slide 45: This slide showcases Competitive Intelligence. You can add the task and make it usable for your own company.
Slide 46: This slide presents Competitive Intelligence. You can add the data and use it for the your own use.
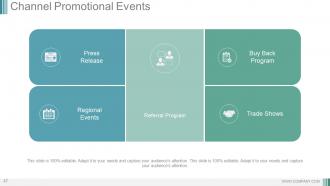
Slide 47: This slide shows Channel Promotional Events with these five factors- Press Release, Regional Events, Buy Back Program, Trade Shows, Referral Program.
Slide 48: This slide presents Case Study. You can add your information and use it accordingly.
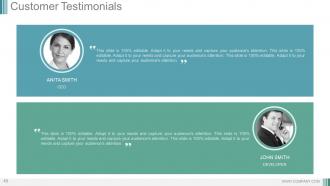
Slide 49: This slide showcases Customer Testimonials.
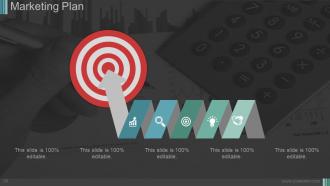
Slide 50: This slide presents Marketing Plan. Add the required content and use it.
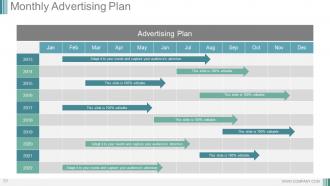
Slide 51: This slide showcases Monthly Advertising Plan.
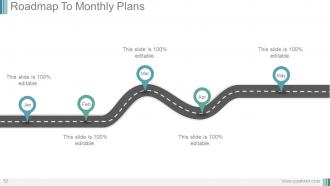
Slide 52: This slide Roadmap To Monthly Plans
Slide 53: This slide is titled Additional Slides.
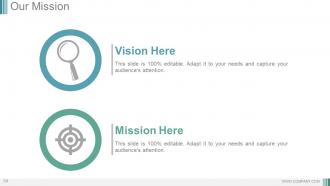
Slide 54: This is a Vision, Mission and Goals slide. State them here.
Slide 55: This is an Our Team slide with name, image&text boxes to put the required information.
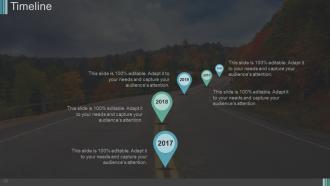
Slide 56: This is a Timeline slide to show milestones, growth or highlighting factors.
Slide 57: This is a Bar Graph image slide to show product comparison, growth etc.
Slide 58: This is a Thank You slide for acknowledgement.
Monthly Marketing Performance Report Powerpoint Presentation Slides with all 58 slides:
Our Monthly Marketing Performance Report Powerpoint Presentation Slides are an ideal cost cutting device. Bring down expenses at the first instance.


FAQs for Monthly Marketing Performance Report
Focus on metrics that actually connect to your business goals. Traffic, leads, conversion rates at each funnel stage - that stuff matters. Customer acquisition cost and ROAS for paid campaigns too. Revenue attribution is huge because you need to show which channels drive real sales, not just pretty vanity numbers (though honestly, your boss will probably still want to see impressions). Social engagement and email performance should be in there as well. Here's the thing - keep it simple. Pick maybe 8-10 core KPIs max so each one actually tells part of your story. Build a dashboard template you can just update monthly.
Line charts are perfect for tracking month-over-month stuff like leads or website traffic - you'll spot trends way easier. For comparing different campaigns, bar charts are clutch. God, I hate when people use messy pie charts that make zero sense! Stick with the same colors throughout and always call out the main takeaway. Oh, and definitely add little notes explaining any weird spikes - like if you ran a big campaign that week. Makes the data actually tell a story instead of just sitting there looking pretty.
Honestly just start with Google Analytics and Data Studio - they're free and cover most of what you need for web stuff. HubSpot's reports look really clean if you're using them already. Social metrics? Hootsuite or Sprout Social work great. Excel is still my go-to for combining everything though (I know, I know, very exciting). Tableau's nice if you want to get fancy. But seriously, don't overthink it - begin with Google's free tools and see what your boss actually wants to look at. You can always add more later once you figure out which numbers they obsess over.
Okay so first thing - figure out where you totally missed the mark compared to what you wanted to hit. Those are your big focus areas. I always notice patterns too, like email open rates tanking mid-month (people get so overwhelmed and just start mass-deleting stuff, it's brutal). Don't just say "get better at social media" though. Be crazy specific: "boost Instagram engagement from 2.1% to 3% by doing 2 extra Reels each week." The key is picking stuff you can actually measure easily. Otherwise you'll be back here next month going "um, I think it went okay?"
Honestly, don't freak out over one bad month - I've watched too many people do that and make terrible decisions. You really need 3-6 months of data to see actual trends worth acting on. Look at engagement rates too, not just conversions. Those vanity metrics are tempting but pretty useless tbh. Also remember that seasonality and market stuff can totally mess with your results, so don't assume your latest campaign caused everything. Always compare against previous periods and industry benchmarks before you panic and pivot your whole strategy.
Break it down by platform first - show follower growth, engagement rates, all that good stuff. Click-through rates to your website are huge since that's where people actually convert. Then roll everything up to show how social's doing overall vs your goals. Charts work way better than dumping a bunch of numbers in tables, trust me on that. Oh and definitely add little notes about why certain metrics spiked or tanked that month. Makes it so much easier for everyone to scan and actually understand what's happening. Nobody wants to dig through endless data.
Honestly, customer feedback should totally drive what you put in those monthly reports. Like if people keep complaining about email frequency but love the content, start tracking that stuff religiously. I always throw in actual customer quotes too - gives the executives something real to chew on instead of just boring charts. The trick is letting their voices tell you which metrics actually matter, you know? Don't just measure what's convenient. Oh and sentiment scores are clutch for context. Makes the whole report way more compelling when you're showing the "why" behind the numbers, not just random data points.
First thing - figure out what's actually tanking. Which channels sucked? What content bombed? Where are you just burning money for nothing? Once you've got that sorted, move your budget to whatever's working. Social crushed it but email was trash? Put more there. I know it stings when your pet project fails, but the numbers don't care about your feelings lol. Don't panic over one bad month though - look at 2-3 months of data for real patterns. Pick maybe 2-3 changes to test next month based on what you find, then actually track if they help.
Dude, you gotta check what your competitors are doing or you're totally guessing. Like, you might think your 5% conversion rate is solid until you find out everyone else is crushing it at 12%. I learned this the hard way last year - thought my Facebook ads were just having a bad month, turns out the whole industry was doing way better. Track their engagement rates, how much buzz they're getting, campaign stuff like that. Honestly, just pick 2-3 main competitors and check their numbers monthly. You'll spot what you're missing pretty quick.
Monthly reports work best for marketing performance stuff. I learned the hard way that weekly updates just annoy people - they'll start ignoring your emails. Quarterly? Way too long. Issues pile up and nobody sees them coming. Monthly hits that sweet spot where you've got real data to work with, not just random noise. Pick a consistent day though, like first Tuesday or whatever works. That way people actually expect it. Oh, and here's something that actually helps - send a quick summary line in the email with the full report attached. Most execs won't read everything anyway, but they'll scan your highlights.
So for monthly SEO reports, I'd go with a dashboard first - organic traffic, rankings, CTR stuff with visual charts. Tables work well for your top pages and whether they're gaining or losing traffic. Competitor data is clutch because clients eat that up honestly. Technical health metrics like page speed and crawl errors should get their own section. Oh, and definitely include any new keyword opportunities you found. The key thing? Tie everything back to actual revenue when you can swing it.
So basically take your total campaign revenue and divide by what you spent - boom, ROI. But here's the thing most people mess up: you gotta count both direct conversions AND assisted ones since nobody buys stuff on the first click anymore. Split everything by channel and audience so you actually know what's working vs what's burning cash. Customer acquisition cost and lifetime value are clutch too - leadership loves seeing the bigger picture. Honestly just start with a basic spreadsheet and automate whatever you can. Future you will thank you for not doing manual data pulls every damn month.
Dude, just turn your reports into little stories! Frame everything like a journey - start with "here's what happened last month" and show the challenges you hit. I literally write stuff like "email marketing swooped in to save us when social media tanked." Sounds ridiculous but bosses love that drama. Create some tension too - mention trends you're watching, then boom, hit them with your recommendations to fix it. Works every time. Next month try opening with "we discovered something wild about our audience..." Trust me, way better than boring bullet points. Makes the data actually interesting for once.
Set up a dedicated A/B testing section with test names, hypothesis, sample size, and which version won. Tables work great here - just list your key metrics like conversion rates or CTR so people can scan quickly. Honestly, executives eat up visuals so I'd definitely include some charts. For each test, write 2-3 sentences about what you learned and your next steps. Focus on the tests that actually made a difference. Skip inconclusive ones unless there's something useful there. Keep it short but actionable - nobody wants to read a novel about button colors, you know?
Yeah definitely worth tracking those new AI personalization metrics and social commerce stuff. Short-form video engagement on TikTok/Reels is pretty much essential now. Voice search optimization is blowing up but honestly I'm still trying to figure out how to measure it properly lol. Zero-party data collection through quizzes and polls is solid gold right now. Gen Z is super into sustainability messaging so don't sleep on tracking that performance. Maybe create a rotating "emerging trends" section in your monthly reports? Focus on like 2-3 areas each time so you're not drowning in data.
-
Understandable and informative presentation.
-
Easily Editable.