

Digital marketing report powerpoint presentation slides





Try Before you Buy Download Free Sample Product
 Impress Your
 Audience
 100%
100% Editable
 Save Hours
 of Time


Showcase the ways to leverage the advertisements that grow your company efficiently with the aid of our Digital Marketing Report PowerPoint Presentation Slides. By using this content ready social media report PPT theme, you can display the budget and performance variance of marketing techniques digitally. Use this direct digital marketing PowerPoint graphic to maintain a proper record of conversion metrics and its various key elements. With the help of an online advertising presentation template, you can explain how to maximize the customer base and revenue of the company. Employ this professionally designed social media marketing budget report PPT visuals and portray the steps to promote the business through digital media. Take the assistance of the digital media metrics PowerPoint layout to measure your online marketing campaign performance. Use an SEO analysis report presentation slides and talk about the online marketing plan. Therefore, position the business strategy effectively by downloading our ready-to-use digital marketing ppt deck.
People who downloaded this PowerPoint presentation also viewed the following :
Content of this Powerpoint Presentation
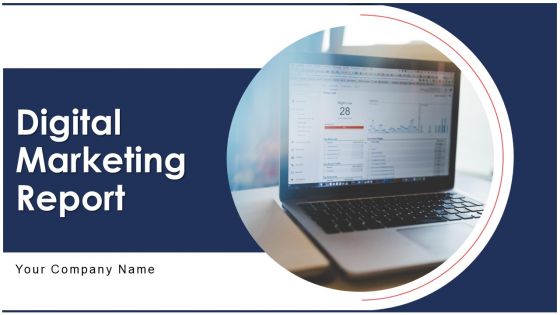
Slide 1: This slide introduces Digital Marketing Report. State your company name.
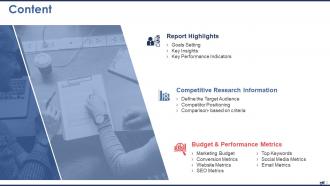
Slide 2: This slide displays the Content of the presentation.
Slide 3: This slide showcases Report Highlights.
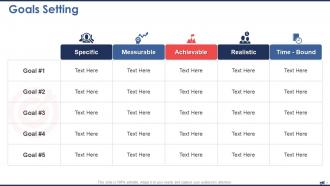
Slide 4: This slide depicts Goals Setting displaying- Specific, Time - Bound, Realistic, Achievable, Measurable.
Slide 5: This slide depicts Key Insights.
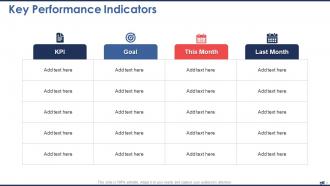
Slide 6: This slide showcases Key Performance Indicators.
Slide 7: This slide showcases Competitive Research Information.
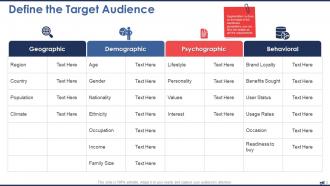
Slide 8: This slide Defines the Target Audience containing- Geographic, Behavioral, Psychographic, Demographic.
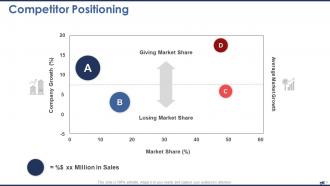
Slide 9: This slide depicts Competitor Positioning.
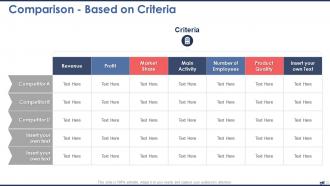
Slide 10: This slide showcases Comparison - Based on Criteria.
Slide 11: This slide depicts Budget & Performance Metrics.
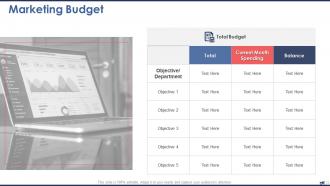
Slide 12: This slide displays the Marketing Budget.
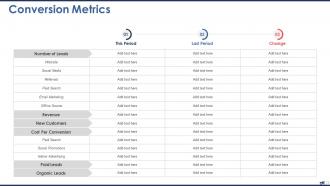
Slide 13: This slide represents Conversion Metrics.
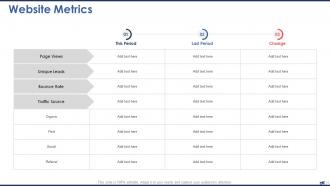
Slide 14: This slide represents Website Metrics.
Slide 15: This slide showcases SEO Metrics.
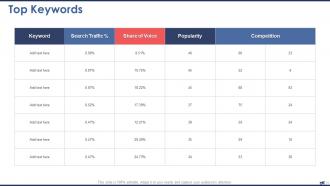
Slide 16: This slide depicts Top Keywords
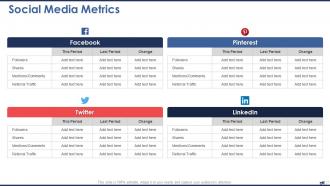
Slide 17: This slide showcases Social Media Metrics containing- Facebook, Twitter, Pinterest, LinkedIn.
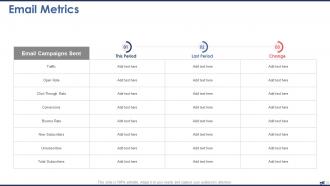
Slide 18: This slide depicts Email Metrics.
Slide 19: This is Digital Marketing Report Icons Slide.
Slide 20: This slide is titled as Additional Slides for moving forward.
Slide 21: This slide reminds about Coffee Break.
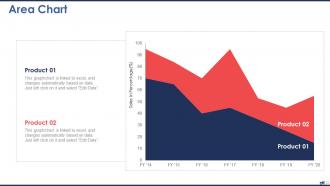
Slide 22: This slide displays the Area Chart with product comparison.
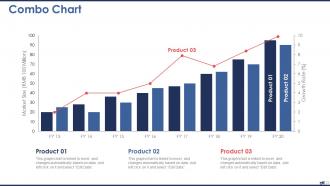
Slide 23: This slide depicts Combo Chart with different product comparison.
Slide 24: This is About Us slide to showcase company specifications.
Slide 25: This is Meet Our Team slide with names and designations.
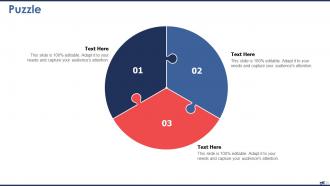
Slide 26: This is Puzzle slide with icons and text boxes.
Slide 27: This is Our Mission slide with Mission, Vision and Goal.
Slide 28: This is Quotes slide to convey message, beliefs etc.
Slide 29: This slide displays the Magnifying Glass to highlight important content.
Slide 30: This slide is titled as Important Notes. Post your important notes here.
Slide 31: This is Venn slide.
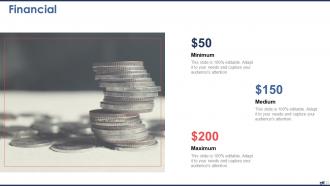
Slide 32: This is Financial slide. Showcase finance related stuff.
Slide 33: This is Thank You slide with address, Contact number and email address.
Digital marketing report powerpoint presentation slides with all 33 slides:
Use our Digital Marketing Report Powerpoint Presentation Slides to effectively help you save your valuable time. They are readymade to fit into any presentation structure.







FAQs for Digital marketing report
Start with your biggest wins and key numbers - that's what everyone actually wants to see first. Traffic sources, conversion rates, ROI by channel. I can't tell you how many reports I've seen that are basically just spreadsheet dumps with zero story behind them. Add some context about why things changed and what you're gonna do next. Charts help since nobody reads walls of text anymore. Hit the problem areas too, don't just cherry-pick the good stuff. End with concrete next steps so people know what's happening moving forward.
Honestly, data visualization is a game changer for marketing reports. Charts and graphs make your data actually interesting instead of just dumping spreadsheet numbers on people. You'll spot trends way faster, and stakeholders won't zone out during presentations. Like, when's the last time anyone got pumped about rows of data? Bar charts and line graphs are perfect for starting out - nothing fancy needed. The difference in engagement is pretty wild once you switch from boring tables to visual stuff. Plus you can show wins and problem areas without making people dig through numbers.
Start with Google Analytics 4 and grab data from Facebook Ads Manager and Google Ads too. Looker Studio (used to be Data Studio) is my go-to for analysis - connects to everything and it's free. Excel works fine for smaller stuff, no need to overcomplicate things. SEMrush and Ahrefs are pricey but honestly worth it if you want to spy on competitors and get strategic insights. I'd say stick with free tools first. Then upgrade when you actually know what's missing from your reports - oh, and don't sleep on just making simple spreadsheets sometimes.
Okay so here's the deal - social media is great for getting your name out there and building buzz. Search ads and SEO though? Those bring in people who are actually ready to buy something. Email marketing has insane ROI (like 40:1, which honestly sounds too good to be true but whatever). Paid social finds you customers you'd never reach organically. But here's where it gets interesting - customers don't just use one channel. They'll see you on Instagram, Google you later, then maybe purchase after your newsletter hits their inbox. Don't just look at last-click data or you'll miss half the story.
Focus on conversion rate, CAC, and ROAS first - those actually drive revenue decisions. Click-through rates and cost per click are solid for paid campaigns too. Bounce rate tells you if your site sucks, and time on page shows real engagement. Oh, and lifetime value is huge for seeing beyond just that first sale. I swear, half the marketers I know get obsessed with follower counts and impressions but can't tell you their actual ROI. These seven metrics will give you what you need to make smart moves with your budget.
Honestly, just grab the important stuff - engagement rates, reach, click-throughs - and dump it right into your main dashboard with everything else. Most platforms export pretty easily (Instagram's API is annoying though). Here's the thing: skip follower counts and other fluff metrics. Focus on how social actually moves people through your funnel instead. Set up a section showing website traffic, leads, and conversions from social. Oh, and definitely use UTM parameters on all your social links - otherwise you can't track where that traffic's really coming from in your analytics.
Look, audience segmentation is what turns your marketing reports from useless number soup into something you can actually work with. Break your data down by age, where traffic's coming from, how people behave - suddenly you'll see who's responding and who's not. Way better than just knowing "sales were meh" when you could know "millennials crushed it on Instagram but boomers totally ignored us." I learned this the hard way honestly. Without segments, you're just guessing at what works. Pick 2-3 segments that actually matter for your goals and start there.
Honestly, I'd go with weekly reports for the day-to-day stuff and monthly for the big picture view. You'll catch problems early with weekly ones - trust me, I've watched too many campaigns tank because nobody was paying attention. Monthly reports are better for spotting trends and planning your next moves. Social media might need daily checks if you're running something big, but SEO? Maybe quarterly since that stuff moves like molasses anyway. Just start weekly and see how it feels - you can always dial it back if it's too much work.
Honestly, the worst thing you can do is dump a bunch of vanity metrics on people. Like, who cares about follower counts if conversions suck? Focus on what actually moves the needle - ROI, sales, real business stuff. Don't make it a crazy data dump either. I've seen reports with like 50 charts and nobody reads that mess. Tell a story with your numbers instead. Oh, and if you're reporting to non-marketing people, ditch the jargon completely. They just want to know if their money's working. Always tie everything back to actual business goals so they can make real decisions with it.
Honestly, tell a story with your data instead of just dumping numbers on people. They want to know what it means for the business. I always start with the big wins or red flags, then throw in the actual metrics to back it up. Skip the spreadsheet screenshots - nobody wants to squint at those. Make dashboards that actually look decent. Oh, and match your vibe to who you're talking to. Execs want to hear about ROI impact while your marketing team needs the nitty-gritty details. Always end with what to do next, like "engagement's down 15%, let's try video content next quarter."
You've got to track ROI - it's literally how you know if your marketing isn't just a money pit. Compare what you spent to what came back. Super simple concept but honestly most people skip this part. Facebook ads might be killing it while your Google display stuff is trash (happens more than you'd think). Track everything consistently so you can see which channels actually work. Then dump more money into winners and cut the losers. Without ROI you're basically gambling with your budget and hoping for the best.
Make a clean A/B testing section with your variants, sample sizes, and significance levels - nobody wants numbers scattered everywhere. Before/after metrics are key. Highlight which version won and by how much. Confidence intervals are a must (honestly, reports without them look amateur). Side-by-side charts work great since executives love skimming visually. Here's the thing though - each test needs to connect to what you're doing next. Otherwise you're just making pretty reports that sit in someone's inbox forever. The whole point is driving actual decisions, not just documenting what happened.
Focus on AI personalization and zero-party data collection first - those are game changers right now. Short-form video is still huge obviously. Privacy stuff keeps changing everything, so definitely cover cookieless strategies. Voice search optimization actually matters now (finally!). Social commerce is going crazy with Gen Z buyers. Micro-influencers are way more valuable than big names these days - authenticity sells better than follower counts. Oh, and skip the generic industry stats everyone uses. Real examples from your specific field make reports people actually want to read instead of just skim through.
Look, your analytics show WHAT happened, but qualitative data tells you WHY. Like if you're seeing a 30% bounce rate - that's just a number. But customer interviews or even digging through support tickets (ugh, I know) will tell you people are bouncing because your checkout is confusing or whatever. Social media comments work too. I actually love reading those angry Facebook comments sometimes - they're brutal but honest. Mix both types and you'll catch stuff you'd totally miss otherwise. Numbers lie without context.
Honestly, benchmarking is a game-changer because otherwise you're just staring at numbers wondering if they're decent or trash. Like, is that 2.5% CTR good? Who knows without context! You'll spot where competitors are beating you and find areas where you're actually winning. Makes your reports so much better too - saying "we're 30% above industry average" hits different than random stats. Oh, and stakeholders eat that stuff up. Just grab 2-3 solid benchmark sources and check your key metrics every quarter. Way better than guessing.
-
good and perfect
-
Use of different colors is good. It's simple and attractive.