

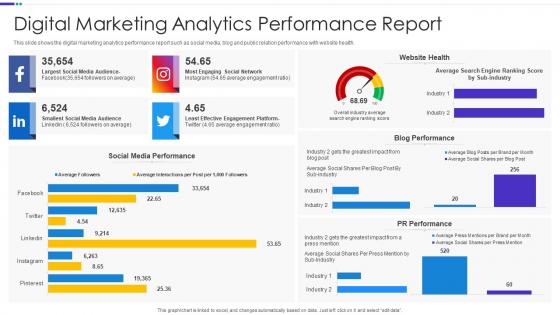
Digital Marketing Analytics Performance Report




Try Before you Buy Download Free Sample Product
 Impress Your
 Audience
 100%
100% Editable
 Save Hours
 of Time


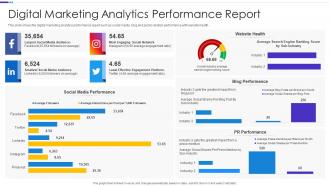
This slide shows the digital marketing analytics performance report such as social media, blog and public relation performance with website health.
People who downloaded this PowerPoint presentation also viewed the following :
Digital Marketing Analytics Performance Report with all 7 slides:
Use our Digital Marketing Analytics Performance Report to effectively help you save your valuable time. They are readymade to fit into any presentation structure.





FAQs for Digital Marketing
Honestly, start with the basics - traffic sources, conversion rates, CPA, and customer lifetime value. Those tell you what's actually working. Bounce rate and time on page matter too, especially if people are just hitting your site and bouncing immediately (super frustrating). Obviously revenue stuff like ROAS needs to be front and center. I learned this the hard way - don't get obsessed with follower counts and vanity metrics. Engagement rates are way more telling if you're doing social. Once you've got those fundamentals down, add channel-specific stuff based on where you're putting most of your money and time.
Focus on the stuff that actually matters for revenue - conversion rates, customer acquisition costs, lifetime value. That's where the money insights are. Google Analytics goals will show you which channels bring quality customers (I'm obsessed with those dashboards honestly). Check user behavior flows to catch where people bail out, then fix those spots. A/B test your landing pages based on what users are actually doing. Oh and don't just hoard data like some kind of metrics dragon - use it to decide where your marketing budget goes. That's the whole point anyway.
So Google Analytics is like your spy cam for seeing how people use your site. Track stuff like bounce rate and how long visitors stick around. The behavior flow reports? Super helpful for catching where people bail out. I spend way too much time in there honestly, but you can see which pages work and which ones suck. Set up goals first to track conversions and important actions. Once you dig into session duration and conversion paths, you'll figure out what's actually driving results vs what's just wasting your time.
Only test one thing at a time - trust me on this one. If you change your headline AND your button color, you'll have no clue what actually worked. Get a proper sample size first (there's free calculators online), then let it run long enough to catch weekly patterns. I made the mistake once of calling a winner after like 3 days... totally wrong call. Also? Stop checking the results every hour - you'll just psyche yourself out. Write down everything: what you tested, your reasoning, what happened. Even the tests that totally bomb teach you something useful about your audience. Oh, and patience is key here.
Okay so social media analytics are like your cheat sheet for figuring out what actually connects with people. You can see which posts get shared the most, when your audience is online, what kind of messaging hits different - honestly I get way too into scrolling through the numbers sometimes lol. Instead of just posting random stuff and hoping it sticks, you'll know what's worth your time. Focus on engagement rates and reach first. Those will show you what's boosting your brand visibility and getting real reactions from people, not just vanity metrics.
So for digital marketing analytics, line charts are your best friend for tracking trends like traffic and conversions over time. Bar charts work well when you're comparing different channels or campaigns. Funnel visuals are clutch for conversion paths - they tell the whole story. Heatmaps are honestly amazing because they show exactly where people click and scroll on your site. I probably use them more than I should. Tables are useful for detailed breakdowns but skip them in exec presentations since they're way harder to scan quickly. Just pick whatever makes your key metrics pop at first glance.
So predictive analytics is basically your marketing crystal ball - but actually useful lol. You can figure out which customers will probably convert before they even decide, or spot who's about to bail on you. The algorithms crunch all your historical data and current user behavior to spit out probability scores. Pretty cool stuff. This means you're not just throwing money at random campaigns anymore. You can personalize messages before people know what they want and tweak things as you go. Honestly, I'd start with conversion prediction models first - they're usually the easiest wins and you'll see results faster.
Ugh, data silos are the worst part. Facebook and Google Analytics basically hate each other - totally different metrics, nothing syncs properly. Customer journeys get super confusing too. Like someone sees your Instagram ad, searches you on Google, then actually buys through an email link. Good luck tracking that mess! APIs have annoying limits and the data formatting is honestly a nightmare. Oh, and don't even think about going big right away. Pick 2-3 main sources first, get a solid integration tool (worth the money), and set up consistent naming from the start or you'll regret it later.
So attribution modeling tracks how customers move through all your different touchpoints before they actually buy something. Most people just look at the last click, which is honestly pretty useless - like giving all the credit to the final player who scores instead of the whole team. Your display ads and social posts do work, they just don't get the recognition. There's different models you can pick from: first-touch, linear, time-decay, whatever fits your setup. People almost never convert after one ad anyway. I'd start with Google Analytics' multi-touch attribution to see how everything works together.
Dude, you've gotta stop treating everyone like the same customer. Group people by what they buy, how they act, their age - whatever makes sense. A 25-year-old getting skincare wants different things than someone who's 45, right? Analytics can spot these patterns for you automatically, which honestly saves so much time. When you send targeted stuff instead of generic blasts, people actually respond. Your conversion rates go up. ROI improves. Customers feel like you actually know them. I'd start by looking at your best customers first - see what they have in common, then build from there.
Heatmaps are honestly a game changer - they show you exactly where people click and how far they scroll down your pages. Click maps work great for landing pages, while scroll maps are perfect for blog posts. I'd start with your busiest pages since that's where you'll get the most actionable data. What's crazy is how obvious the problems become once you actually see the visual data. You'll spot which buttons people ignore and where they're bouncing off. Most teams skip this step but it's such an easy win for figuring out what's broken on your site. Then you can redesign those weak spots and test new layouts.
Be upfront about what data you're grabbing and always ask first - none of that sneaky stuff. Only collect what you actually need, and anonymize personal details when you can. Those creepy retargeting ads that stalk you across the internet? Yeah, don't be that company. Check if you need to follow GDPR or CCPA rules too. Honestly, it all comes down to not being sketchy about it. When people trust how you handle their info, they'll actually engage with your brand instead of running away. I'd start by looking at what you're doing now and fixing the obvious problems first.
Honestly, you're probably looking at the wrong metrics. Stop obsessing over last-click attribution - track the whole journey from when someone first finds you to when they actually buy. Set up UTM parameters for everything (I know, it's tedious but worth it). Connect your analytics to real revenue data, not just traffic numbers. Customer lifetime value matters way more than immediate purchases. GA4 actually has decent attribution modeling now, which helps. But first figure out what counts as a "conversion" for you - sale, lead, whatever. Then trace backwards to see which channels really drive those actions. Traffic means nothing if it doesn't convert.
Honestly, you need to get on AI predictive analytics and real-time personalization ASAP. Privacy laws are killing third-party cookies, so everyone's scrambling for first-party data solutions - which is actually better anyway, that old tracking was sketchy as hell. Customer lifetime value modeling is huge right now. Cross-channel attribution that doesn't suck is finally becoming a thing too. Have you messed with GA4 yet? If not, start there. Also look into customer data platforms - I know it sounds boring but trust me on this one. Companies figuring this out early are gonna crush it while others are still playing catch-up.
Honestly, smaller businesses have a huge advantage - you can move way faster than those corporate dinosaurs stuck in committee hell. Pick 3-4 metrics that actually matter for revenue (conversion rates, customer acquisition cost, lifetime value). Google Analytics and Facebook Insights are your best friends here, and they're free. Focus on finding which channels bring you the good customers, then go all-in there. Small budgets make you scrappy in the best way. Test one thing each week. When something sucks, you can pivot immediately instead of waiting six months for approval like the big guys do.
-
Awesomely designed templates, Easy to understand.
-
Been using SlideTeam for some time now…can’t imagine why I wasted all that time in front of the screen trying to make the perfect presentation.