


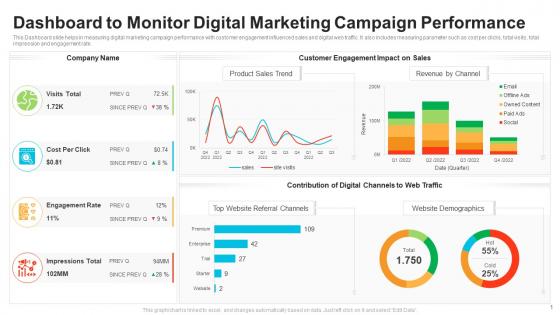
Dashboard to monitor digital marketing campaign performance


Try Before you Buy Download Free Sample Product
 Impress Your
 Audience
Editable
of Time


Our Dashboard To Monitor Digital Marketing Campaign Performance are topically designed to provide an attractive backdrop to any subject. Use them to look like a presentation pro.
People who downloaded this PowerPoint presentation also viewed the following :
Dashboard to monitor digital marketing campaign performance with all 2 slides:
Use our Dashboard To Monitor Digital Marketing Campaign Performance to effectively help you save your valuable time. They are readymade to fit into any presentation structure.
FAQs for Dashboard to monitor digital
Honestly, just track what actually matters for making decisions. Traffic sources and conversion rates are your bread and butter - plus cost per acquisition so you're not hemorrhaging cash. Customer lifetime value is massive but everyone seems to forget about it for some reason. Bounce rate and time on site give you the real story about user behavior. Social reach matters too if that's your thing. ROI and attribution data show you where to throw more money. But seriously, don't go overboard with tracking everything - you'll just confuse yourself and never actually make any moves.
Dude, you'll love having a dashboard - saves so much time bouncing between Analytics, Facebook ads, all that stuff. Everything's right there so you can actually see what's working vs what's bombing. I probably check mine way too much but whatever, it's addictive seeing the real-time numbers. When something tanks, you can shift budget over to the good campaigns super quick. Plus set up alerts for the important stuff so you don't miss when things go sideways. Honestly changed how I run campaigns - way easier to hit goals when you're not flying blind.
Okay so static dashboards are basically like screenshots - they show you data from whatever time they were last updated, usually manually or on some schedule. Dynamic ones pull live data automatically. Honestly I learned this the hard way when I was always making decisions based on yesterday's numbers with static dashboards, which sucked. With dynamic you're seeing real-time ad spend, conversions, all that stuff as it happens. Way better if you're optimizing daily or running anything time-sensitive. You'll spot problems faster and actually know what's working right now instead of guessing.
Honestly, connecting analytics tools to your dashboard changes everything. You'll go from manually copying data (ugh, so tedious) to having real-time info flow in automatically. The cool part? You can finally see how your email campaigns actually affect website conversions - stuff you'd totally miss when everything's scattered across different platforms. I'd start small though, maybe just your top 2-3 data sources first. Don't overwhelm yourself. Once you get that cross-channel view working, patterns jump out that you never noticed before. Plus it saves me like 3 hours a week on reporting alone.
Honestly, your KPIs are what make or break the whole dashboard. Pick like 5-7 metrics that actually connect to your business goals - don't just dump everything on there. I've seen so many cluttered dashboards that tell you nothing useful. Focus on stuff like conversion rates or ROAS instead of those feel-good vanity metrics. The trick is starting with your main objectives first. Then figure out which numbers actually move the needle. Your dashboard layout should flow around these core KPIs so they're telling a clear story about how you're doing. Makes decision-making way easier too.
Honestly, good visual design is a game-changer for dashboards. Make your key metrics bigger so they jump out first. Group related stuff together and use white space - cramped dashboards are the worst. Colors should mean something, not just look nice. I've seen way too many that are basically rainbow vomit. Keep it consistent so users aren't guessing what red means this time versus last time. The whole point? People should find what they need instantly. Take a hard look at yours and figure out what deserves prime real estate at the top.
Start with Google Analytics and your ad platforms - Facebook Ads Manager, Google Ads, that stuff. Your email tool too (Mailchimp, HubSpot, whatever you're using). Social media APIs are honestly such a headache to set up, but you'll probably want them eventually. Oh, and definitely your CRM if you're tracking leads properly. Here's the thing though - don't go nuts trying to connect everything right away. Pick your most important metrics first. I made that mistake once and spent way too much time debugging connections instead of actually looking at data. Build it out piece by piece or you'll lose your mind.
Daily updates are your sweet spot - trust me on this. Real-time data looks cool but you'll just stress yourself out checking every five minutes. Daily gives you enough detail to catch trends without drowning in random fluctuations. I learned this the hard way after spending way too much time obsessing over hourly changes that didn't even matter. Weekly works fine for those big monthly reports though. Just stay consistent with whatever schedule you pick. Oh, and set up auto-refresh so you're not stuck pulling data manually each morning like some kind of robot.
First thing - figure out what actually moves the needle in your space. B2B companies care about lead quality and sales cycles, e-commerce is all about conversions and cart abandonment rates. Your executives will roll their eyes at vanity metrics that don't connect to money (learned this the hard way). Think about who's using this thing too - some people want simple charts, others can handle the complex attribution stuff. Oh, and definitely set up alerts for when things go sideways. Organize everything by funnel stages or departments. Test it with real users first before you launch it everywhere.
For A/B tests, I always do side-by-side cards showing conversion rates and click-through rates with color coding - green wins, red loses. Super obvious that way. Make sure you include sample sizes because stakeholders literally always ask about that first thing. Confidence intervals are clutch too. I like adding trend lines so people can see how performance changed over time, plus little badges when something hits statistical significance. Oh and set up alerts when tests reach significance - saves you from having to constantly check. The whole point is making it dead obvious which variant crushed it and by how much.
Ugh, data overload is the worst part honestly. You'll get flooded with metrics from Analytics, social media, email platforms - everything. It's so tempting to track it all but that just creates a mess. Then you've got integration nightmares trying to connect different tools (been there). Most people get obsessed with vanity metrics that look pretty but don't actually drive revenue. And good luck getting everyone to agree on what "success" even means lol. My advice? Pick maybe 5-7 KPIs that actually move the needle for your business first. You can always add more later once you've got those dialed in.
Dude, you'll save so much time once you set up automated feeds from your ad platforms and Google Analytics. No more Monday morning copy-paste hell - I used to hate that part of my week. Tools like Tableau or even Google Data Studio can pull data automatically on whatever schedule you want. Power BI works great too, though it's a bit pricier. Just connect one platform first to make sure everything's working right. Once you see how smooth it runs, you can add your social media APIs and email tools. Trust me, you won't want to go back to manual reporting.
Honestly, you need a dashboard because jumping between Instagram, Facebook, and Twitter analytics is such a pain. It pulls everything into one place - engagement, followers, reach, all that stuff - so you can actually see what's working. Real-time data is clutch too. I'd set up automated reports first so you're not wasting time every week manually pulling numbers (learned that the hard way). The cool thing is spotting trends fast and seeing how your social stuff connects to bigger marketing wins. Way better than the platform-hopping nightmare.
User personas totally shape which metrics you focus on and how you lay out your dashboard. CMOs want ROI and conversion numbers right up front. Social media managers? They're all about engagement rates and follower growth by platform. Complexity matters too - execs prefer clean summaries while analysts need to dig into raw data. Honestly, we completely botched our first dashboard because it was way too messy. Should've mapped out our main users first, then designed around how they actually work day-to-day. Makes such a difference when you think about their real workflow instead of just cramming everything in there.
Honestly, start with Google Data Studio - it's free and hooks up to pretty much everything. Can't argue with that! If your company's got money to burn, Tableau and Power BI are way more powerful for deep analytics stuff. Already using HubSpot or SEMrush? Their dashboards are decent enough. Klipfolio and Databox work too if you want something quick. I'd mess around with the free option first though - figure out what numbers you actually care about before spending cash on the fancy tools. Most people don't need half the features they think they do anyway.
-
Excellent Designs.
-
Visually stunning presentation, love the content.
-
Great designs, really helpful.
-
Appreciate the research and its presentable format.