Marketing is a mix of numbers and psychology, a strategy built up with strategies. Understanding marketing takes more than just a matrix, chart, or report. It is so vast and dynamic that even the expert marketers/businessmen/ideal salesman/entrepreneurs are only able to explore some or limited angles and strategies of it. Recall this famous quote from Albert Einstein when you think of mastering everything in marketing — "You Don't Have to Know everything. You Just Have to Know Where to Find It." That one convenient place where you will find inside-out about your marketing strategies and control is the marketing dashboard.
What is a Marketing Dashboard?
A marketing dashboard is a powerful tool that provides a visual display of marketing data and key performance indicators (KPIs). It helps marketers track and optimize their campaigns. It includes metrics such as website traffic, conversion rates, social media engagement, and pre-set goals and targets. This information is presented in an easy-to-understand format, often using graphs, charts, and other elements.
How to Create An Actionable Marketing Dashboard
Although there is no standard process to create a marketing dashboard, you can follow these steps to create an excellent one:
- Identify your key performance indicators (KPIs): The first step in creating a marketing dashboard is identifying the most important metrics for your business and marketing efforts. These metrics should be specific, measurable, attainable, relevant, and time-bound (SMART) and align with your business goals and objectives.
- Collect data: Next, collect the data for those decided metrics. Software used to track website traffic, social media engagement, conversion rates, and other relevant data, like Google Analytics (GA), is useful.
- Organize and clean your data: This big data contains unwanted, good, or bad data that need to be filtered (and stored for future use). Therefore you will need to organize and clean the collected data to ensure accuracy and be ready for analysis. It involves sorting & filtering the data, removing duplicate or incorrect entries, and other data-cleaning tasks.
- Visualize your data: Once the data is cleaned and organized, convert, visualize and present it using graphs, charts, and other visual aids. It will help you see trends and patterns.
- Create your dashboard: Create this marketing control tool using a platform/software, pre-designed layouts, and appearances of the dashboard. Finally, add your data visualization elements to the dashboard.
- Update and maintain your dashboard: To harness regular valuable insights and closely monitor your campaigns, the marketing dashboard should be updated with the latest data. This may involve setting up automatic data refresh, collating the dashboard as needed, and sharing it with relevant stakeholders.
A successful marketing campaign for your most awaited product must start with a memorable product launch. This guide will help you design the perfect product launch presentation and reach the horizon of the audience's expectations.
Marketing Dashboard Templates
Identifying metrics, collecting, filtering, and organizing relevant & useful data is part of the dashboard creation process you or your team need to handle alone. We will take over from the next data visualization step with our pre-designed marketing dashboard templates. These PPT Designs include graphs, charts, and other high-quality visual aids that will support your objectives of easy-to-read and comprehensive data presentation of all marketing initiatives.
Let's look at some samples from our extensive collection of marketing dashboard templates and understand their features which make them ideal for your use!
Bonus: Marketing Dashboard PowerPoint Presentation Deck
This presentation deck comprises 10 customizable pre-designed templates to help you create eye-catching marketing dashboards. It includes PPT layouts for creating dashboards, such as an eCommerce performance analysis marketing dashboard. Other examples include a digital marketing dashboard focusing on performance visibility, a KPI dashboard to improve the efficiency of PPC marketing campaigns, and more. Download it now!
Download this presentation deck
1. Marketing KPI Dashboard Template To Measure CPC Rate
A marketing dashboard comprises a consolidated one-page view of top-level marketing reports to allow viewers to understand and review them at a glance. It is a small part and basic building block of detailed marketing analytics. This dark-themed template will allow you to create a dashboard that helps you monitor cost per conversion (CPC) using key performance indicators like advertisement cost, clicks, impressions, and click-through rates (CTR). Get it now!
2. Marketing Dashboard Template With Sales & Lead Generation KPIs
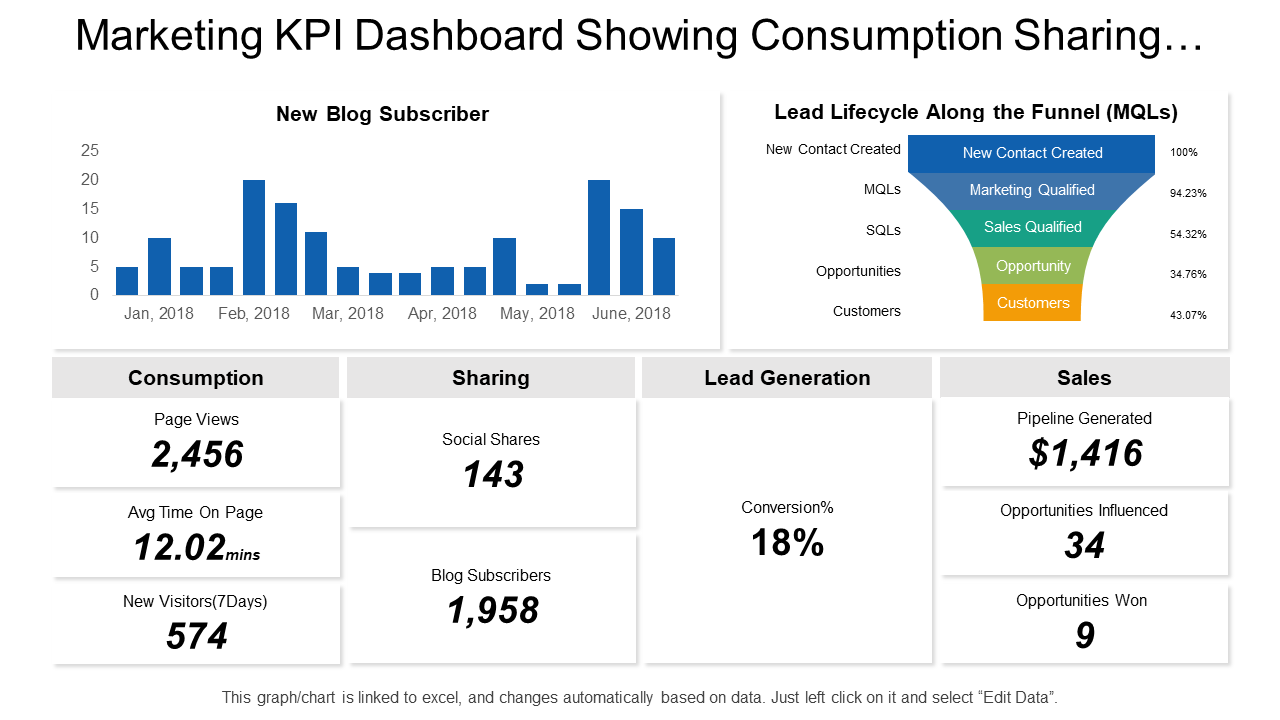
An excellent marketing dashboard is the simplest one, which allows you to find the desired data in seconds. This professional business template will help you create a concise dashboard entailing sales and lead generation KPIs in marketing. It allows you to track new blog subscribers, page views, average time on page, subscribers, social shares, conversion percentage, pipeline generated, opportunities influenced, and won. Get it now!
3. SaaS Lead Breakdown Marketing Dashboard Presentation Template
Lead scoring and marketing automation are two crucial elements of effective lead management for Software as a Service (Saas) businesses. With the expansion of marketing campaigns, a variety of leads from different channels come to your database. This PPT template will help you create a dashboard to manage (lead scoring) and present this big data using graphs, charts, and other visual graphics. It highlights the lead breakdown, differentiates leads by region, and includes process monitoring indicators like key conversion metrics, lead quality, monthly leads data, and trial by role. Grab it now!
4. Digital Marketing Dashboard Template For E-commerce Website
The dashboard of an E-commerce website can be overwhelming. It aims to continuously monitor the website performance using metrics such as cost per lead, web traffic sources, return on marketing investment (ROI), churn rate, retention, new visitors, cart activities, sales by contact method, and goal completion rate. This template will help you create a dashboard that analyzes these metrics in-depth and present the data in an eye-appealing way. Grab it now!
5. Multiple Online Marketing Campaigns Result Dashboard Template
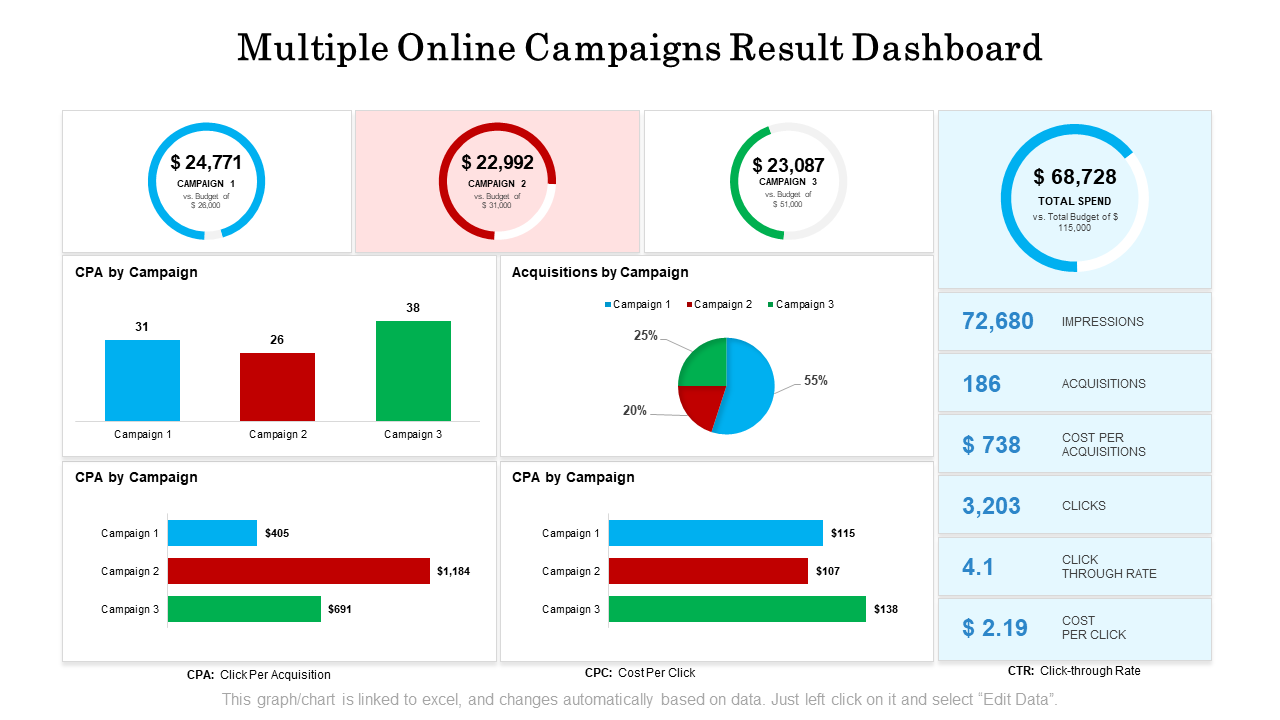
It is common for businesses to run multiple online/offline marketing campaigns to boost their brand presence and acquire maximum leads. What feels nerve-wracking is to track all these campaigns using Software and tools. This template will be your blueprint for setting up a dashboard to monitor multiple online campaigns at once. It will give you a picture of each campaign expenditure, acquisition, CPA, and CPC. You will able to present overall spending, impressions, clicks, CTR, and total CPC using this marketing dashboard template. Grab it now!
6. Marketing Performance Dashboard Presentation Template
A performance dashboard reads and analyzes each touchpoint of a marketing campaign as a tangible metric to mark its success. These dashboards collect and present campaign data based on the attribution models to give broad-spectrum insights. This presentation template will help you present the collective data of marketing campaigns and track performance in a comprehensive manner. It includes graphics for KPIs such as lead funnel, traffic sources, lead per month, and revenue. Grab it now!
7. Digital Marketing Dashboard Template For Revenue Per Channel
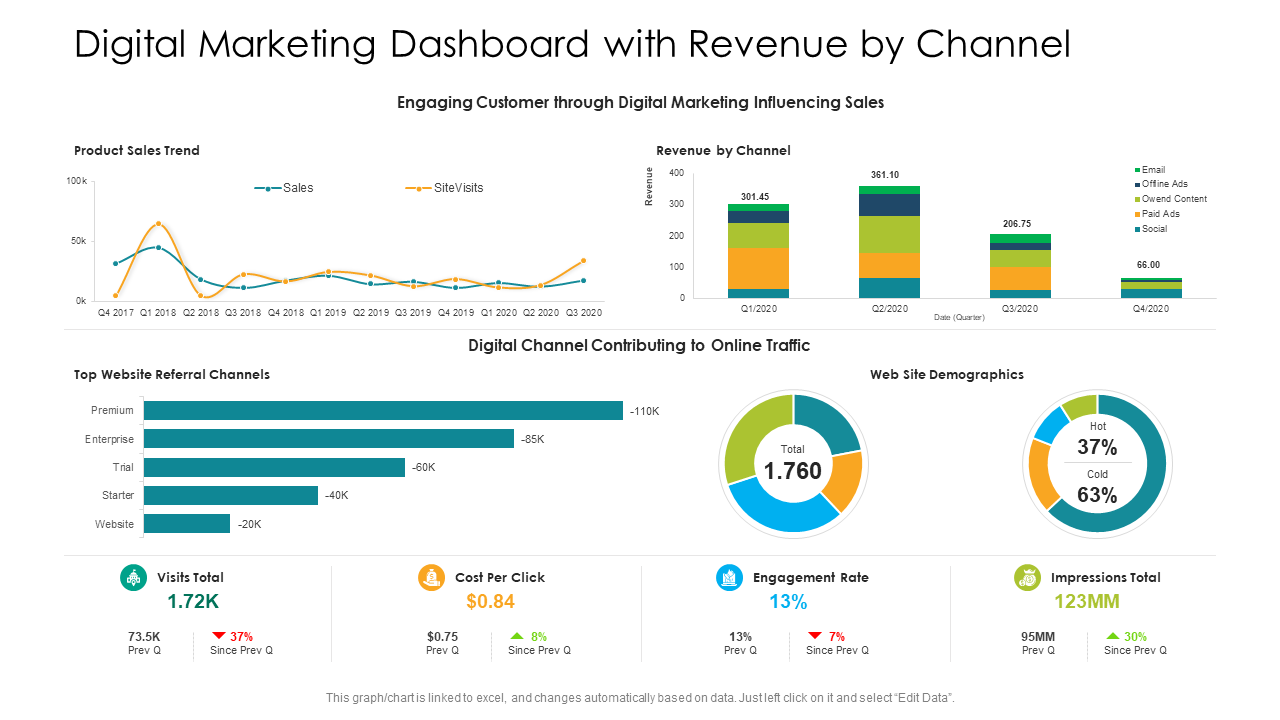
An open ecosystem of social media networks and internet channels forms the framework for digital marketing strategies. Using metrics suitable across multiple channels is the best way to track these marketing strategies. This template is home to elements that will help you configure an intelligent digital marketing dashboard with effective KPIs to increase customer traction. It includes product sales trends, revenue per channel, referral channels, demographics, CPC, engagement rate, and total impressions. Grab it today!
8. Online Marketing Dashboard PPT Presentation Template
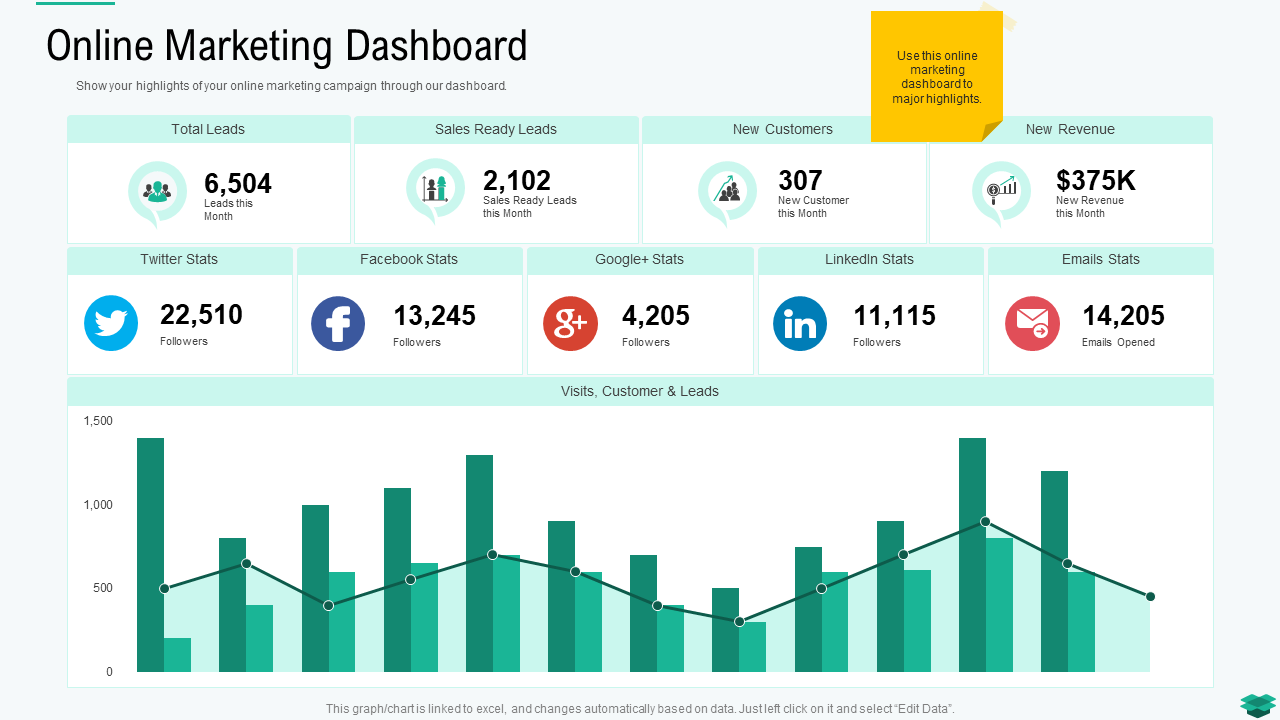
A major share of online marketing goes to social media platforms, with 93% of total online users (5 billion). Without consideration of social media platforms, you cannot devise an effective marketing strategy. This template will help you curate a marketing dashboard that brings the statistics of all social media platforms' campaigns into one place. It allows you to read the information and get strategies for channels like Twitter, LinkedIn, Facebook, Google Plus, email, etc. Use this PPT Design to access total leads, sales-ready leads, new customers, and revenue from these websites.
9. RACE Digital Marketing Dashboard Template For Multi-channel Tracking
RACE represents the four levels of customer interaction in a sales & marketing funnel — reach, act, convert, and engage. This template will help you devise a comprehensive dashboard that summarizes the customers' data for these segments. It tracks the critical KPIs of each level, like session, users, revenue/visits, and organic search session for reach, leads, conversion, and bounce rate for the customer action, and more like this. Download it now!
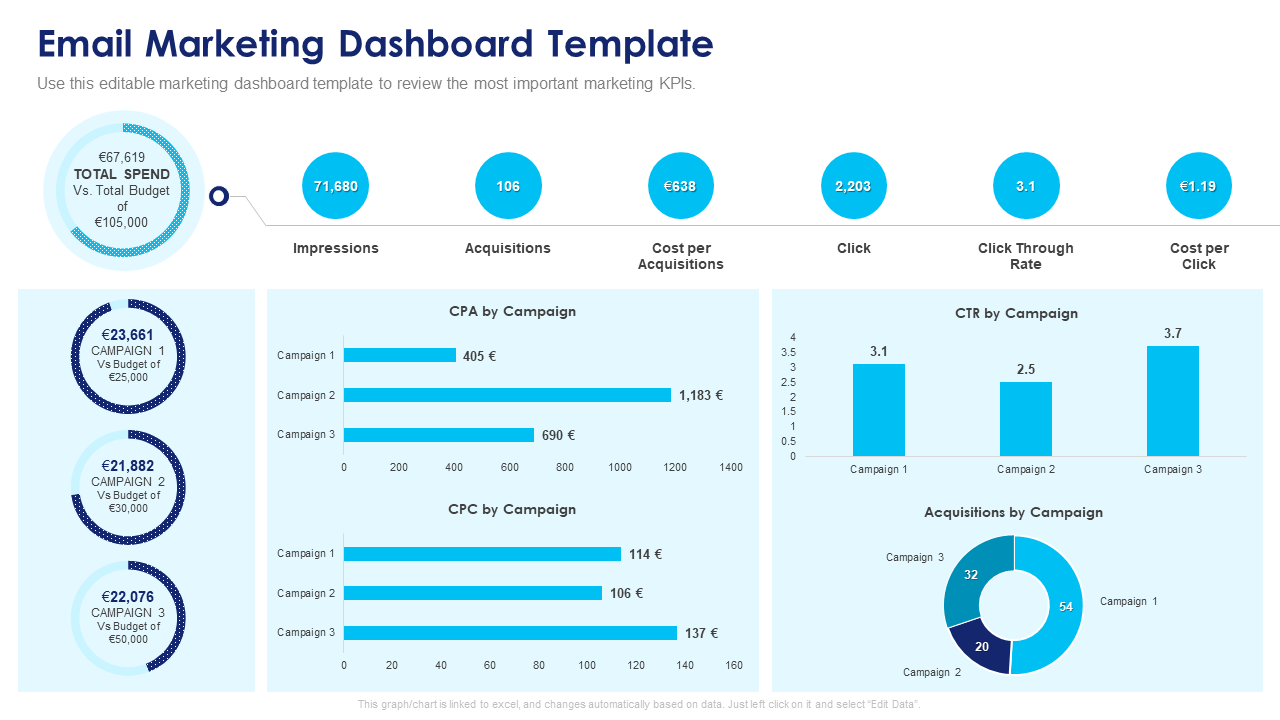
10. Email Marketing Dashboard PPT Presentation Template
Whether it's a drip, nurturing, or regular email marketing campaign, this dashboard template will help you analyze the performance and optimize them all. It enables you to read the KPIs data to find the ideal message that resonates with your brand image in the audience's mind. With this marketing dashboard template, you will be able to calculate the revenue share of email marketing and the factor affecting it. Download it today!
The Coda
A marketing dashboard saves time and keeps marketers aligned with their goals by providing a single source of truth for all marketing data. It brings together key metrics and data to provide valuable insights to help management make data-driven decisions and optimize their campaigns for better results. With a marketing dashboard, marketers will be able to see their daily/monthly/weekly/annual performance, identify trends & opportunities, and track their continuous progress over time.
FAQs on Marketing Dashboards
1. What should a marketing dashboard include?
A marketing dashboard is a visual representation of key performance indicators (KPIs) useful for a marketing team. The specific KPIs included will depend on the goals and objectives of the marketing team, desired and available data & insights. However, common KPIs often included on a marketing dashboard include:
- Website traffic.
- Conversion rates.
- Lead generation.
- Customer acquisition
- Return on Investment (ROI).
A marketing dashboard also includes data on social media engagement, email marketing performance, and other metrics relevant to the team's goals. Ultimately, a marketing dashboard provides a quick and easy way for marketers to track the performance of their campaigns and make data-driven decisions.
2. How do I create a marketing dashboard?
A marketing dashboard is an easy and time-saving way for the marketing team to track the performance of campaigns and make data-driven decisions. By identifying the most important KPIs and collecting data on them, marketers can create a dashboard that provides valuable insights and helps them improve the effectiveness of their marketing efforts. Follow these steps to create an actionable marketing dashboard:
- Identify the key performance indicators (KPIs) that are relevant to your marketing team and its goals.
- Collect data on these KPIs from a variety of sources, such as your website analytics, social media platforms, and marketing automation tools.
- Use Software or tool like SlideTeams marketing dashboard templates to create a visual representation of the data.
- Customize the dashboard to display the data in an easy-to-understand way and provides insights into the performance of your marketing efforts.
- Share the dashboard with your marketing team, and set up regular update intervals to ensure that the data is always fresh and accurate.
3. What are the 5 marketing metrics?
The five marketing metrics that are popular and used most to measure the success of marketing efforts are
- Reach: Measure the number of people exposed to a marketing campaign or message.
- Engagement: Calculate the level of interaction or involvement people have with a marketing campaign or message.
- Conversion rate: Used to gauge the percentage of people who take the desired action — making a purchase or signing up for a newsletter after getting in touch with a marketing campaign or message.
- Customer acquisition cost: Calculating the cost associated with acquiring a new customer. Computed by dividing the total marketing costs by the number of new customers acquired.
- Return on investment (ROI): Profitability of a marketing campaign or strategy, calculated by dividing the total revenue generated by the total cost of the marketing efforts.
These five metrics are used to evaluate the effectiveness of marketing campaigns & strategies and help marketers make data-driven decisions about resource allocation and enhancing marketing efforts performance.
4. What are the 3 layers of dashboards?
The three layers of a dashboard are designed to provide a complete picture of the performance of a business or organization, from high-level goals and objectives to real-time operational details. By using all three layers, managers and decision-makers can gain a comprehensive understanding of the performance of their businesses and make data-driven decisions. These are:
- The strategic layer: Topmost level of a dashboard and focuses on high-level goals and objectives. It includes metrics that provide an overview of the overall performance of the organization.
- The tactical layer: Middle layer of a dashboard focuses on specific processes or initiatives. It comprises metrics that provide detailed insights into the performance of individual campaigns or projects.
- The operational layer: Ground level of a dashboard and focuses on real-time data and operational details. It contains metrics that provide real-time updates on the performance of specific processes or tasks.




 Customer Reviews


