Analytics help with decision-making, inspire fresh thinking, and reveal potential for expansion. In fact, according to the 2018 Global Data Management Benchmark Report, data and analytics will be a major source of potential for 52% of the firms polled. Additionally, as more businesses turn to their data for strategic decision-making, their capacity to generate usable insights will become increasingly important to their success.
How then, can you use your sales data to analyze performance and make important decisions?
The solution is a sales dashboard.
Your sales data is presented visually in a sales dashboard. Sales dashboards are able to pull in real-time data, and this information may frequently be filtered using many time frames.
Key performance indicators (KPIs) are outlined , which also demonstrates how your sales force is progressing toward your objectives and revenue targets. Additionally, sales leaders use this data to monitor target achievement, make plans and decisions, modify compensation, give out incentives and rewards, and spot concerns before these escalate into a crisis.
Here is a compilation of a wide range of perfectly visualized sales dashboard templates for monitoring sales performances, conversion/win rates, average deal sizes, revenue, lead conversion & opportunity ratio, and sales funnel leaks.
Employ these easy to read, comprehensible, well-structured, and customizable sales dashboard slides crafted with the aim to assist companies present their businesses in an amazing way, giving new heights to their sales and performances!
Let’s go through them!
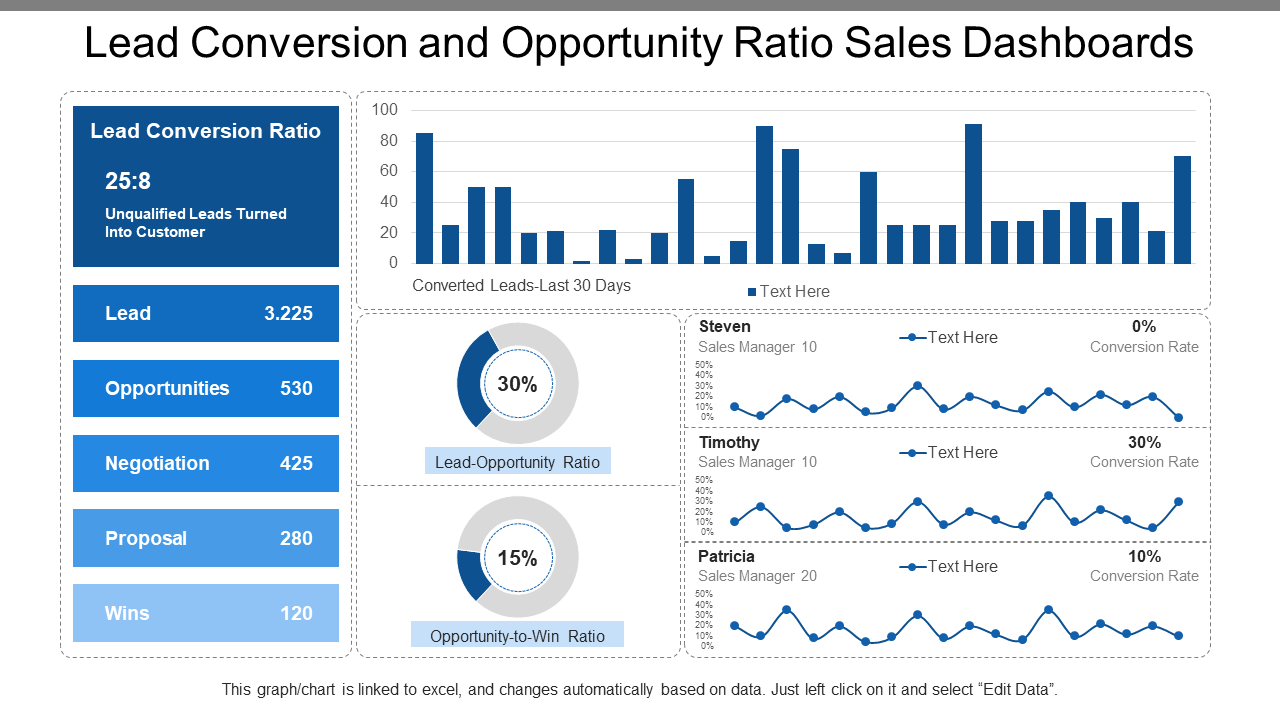
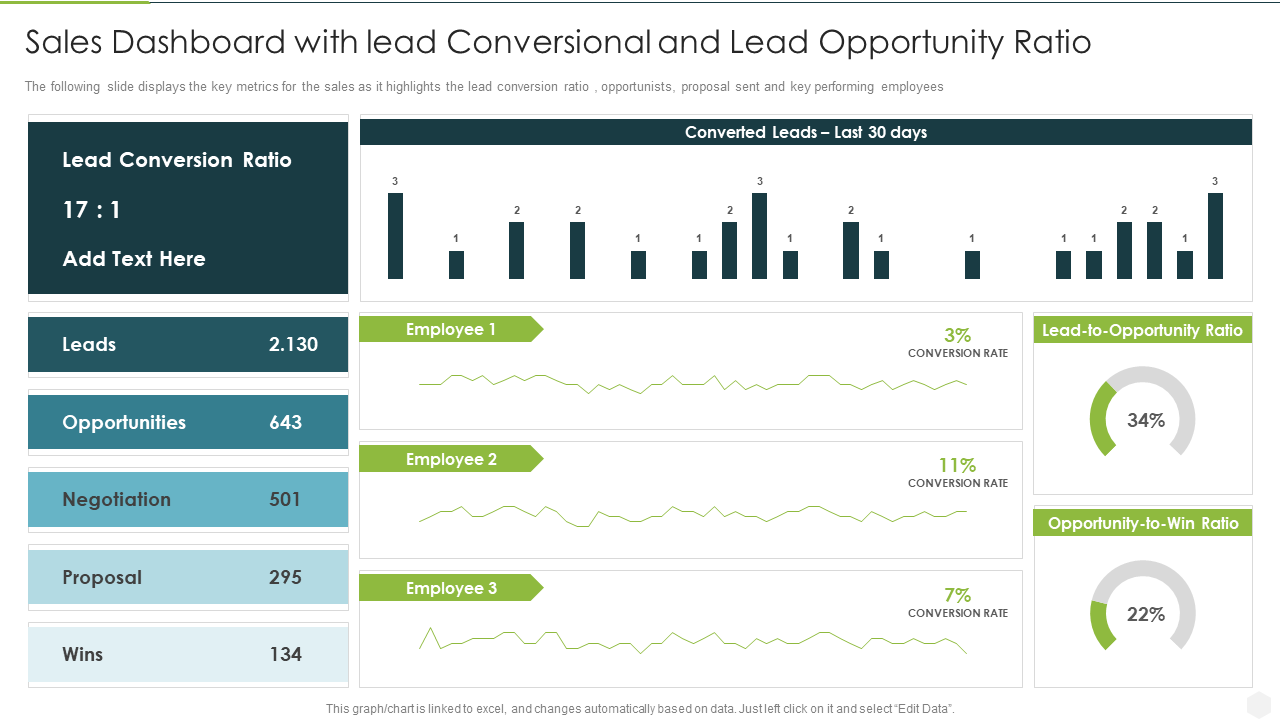
Template 1: Lead Conversion And Opportunity Ratio Sales Dashboards
Thorough evaluations of overall sales, cycle times, sales funnels, lead conversion and sales dashboard is an instrument that lets C-level managers and executives effectively oversee and monitor sales KPIs in a single location. It also assists teams in achieving their sales target. Thanks to our excellent content and graphics, this lead conversion and opportunity ratio sales dashboard is a fantastic layout for presenting an in-depth review of the company's performance with the established goals.
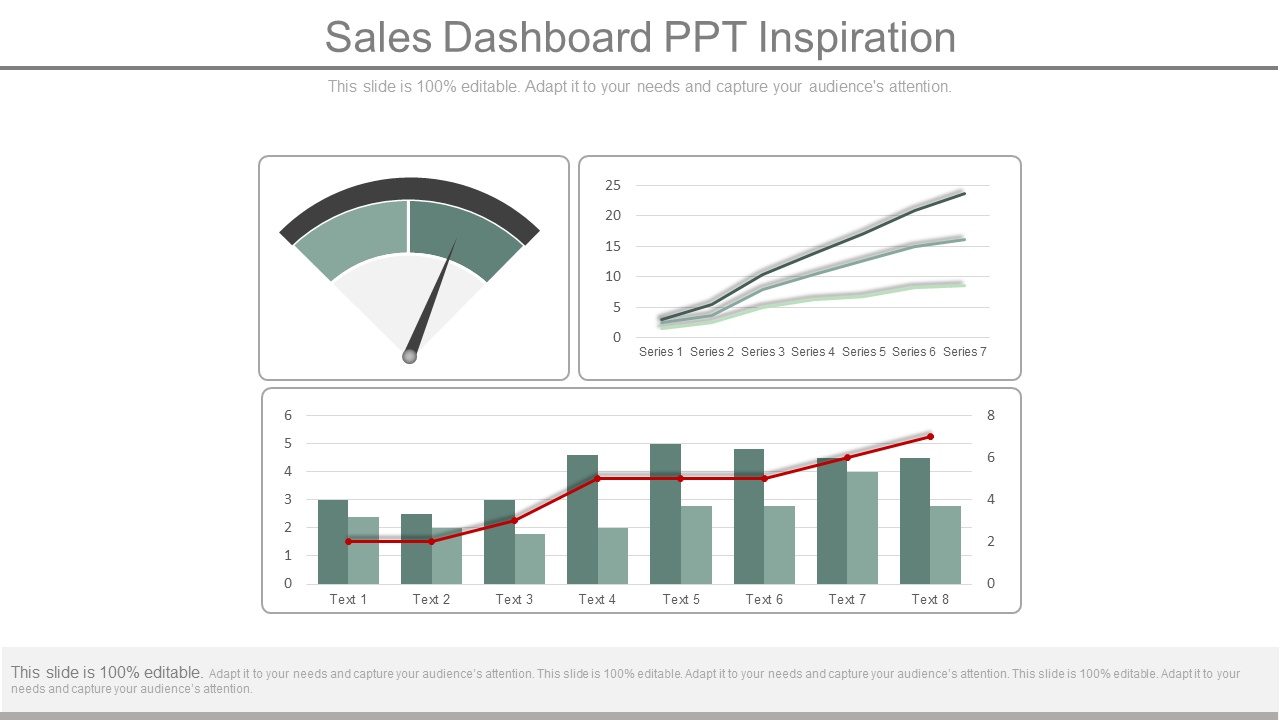
Template 2: Sales Dashboard Snapshot PPT Inspiration
Monitoring and implementing strategies at once is a complex process. Accomplish this difficult task with the aid of our Sales Dashboard Snapshot PPT Inspiration Template. This innovative slide can help you calculate average weekly sales, revenue and more, simultaneously helping you show the traffic source and sales average. Use this pre-made dashboard template to make an excellent first impression on your customers.
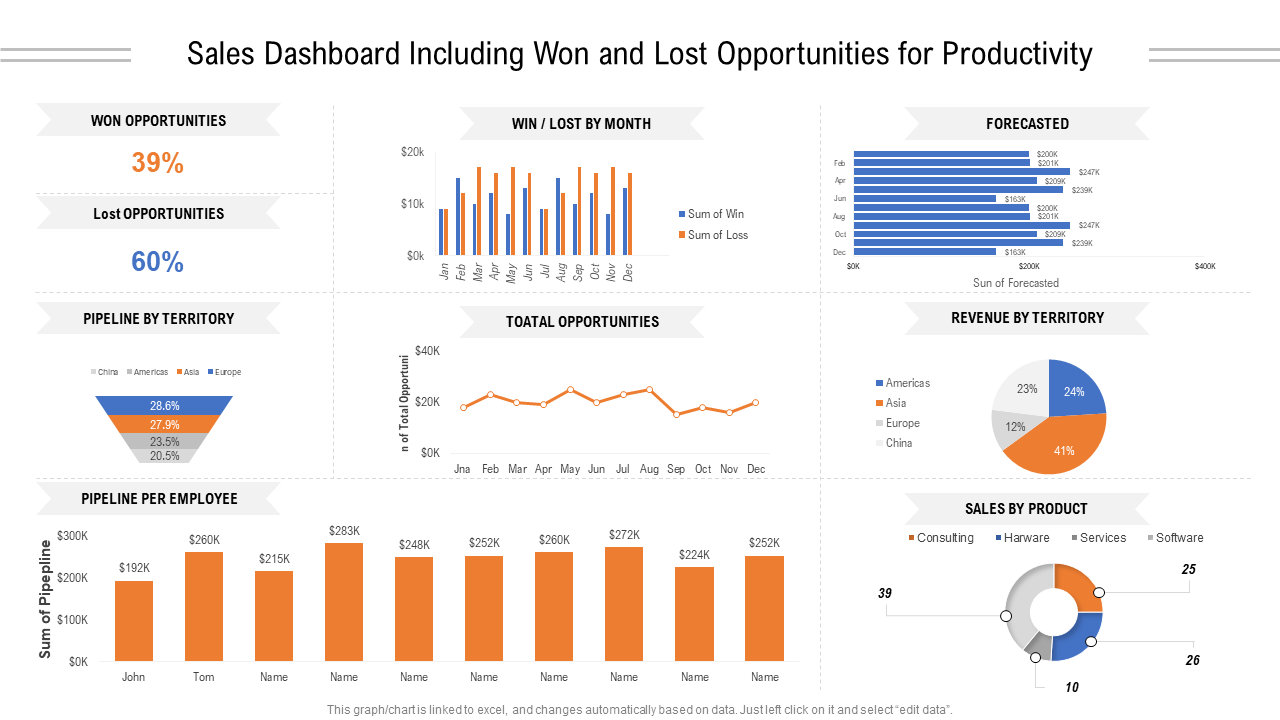
Template 3: Sales Dashboard Including Won And Lost Opportunities For Productivity
Sales dashboards provide you a quick glance at your sales metrics and KPIs and display how your sales team is doing concerning your objectives and revenue targets. You and your team can determine what activities closed a transaction or made it fall through with the help of this Sales Dashboard Slide. Download this sales summary now, and monitor what deals were successful or unsuccessful and provide a win/loss rate report.
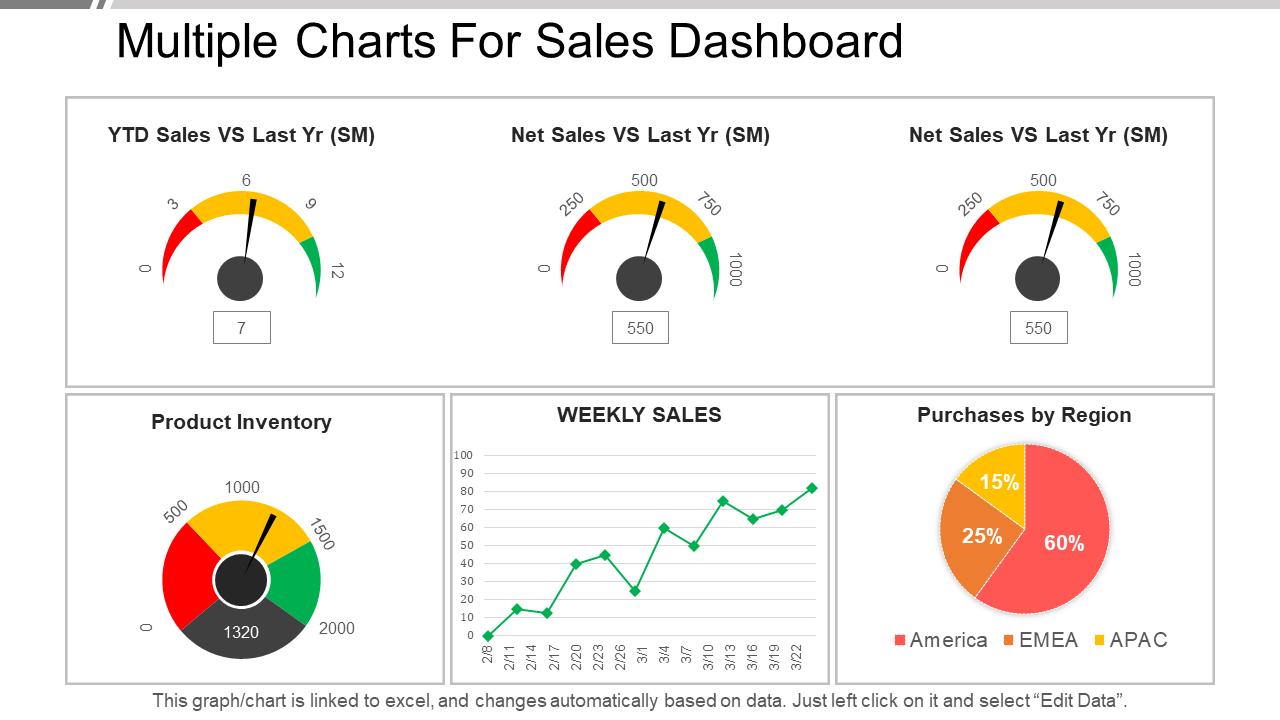
Template 4: Multiple Charts For Sales Dashboard Snapshot Presentation Pictures
With this practical Multiple charts For Sales Dashboard Snapshot Presentation Pictures, you may monitor and assess your sales performance. This sales chart PPT style enables you to assess the performance of your business over time. Save this sales chart analysis PPT slide to your computer to keep track of the contributions and effectiveness of your staff in meeting the sales targets.
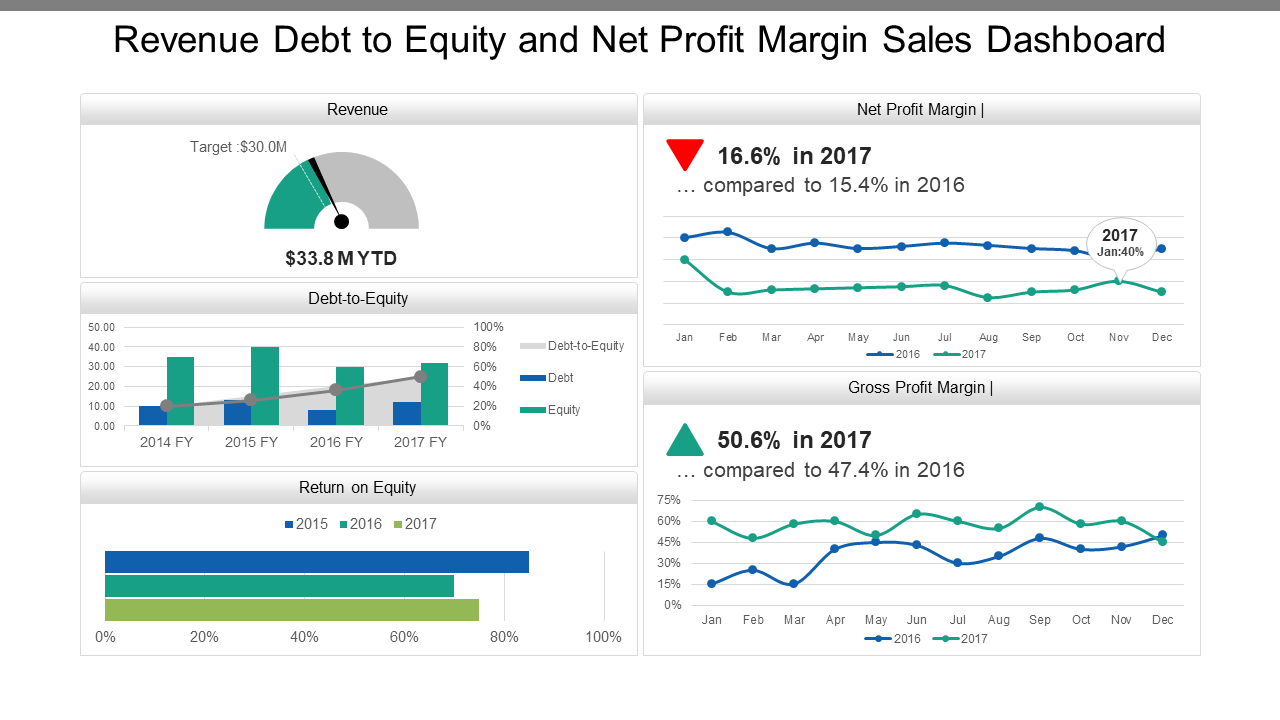
Template 5: Revenue Debt To Equity And Net Profit Margin Sales Dashboard
Use this Revenue Debt To Equity And Net Profit Margin Sales Dashboard to illustrate minute information. This premade PowerPoint Template will assist you in creating a sales plan to inform and train your staff on revenue debt to equity ratio and net profit margin. Grab this customizable dashboard to list your sales revenue, motivate employees to achieve their objectives, and to give your company a successful sales plan..
Template 6: Retail Cross Selling Strategy Sales Dashboard Gross PPT PowerPoint Presentation Professional
Cross-selling is the process of increasing the footfall that enters your retail store. This technique and increased sales strategy built on data-driven decision-making can really provide a major boost to your efforts to rope in more customers. Calculate your Lead conversion ratio, Lead-to-opportunity ratio, and much more using this Cross-Selling approach for retailers' sales dashboards using a premium PPT Template. So what are you waiting for? Acquire this readymade slide and see how well your business does.
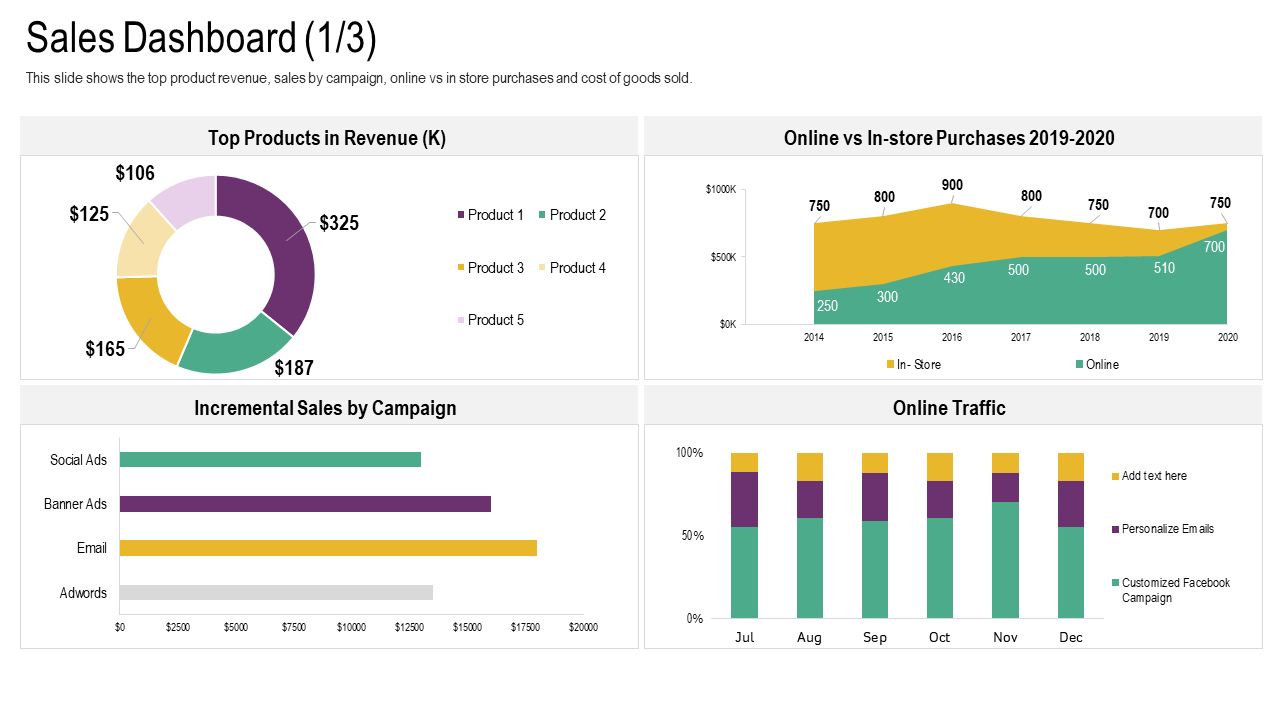
Template 7: Sales Dashboard Campaign Cross Selling Strategies PPT Icons
Deploy these innovative Sales Dashboard Campaign Cross-Selling Strategies PPT Icons to deliver awe-inspiring pitches. This is a completely editable template catering the user's needs and requirements. Making a sales strategy is a breeze with the help of these cross-selling and sales dashboard campaign PPT icons. Grab this slide to construct sales methods, and you will command the meeting with authority and attract many new consumers.
Template 8: Analyzing Implementing New Sales Qualification Sales Dashboard With Lead Conversional And Lead
Are you seeking a way to highlight the lead conversion ratio, opportunity seekers, proposals sent, and critical performing personnel for your business presentation? With this Analyzing Implementing New Sales Qualification Sales Dashboard With Lead Conversional And Lead template KPI dashboards, track your sales and performance. Employ this perfectly created slide as a conversation and navigational tool for the dashboard, conversion, and opportunity.
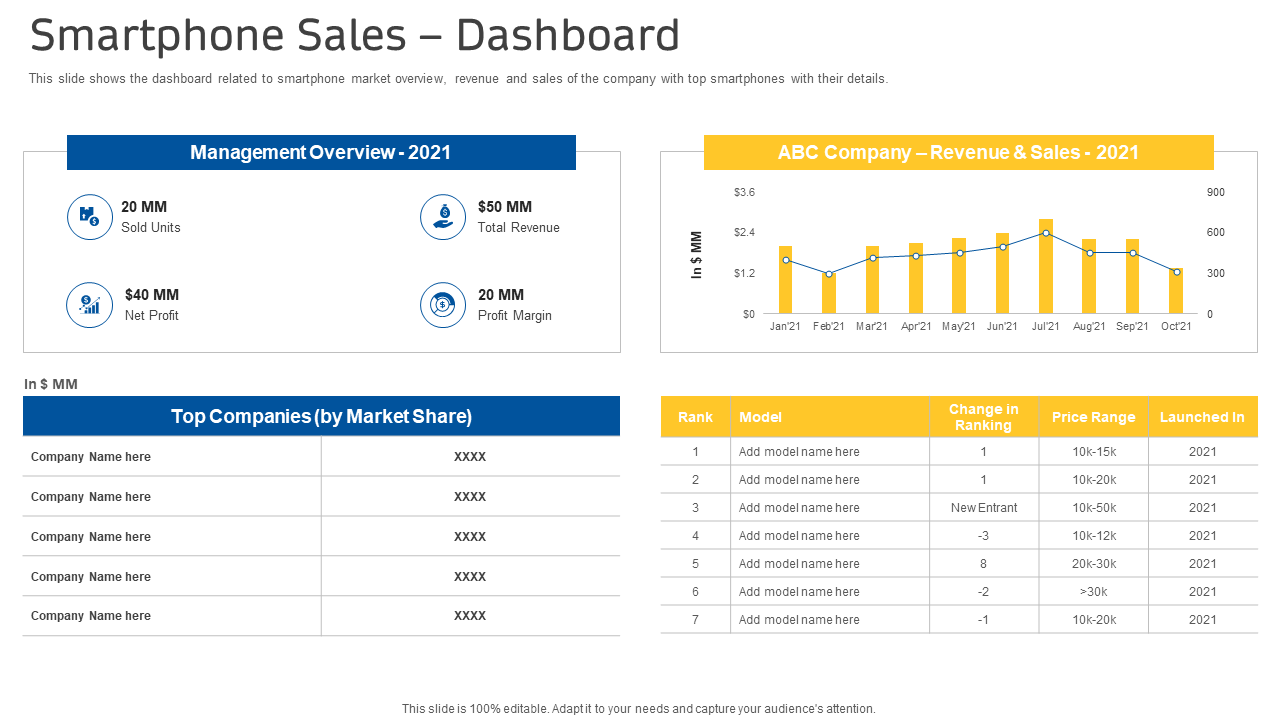
Template 9: Smartphone Sales Dashboard Decline Sales Companies Smartphone Equipment PPT Information
This slide displays the company's top cell phones' dashboard, including sales and revenue information. Use this Smartphone Sales Dashboard to provide a compelling presentation on the subject. Use these slides, disseminate information and fully explain managerial overview, market share, sales revenue, and more. You can modify and customize this template to meet your needs. Grab these readymade, customizable and perfect slides right away!
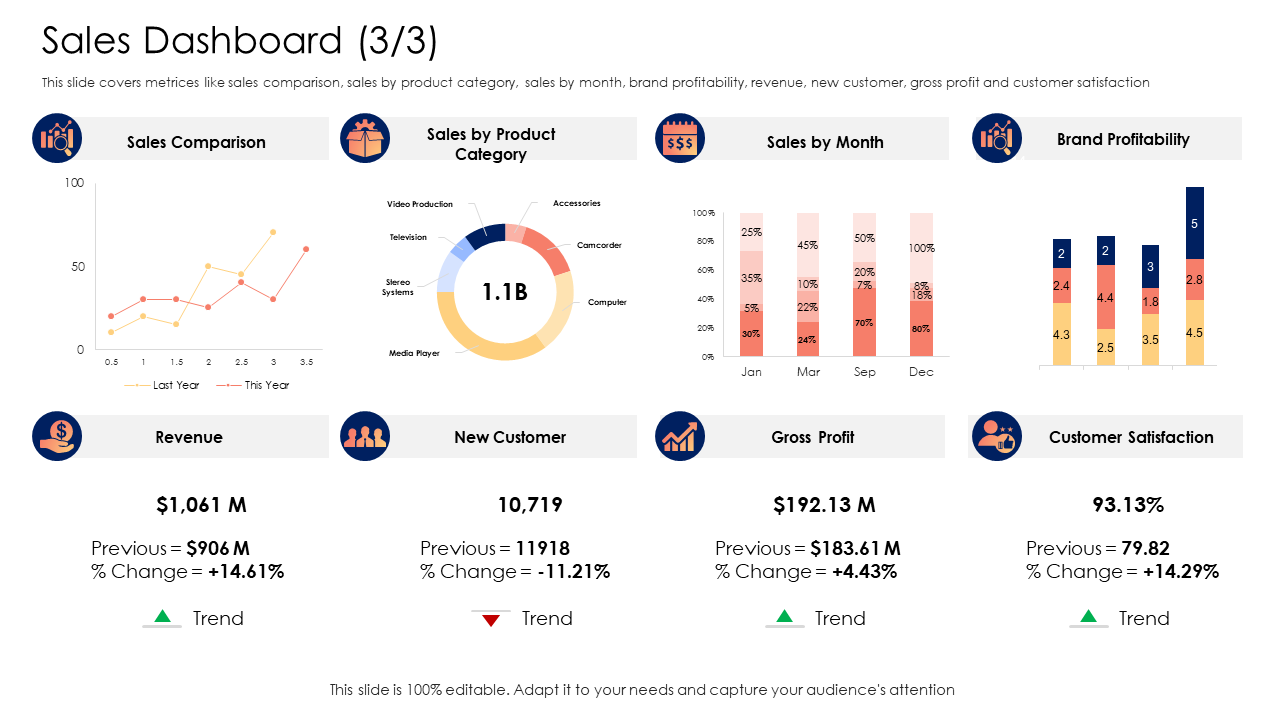
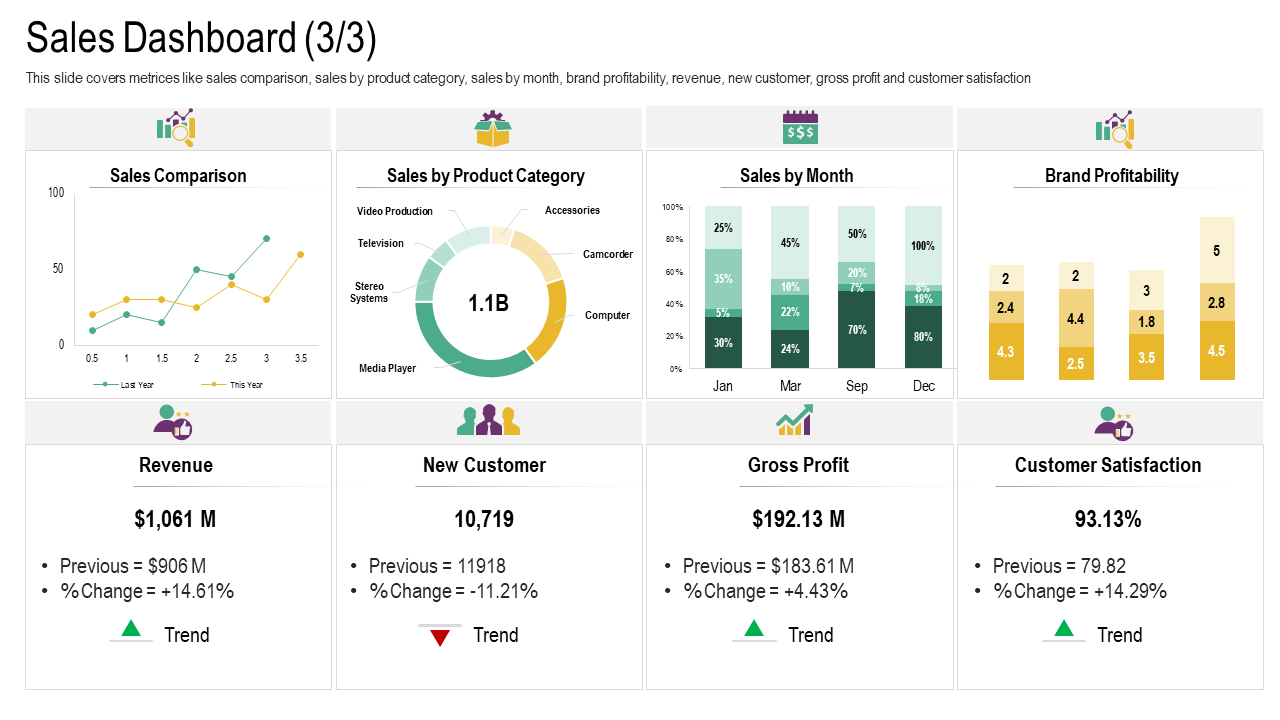
Template 10: Sales Dashboard Revenue Cross Selling Strategies PPT Pictures
This presentation covers metrics such as sales comparison, sales by product line, sales by month, brand sustainability, revenue, new customer acquisition, gross profit, conversion rate, and customer happiness. With the help of these Cross-Selling Tactics And Sales Dashboard PPT Images, elaborate on the subject and prove your expertise before a roomful of people. Use this template as a powerful navigation business weapon for revenue, brand success, sales comparison, and net income.
Grab The Perfectly Created Sales Dashboard & Build Your Clientele!
Sales is a dynamic business discipline; it can be challenging to monitor performance while you're juggling your search for the next opportunity and your endeavor to strengthen your bonds with existing clients.
Do you have a sales crew that is constantly moving about? Find out where sales representatives are spending their time and how much money they are making.
Regardless of the quantity of leads, prospects, and customers you have, using a sales dashboard is one of the best decisions you can make for your sales team.
Slide Team's sales dashboards can help you to engage your salespeople and improve outcomes to satisfy upper management. Additionally, by increasing your revenue, you can assist your business performance reach the top of its game.
Are you prepared to inspire and recognize your team and boost your sales? Grab these templates and take your business presentations to the next level.
FAQs on Sales Dashboard
What should a sales dashboard include?
A sales dashboard should include KPIs and metrics that direct your team. A sales dashboard's function is to monitor your advancement. Performance is a crucial determinant of success for sales teams, measured by sales revenue, the quantity of Sales Qualified Leads (SQLs), or completed winning transactions. There isn't a dashboard that fits everyone the same way! By definition, it in unique. When selecting your dashboard, remember your primary sales metrics and KPIs.
What is a sales dashboard?
A sales dashboard is a piece of technology that shows your current performance information as a presentation template that is both impressive and a major tool for critical, big-ticket decisions. . You may see results-based information like sales growth, sales by region, lead conversion ratio, and sales revenue. You may also examine emails sent, calls made, and the typical lead response time to outreach techniques by tracking activity-based analytics. Any business that wants to boost sales and establish aggressive growth objectives needs dashboards. Manually compiling all those metrics would be impossible, with a high chance of significant human error. The answer is a good sales dashboard.
Who uses a sales dashboard?
The sales dashboard is an essential sales instrument used by sales representatives to monitor and assess sales activities vital to reaching their goals. It is a crucial success metric. The sales performance dashboard shows the team's success, including how well they meet their sales metrics and KPIs. Sales managers, sales representatives and corporate executives are the primary users. By examining how leads are acquired and managed throughout the pipeline, the sales pipeline dashboard monitors the development of the teams and the business.




 Customer Reviews

