Dashboards Measuring PowerPoint Designs, Presentations Slides & PPT Shapes
- Sub Categories
-
- Arrows and Targets
- Bullet and Text Slides
- Charts and Graphs
- Circular Cycle Diagrams
- Concepts and Shapes
- Custom Flat Designs
- Dashboards and Measuring
- Flow Process
- Funnels
- Gears
- Growth
- Harvey Balls
- Idea Innovation and Light Bulbs
- Leadership
- Linear Process Diagrams
- Magnifying Glass
- Misc Other Graphics
- Opportunity and Handshake
- Organization Charts
- Puzzles
- Pyramids
- Roadmaps and Timelines
- Silhouettes
- Steps
- Strategic Planning Analysis
- SWOT Analysis
- Tables and Matrix
- Teamwork
- Technology and Communication
- Venn Diagrams
- Visuals and Illustrations
-
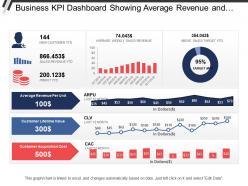 Business Kpi Dashboard Showing Average Revenue And Clv
Presenting this set of slides with name - Business Kpi Dashboard Showing Average Revenue And Clv. This is a three stage process. The stages in this process are Business Dashboard, Business Kpi, Business Performance.
-
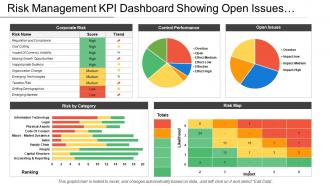 Risk Management Kpi Dashboard Showing Open Issues And Control Performance
Presenting this set of slides with name - Risk Management Kpi Dashboard Showing Open Issues And Control Performance. This is a five stage process. The stages in this process are Risk Management, Risk Assessment, Project Risk.
-
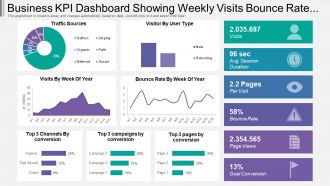 Business Kpi Dashboard Snapshot Showing Weekly Visits Bounce Rate And Traffic Source
Presentation graphic is totally compatible with Google slides. Multiple display options i.e. standard and widescreen. 100 percent editable designs to show your creativity. Similar designs available with different nodes and stages. Easy to download and convert into JPEG or PDF format. Alteration can be done in color, text and shape. Pre-designed PPT slide just download and insert it in the presentation. Quick download with easy to save. Choice to add company logo and replace text as required. High resolution quality ensures no pixilation.
-
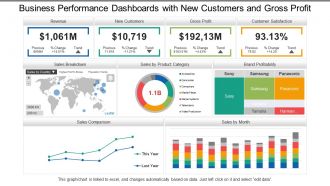 Business Performance Dashboards Snapshot With New Customers And Gross Profit
Presenting, business performance dashboards Snapshot with new customers and gross profit PowerPoint ideas for your ease. Information based slides, creating an impact on the viewer, can be used by specialists from any background, entrepreneurs, and scholars. Engaging and editable font style, type, text design and the content of the icons or the PPT slides. Full-screen view choice available and can be transformed into the desired format. Compatible with Google Slides. Open in widescreen size 16:9 after downloading.
-
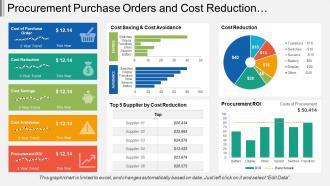 Procurement Purchase Orders And Cost Reduction Dashboard
Presenting this set of slides with name - Procurement Purchase Orders And Cost Reduction Dashboard. This is a five stage process. The stages in this process are Purchase, Procurement, Buy.
-
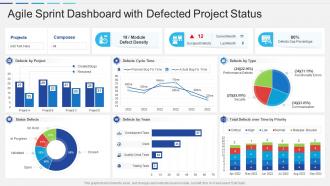 Agile sprint dashboard snapshot with defected project status
Introducing our Agile Sprint Dashboard Snapshot With Defected Project Status set of slides. The topics discussed in these slides are Team, Projects, Planned. This is an immediately available PowerPoint presentation that can be conveniently customized. Download it and convince your audience.
-
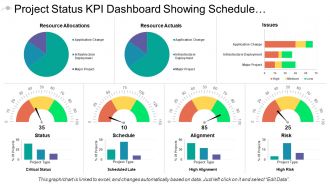 Project Status Kpi Dashboard Showing Schedule And Alignment
Presenting this set of slides with name - Project Status Kpi Dashboard Showing Schedule And Alignment. This is a seven stage process. The stages in this process are Project Health Card, Project Performance, Project Status.
-
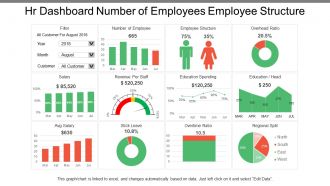 Hr Dashboard Number Of Employees Employee Structure
Presenting this set of slides with name - Hr Dashboard Number Of Employees Employee Structure. This is a four stage process. The stages in this process are Hr Dashboard, Human Resource Dashboard, Hr Kpi.
-
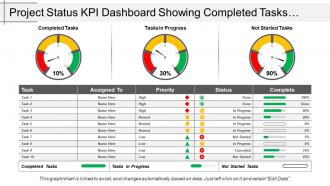 Project Status Kpi Dashboard Snapshot Showing Completed Tasks And Task In Progress
Presenting, project status kpi dashboard snapshot showing completed tasks and task in progress. This PowerPoint slide can be used by businesses experts for their business performance related presentations. The topics and the similar data shown in the flat design can be easily edited in terms of color, text, and fonts by just by heeding few steps. The color and orientation of the elements can also be changed easily. These PPT slides are cooperative with google slides.
-
 Action Plan Dashboard Example Of Ppt
Offering action plan dashboard example of PPT slide. This presentation template has been professionally designed and is fully editable in PowerPoint. You can customize the font type, font size, colors of the diagram and background color as per your requirement. The slide is fully compatible with Google Slides and can be saved in JPG or PDF format without any hassle. High quality graphics and icons ensure that there is no deteriorating in quality on enlarging their size.
-
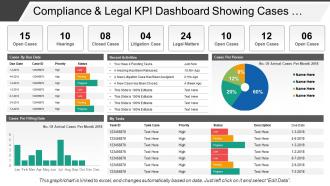 Compliance And Legal Kpi Dashboard Showing Cases By Due Date
Presenting this set of slides with name - Compliance And Legal Kpi Dashboard Showing Cases By Due Date. This is a four stage process. The stages in this process are Compliance And Legal, Legal Governance, Risk Management.
-
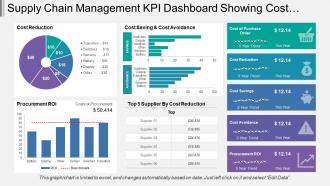 Supply Chain Management Kpi Dashboard Showing Cost Reduction And Procurement Roi
Presenting this set of slides with name - Supply Chain Management Kpi Dashboard Showing Cost Reduction And Procurement Roi. This is a five stage process. The stages in this process are Demand Forecasting, Predicting Future Demand, Supply Chain Management.
-
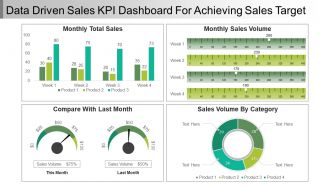 Data Driven Sales Kpi Dashboard Snapshot For Achieving Sales Target Ppt Samples
This PPT can be downloaded very conveniently on a click of a button. Your business presentation looks very professional with its use. The images used in this PPT template are 100% editable. The color, size and orientation of any icon can easily be changed in this presentation as you wish. The excel-linked chart can be edited as the shapes automatically adjusts according to your data. You can select from thousands of editable icons on each and every topic. Personalize the presentation with individual company name and logo. It can be viewed and saved in JPG or PDF format. It is fully compatible with Google slides as well.
-
 Social Media Campaign Strategy Technologies Marketing Measuring Business Framework
Introduce your topic and host expert discussion sessions with this Social Media Campaign Strategy Technologies Marketing Measuring Business Framework. This template is designed using high-quality visuals, images, graphics, etc, that can be used to showcase your expertise. Different topics can be tackled using the twelve slides included in this template. You can present each topic on a different slide to help your audience interpret the information more effectively. Apart from this, this PPT slideshow is available in two screen sizes, standard and widescreen making its delivery more impactful. This will not only help in presenting a birds-eye view of the topic but also keep your audience engaged. Since this PPT slideshow utilizes well-researched content, it induces strategic thinking and helps you convey your message in the best possible manner. The biggest feature of this design is that it comes with a host of editable features like color, font, background, etc. So, grab it now to deliver a unique presentation every time.
-
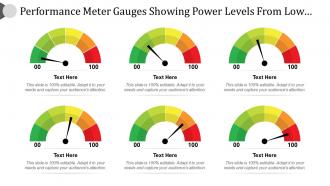 Performance meter gauges showing power levels from low high
Introducing, the performance meter gauges PowerPoint Presentation Slide. This Presentation has been designed professionally and is fully editable. You can reshape the font size, font type, colors, and even the background. This Template is amiable with Google Slide and can be saved in JPG or PDF format without any fuss created. Fast download at the click of the button.
-
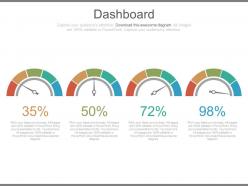 Four Dashboards Snapshot And Percentage Diagram Powerpoint Slides
It consists of high resolution ppt slides to address all business and finance related concepts. Appealing background, color, layout and font. Can be easily converted into PDF or JPG. Alluring graphs for comparison and fascinating figures to illustrate the concepts. Useful for corporate people, researchers and business professionals..
-
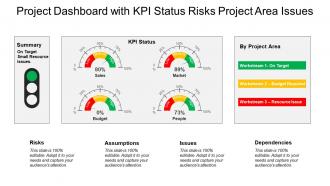 Project Dashboard Snapshot With Kpi Status Risks Project Area Issues
Presenting this set of slides with name - Project Dashboard Snapshot With Kpi Status Risks Project Area Issues. This is a four stage process. The stages in this process are Project Review, Project Analysis, Project Performance management.
-
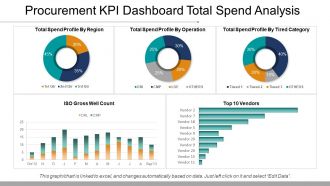 Procurement Kpi Dashboard Total Spend Analysis Ppt Samples
Presenting procurement kpi dashboard total spend analysis ppt samples. This is a procurement kpi dashboard total spend analysis ppt samples. This is a five stage process. The stages in this process are business, strategy, growth, finance, chart and graph.
-
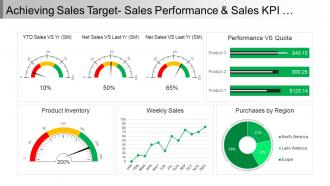 Achieving Sales Target Sales Performance And Sales Kpi Dashboard Snapshot Ppt Icon
Presenting Achieving Sales Target Sales Performance and Sales KPI Dashboard Snapshot PPT Icon. This presentation includes five stage processes with all the instructions to customize as per your needs and preferences. The stages in this process are sales objectives, sales goal, achieving sales target. You can add your brand’s name, logo or label for that extra impact. The Complete information and Enhanced Visuals are the strongest points of this Sales KPI Dashboard PPT.
-
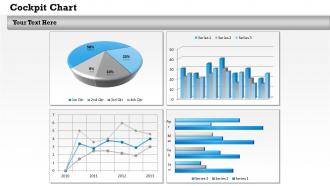 0314 Data Driven Dashboard Snapshot Design
Amendable presentation design with amazing picture quality. Modification is possible with color, text, font and shape. Excel linked design so you can make changes in the excel sheet and the design will change accordingly. Prompt download and can be changed in JPEG and PDF format. Gives a specialized effect to your Presentation template. Alternate to customize the design by adding business badge, icon and symbol. PowerPoint slide exhibited in standard and widescreen view. Useful for marketing people, corporate managers, revenue department, sales administrators, private financiers.
-
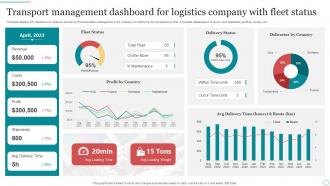 Transport Management Dashboard For Logistics Company With Fleet Status
This slide displays KPI dashboard to measure efficiency of transportation management in the company for optimizing its overall delivery time. It includes details about revenue, cost, shipments, profit by country, etc. Introducing our Transport Management Dashboard For Logistics Company With Fleet Status set of slides. The topics discussed in these slides are Profit By Country, Fleet Status, Delivery Status. This is an immediately available PowerPoint presentation that can be conveniently customized. Download it and convince your audience.
-
 Supply Chain Kpi Dashboard Powerpoint Presentation Slides
Presenting our supply chain KPI dashboard PowerPoint presentation slides. This PowerPoint design contains fifty-nine slides in it which can be completely customized and edited. It is available for both standard as well as for widescreen formats. This PowerPoint template is compatible with all the presentation software like Microsoft Office, Google Slides, etc. You can download this PPT layout from below.
-
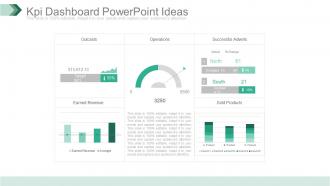 Kpi Dashboard Snapshot Powerpoint Ideas
Fabulously composed PPT design useful for business professionals, organizational experts or researchers , students and many more from diverse areas , Comprehensive and convenient PPT Images with ductile dummy data options, Consonant with all available graphic software’s and Google slides, Accessible to other file configurations like PDF or JPG. Multi-color options, background images, styles and other characteristics are fully editable, Expeditious downloading process, Allows to introduce your company logo or brand name in the PPT slides.
-
 Key Human Resource Metrics Dashboard Snapshot Ppt Slide
Presenting key human resource metrics dashboard snapshot ppt slide. This is a key human resource metrics dashboard ppt slide. This is a four stage process. The stages in this process are key health metrics, previous 4 quarters, change year over year, voluntary, turnover rate, involuntary, q, registration rate, manager instability rate, top talent turnover rate, top 3 potential areas of concern, for smb services in vancouver, for products in u k, for human resources in denver, key health metrics, previous 4 quarters, change year over year, flow through rate, headcount flow, out, in, span of control, direct compensation change.
-
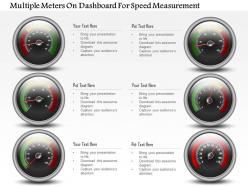 1214 Multiple Meters On Dashboard For Speed Measurement Powerpoint Slide
This template with speed meters is convenient to use. You can easily insert or remove any kind of figures or illustrations as per your requirements by simply following the instructions that have been given in the sample slides. The font size, font color and the font style that you use in the slides is 100% editable and can be changed easily as per your needs. You can get these slides in widescreen display with ratio of 16:9 by just a click. You can even upload these slides to Google Slides and they will work automatically. Also you can save the template in JPG or PDF format.
-
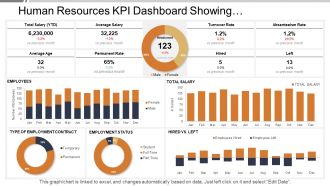 Human resources kpi dashboard showing employment status turnover rate
SlideTeam presents the Human Resources Kpi Dashboard Showing Employment Status Turnover Rate PPT which will help you keep a track of the human capital working under you. All the slides in the slideshow are 100 percent editable and you can make all the desired changes in the presentation. You can also add or delete the slides All the slides are fully compatible with Google slides as well. Your audience will be amazed by Google slides. You can even view the document in 16:9 widescreen size.
-
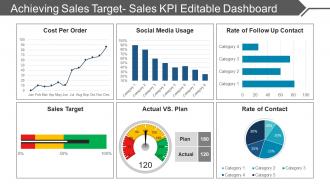 Achieving Sales Target Sales Kpi Editable Dashboard Snapshot Ppt Diagrams
Presenting achieving sales target sales kpi editable dashboard PPT diagrams. Simple data input like company logo, name or trademark. This PowerPoint theme is fully supported by Google slides. Picture quality of these slides does not change even when projected on large screen. Fast downloading speed and formats can be easily changed to JPEG and PDF applications. This template is suitable for marketing, sales persons, business managers and entrepreneurs. Adjust PPT layout, font, text and color as per your necessity.
-
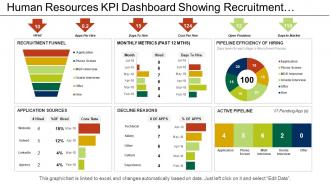 Human resources kpi dashboard showing recruitment funnel application sources
Presenting this set of slides with name - Human Resources Kpi Dashboard Showing Recruitment Funnel Application Sources. This is a six stage process. The stages in this process are Human Resource, Hrm, Human Capital.
-
 Kpi Dashboard Powerpoint Slide Images
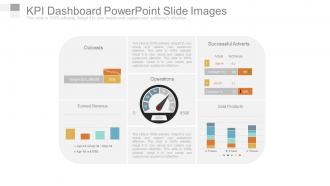
Presenting kpi dashboard powerpoint slide images. This is a kpi dashboard powerpoint slide images. This is a one stage process. The stages in this process are sold products, earned revenue, outcasts, successful adverts, operations, target, compare.
-
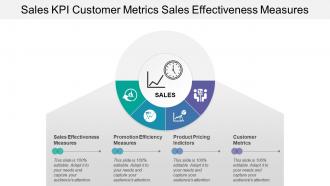 Sales kpi customer metrics sales effectiveness measures
Download this slideshow, as it is fully customizable and will adapt it to the changes you make. You can change the orientation, the size and the color of the graphical features as per your requirements. Anything can be inserted or removed from the pre-designed slides by simply following the steps given in the sample slides. Once you download the business template you can view the PPT in either widescreen display ratio of 16:9 or standard size display ratio of 4:3. The deck can be easily saved in either PDF or JPG format conveniently. So download it quickly as it is compatible with Google Slides as well.
-
 0914 Big Data Technology Icons Analytics Storage Replication Dashboard Magnify Ppt Slide
Gracefully and delicately designed PPT visual. Convenience to modify the design as per the communal constraint. Spotless quality of pictures and images used in the designing. Access to add business details such as insignia, design or portrait. Brisk download and easy to share with large set of viewers. Flexible presentation background as slickly adjustable into JPG and PDF format. Presentation illustration downloadable in standard and widescreen display view.
-
 Global cyber security or critical risk dashboard
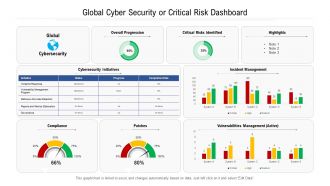
Presenting this set of slides with name Global Cyber Security Or Critical Risk Dashboard. The topics discussed in these slides are Global, Cybersecurity, Overall Progression, Critical Risks Identified, Highlights. This is a completely editable PowerPoint presentation and is available for immediate download. Download now and impress your audience.
-
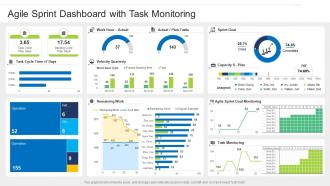 Agile sprint dashboard with task monitoring
Introducing our Agile Sprint Dashboard With Task Monitoring set of slides. The topics discussed in these slides are Plan, Goal, Product. This is an immediately available PowerPoint presentation that can be conveniently customized. Download it and convince your audience.
-
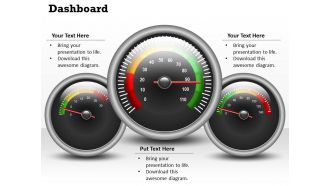 0314 Dashboard Snapshot To Compare Data
The PowerPoint presentation ensures function of editing text and diagrams color of most benefit to management professionals, big or small organizations and business startups. Features facile and user oriented features to change in the color, size and orientation in presentation slide show. Text and graphic can be featured together in the same PPT slide. Quality and standard resolution in color and art shape is offered by PPT graphic. Extends professional resolution without compromising on pixels quality.
-
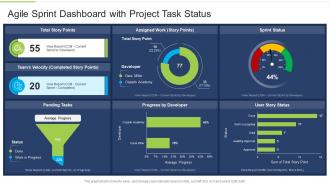 Agile sprint dashboard with project task status
Presenting our well structured Agile Sprint Dashboard With Project Task Status. The topics discussed in this slide are Average Progress, Team. This is an instantly available PowerPoint presentation that can be edited conveniently. Download it right away and captivate your audience.
-
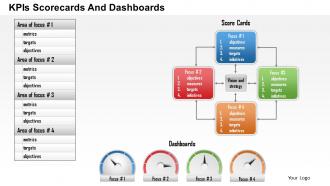 1114 Kpis Scorecards And Dashboards Powerpoint Presentation
We are proud to present our 1114 kpis scorecards and dashboards powerpoint presentation. Interconnected text box diagram has been used to decorate this power point template slide. This PPT diagram slide contains the concept of displaying KPIS score card. We have also used dashboard graphic to decorate this PPT slide.
-
 Project management agile sprint dashboard
Presenting our well structured Project Management Agile Sprint Dashboard. The topics discussed in this slide are Project, Planned. This is an instantly available PowerPoint presentation that can be edited conveniently. Download it right away and captivate your audience.
-
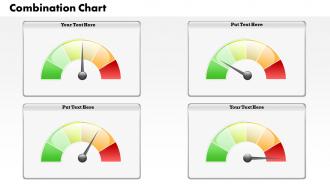 0314 Dashboard Snapshot Meter For Business Information
Businessmen, micro, small and start up enterprises can use the PPT layout to make effective comparisons. PowerPoint presentation supports differential and unique text and background color. All images used can be resized and altered in the presentation slide. Compatible with Google slides is good for PPT design. There is no space constrain in the PowerPoint design, user oriented edition of data is ensured. Smooth performance is rendered by the presentation slide show on all software’s.
-
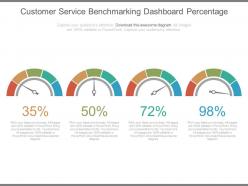 Customer service benchmarking dashboard snapshot percentage ppt slides
This PPT slide can be used by anyone looking to project their Customer Service Bench marking related ideas. This PowerPoint template is 100% editable, which means text, color, and shapes of the given elements can be altered according to your liking. These slides are also compatible with Google slides. You can edit the text section to write a short brief about the process.The stages in this process are finance, marketing, strategy, business.
-
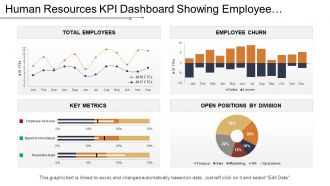 Kpi dashboard showing employee churn key metrics and open positions
Presenting this set of slides with name - Kpi Dashboard Showing Employee Churn Key Metrics And Open Positions. This is a four stage process. The stages in this process are Human Resource, Hrm, Human Capital.
-
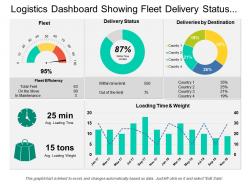 Logistics dashboard showing fleet delivery status and delivery by destination
Presenting this set of slides with name - Logistics Dashboard Showing Fleet Delivery Status And Delivery By Destination. This is a three stage process. The stages in this process are Logistics Dashboard, Logistics Kpis, Logistics Performance.
-
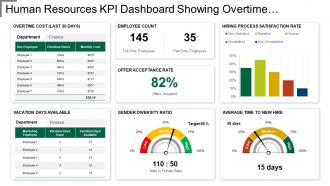 Kpi dashboard showing overtime cost gender diversity ratio
Presenting this set of slides with name - Kpi Dashboard Showing Overtime Cost Gender Diversity Ratio. This is a six stage process. The stages in this process are Human Resource, Hrm, Human Capital.
-
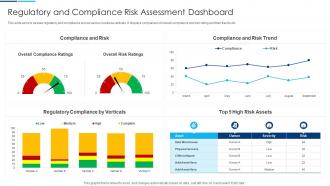 Regulatory And Compliance Risk Assessment Dashboard
This slide aims to assess regulatory and compliance across various business verticals. It displays comparison of overall compliance and risk rating and their trends etc. Introducing our Regulatory And Compliance Risk Assessment Dashboard set of slides. The topics discussed in these slides are Overall Compliance Ratings, Overall Risk Ratings, Compliance And Risk Trend. This is an immediately available PowerPoint presentation that can be conveniently customized. Download it and convince your audience.
-
 Kpi dashboard snapshot icon
Presenting this set of slides with name - Kpi Dashboard Snapshot Icon. This is a three stage process. The stages in this process are Metrics Icon, Kpi Icon, Statistics Icon.
-
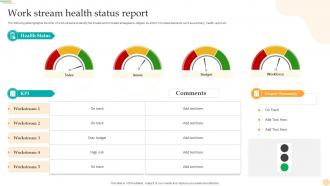 Work Stream Health Status Report
The following slide highlights the KPIs of work streams to identify the threats and formulate strategies to mitigate its effect. It includes elements such as summary, health report etc. Presenting our well-structured Work Stream Health Status Report. The topics discussed in this slide are Sales, Issues, Workforce, Budget. This is an instantly available PowerPoint presentation that can be edited conveniently. Download it right away and captivate your audience.
-
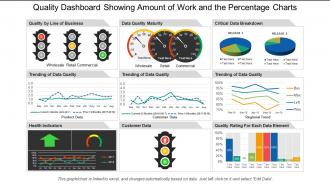 Quality dashboard snapshot showing customer product data with data quality
SlideTeam feels immense pleasure in presenting to you its 100% customizable and user-friendly quality dashboard snapshot showing customer data with data quality. The business slides can be viewed in widescreen display ratio of 16:9 or standard size display ratio of 4:3 after being downloaded. The PPT presentation lets you insert or remove any given feature from the redesigned set of slides. You can also save the slideshow in format of PDF or JPG and also it is compatible with Google Slides. So hit download, edit it and present it.
-
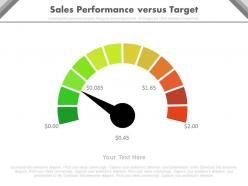 Ppt sales performance versus target indicator dial dashboard powerpoint slides
High resolution Dial Dashboard Diagram doesn’t pixel ate, while being projected on big screen. Easy to embed company logo/ trademark. Well compatible with Google slides. Quick and easy downloading process. Amendable font style, design and the content of the icons or the PPT Slides. Valuable for entrepreneurs, students, researchers and employees.
-
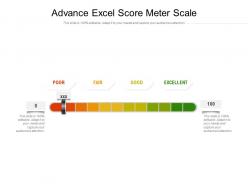 Advance excel score meter scale
Presenting our Advance Excel Score Meter Scale PowerPoint Presentation Slide. This is a completely adaptable PPT slide that allows you to add images, charts, icons, tables, and animation effects according to your requirements. Create and edit your text in this 100% customizable slide. You can change the orientation of any element in your presentation according to your liking. The slide is available in both 4:3 and 16:9 aspect ratios. This PPT presentation is also compatible with Google Slides.
-
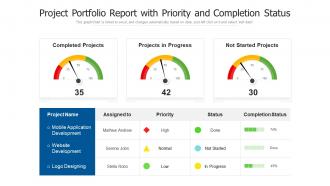 Project portfolio report with priority and completion status
This graph or chart is linked to excel, and changes automatically based on data. Just left click on it and select edit data. Introducing our premium set of slides with Project Portfolio Report With Priority And Completion Status. Elucidate the three stages and present information using this PPT slide. This is a completely adaptable PowerPoint template design that can be used to interpret topics like Completed Projects, Projects In Progress, Mobile Application Development. So download instantly and tailor it with your information.
-
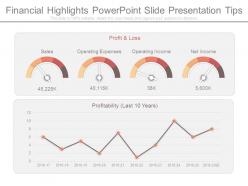 Financial highlights powerpoint slide presentation tips
Presenting financial highlights powerpoint slide presentation tips. This is a financial highlights powerpoint slide presentation tips. This is a four stage process. The stages in this process are sales, operating expenses, operating income, net income, profitability.
-
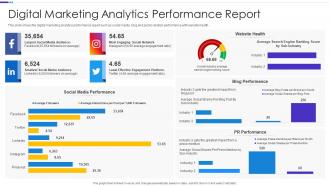 Digital Marketing Analytics Performance Report
This slide shows the digital marketing analytics performance report such as social media, blog and public relation performance with website health. Introducing our Digital Marketing Analytics Performance Report set of slides. The topics discussed in these slides are Social Media Performance, Website Health, Blog Performance. This is an immediately available PowerPoint presentation that can be conveniently customized. Download it and convince your audience.
-
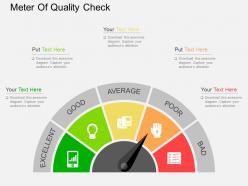 Lo meter of quality check flat powerpoint design
Completely editable presentation design i.e. fonts, visuals, text and color. PPT slide goes well with Google slides. Excellence in picture quality. Presentation design can be displayed in standard and widescreen view. Personalize the presentation with individual company name and logo. PPT template is fully editable to allow customization. Simple to download and convert into PDF format.
-
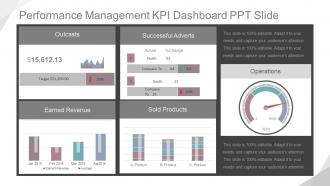 Performance Management Kpi Dashboard Snapshot Ppt Slide
Presenting performance management kpi dashboard snapshot ppt slide. This is a performance management kpi dashboard ppt slide. This is a five stage process. The stages in this process are product, sold products, compare to, south, north, actual, change, successful adverts, jan, feb, mar, apr, earned revenue, average, target, outcasts, operations.
-
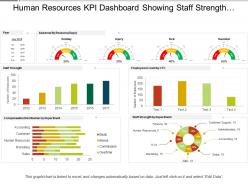 Human resources kpi dashboard showing staff strength compensation distribution
SlideTeam presenting Human Resources Kpi Dashboard Showing Staff Strength Compensation Distribution PPT. It will not only help you in knowing the exact strength of the staff but also about actual staff required in the organization. This slideshow is entirely editable and you can edit it whenever you want. All the slides in this presentation are compatible with Google slides. You can enter thousands of relatable icons of your own choice. You can also change from 4:3 standard screen size to 16:9 widescreen size.
-
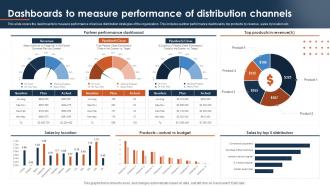 Dashboards To Measure Performance Multichannel Distribution System To Meet Customer Demand
This slide covers the dashboards to measure performance of various distribution strategies of the organization. This includes partner performance dashboards, top products by revenue, sales by location etc. Present the topic in a bit more detail with this Dashboards To Measure Performance Multichannel Distribution System To Meet Customer Demand. Use it as a tool for discussion and navigation on Partner Performance Dashboard, Top Products Revenue. This template is free to edit as deemed fit for your organization. Therefore download it now.
-
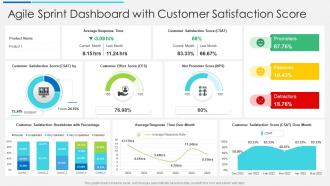 Agile sprint dashboard with customer satisfaction score
Presenting our well structured Agile Sprint Dashboard With Customer Satisfaction Score. The topics discussed in this slide are Average, Product, Customer. This is an instantly available PowerPoint presentation that can be edited conveniently. Download it right away and captivate your audience.
-
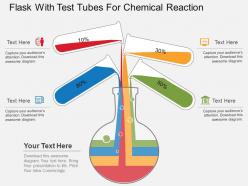 Flask with testtubes for chemical reaction flat powerpoint desgin
Scalable graphics and the icons. The icons attune well with the Google slides or Microsoft PowerPoint template. Access to edit the icons, colours or the style of the slides. No compromise with the icon quality when opened on a wide screen. Edit or use your brand’s name as a watermark. Allowed to save in the JPG or PDF format. A must have for the entrepreneurs, marketing professionals and the business presenters.
-
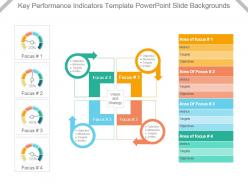 Key performance indicators template powerpoint slide backgrounds
Excellent use colors in the presentation template. Imaginatively created PowerPoint shape with modification options. Easily adjustable PPT slide as can be converted into JPG and PDF format. Conforming designs accessible to different nodes and stages. Great pixel quality as image quality remains relentless on every screen size. Choice to reveal slide in standard 4:3 widescreen 16:9 view. Presentation graphic suitable with Google slides. Fast download saves valuable time. Makes it easier to share the information with ease with large set of viewers. Easy to portray the KRAs related to the work.
-
 Human resources kpi dashboard showing employee number by salary staff composition
Presenting this set of slides with name - Human Resources Kpi Dashboard Showing Employee Number By Salary Staff Composition. This is a four stage process. The stages in this process are Human Resource, Hrm, Human Capital.
-
 Gh clock with dollar symbol and arrows flat powerpoint design
Modifiable PPT Slide with clock with dollar symbol and arrows. Provides a professional outlook to your PowerPoint presentation. Icons are also added. Convertible into numerous format options like JPEG, JPG or PDF. Multiple display option such as standard and widescreen view. Customization of each PowerPoint graphic and text according to your desire and want. Freedom to customize it with company name and logo. Beneficial for business professionals, students, teachers, business analysts and strategists. Compatible with google slides as well.


