Dashboards Measuring PowerPoint Designs, Presentations Slides & PPT Shapes
- Sub Categories
-
- Arrows and Targets
- Bullet and Text Slides
- Charts and Graphs
- Circular Cycle Diagrams
- Concepts and Shapes
- Custom Flat Designs
- Dashboards and Measuring
- Flow Process
- Funnels
- Gears
- Growth
- Harvey Balls
- Idea Innovation and Light Bulbs
- Leadership
- Linear Process Diagrams
- Magnifying Glass
- Misc Other Graphics
- Opportunity and Handshake
- Organization Charts
- Puzzles
- Pyramids
- Roadmaps and Timelines
- Silhouettes
- Steps
- Strategic Planning Analysis
- SWOT Analysis
- Tables and Matrix
- Teamwork
- Technology and Communication
- Venn Diagrams
- Visuals and Illustrations
-
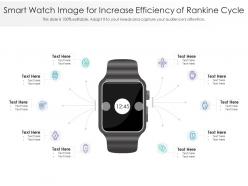 Smart watch image for increase efficiency of rankine cycle infographic template
This is our Smart Watch Image For Increase Efficiency Of Rankine Cycle Infographic Template designed in PowerPoint, however, you can also access it in Google Slides. It comes in two aspect ratios standard and widescreen, with fully editable visual content.
-
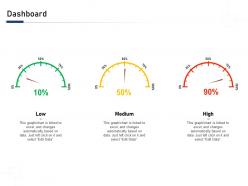 Dashboard building blocks an organization a complete guide ppt elements
Increase audience engagement and knowledge by dispensing information using Dashboard Building Blocks An Organization A Complete Guide Ppt Elements. This template helps you present information on three stages. You can also present information on Dashboard, Low, Medium, High using this PPT design. This layout is completely editable so personaize it now to meet your audiences expectations.
-
 Lean Process Productivity Improvement Icon
Introducing our premium set of slides with Lean Process Productivity Improvement Icon. Elucidate the three stages and present information using this PPT slide. This is a completely adaptable PowerPoint template design that can be used to interpret topics like Lean Process Productivity, Improvement, Icon. So download instantly and tailor it with your information.
-
 Stack of coins on table with pens
Presenting this set of slides with name - Stack Of Coins On Table With Pens. This is a three stage process. The stages in this process are Stack Of Coins, Queue Of Penny, Pile Of Coins.
-
 Prioritizing workload and key tasks table ppt powerpoint presentation outline outfit
Presenting this set of slides with name Prioritizing Workload And Key Tasks Table Ppt Powerpoint Presentation Outline Outfit. This is a one stage process. The stages in this process are Planning, Time, Analysis, Business, Marketing. This is a completely editable PowerPoint presentation and is available for immediate download. Download now and impress your audience.
-
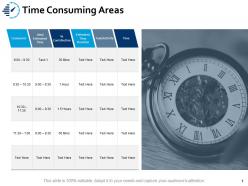 Time consuming areas time ppt powerpoint presentation visual aids summary
Presenting this set of slides with name Time Consuming Areas Time Ppt Powerpoint Presentation Visual Aids Summary. This is a one stage process. The stages in this process are Planning, Time, Analysis, Business, Marketing. This is a completely editable PowerPoint presentation and is available for immediate download. Download now and impress your audience.
-
 How to build the ultimate client experience calculate net promoter score ppt pictures slides
The Net Promoter Score measures the willingness of customers to recommend the companys products or services to others. It helps in gauging the customers overall satisfaction with the companys product or service. Introducing How To Build The Ultimate Client Experience Calculate Net Promoter Score Ppt Pictures Slides to increase your presentation threshold. Encompassed with one stages, this template is a great option to educate and entice your audience. Dispence information on Detractors, Passives, Promoter, using this template. Grab it now to reap its full benefits.
-
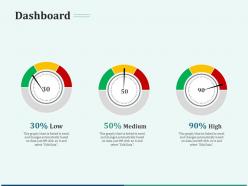 Pitch deck for early stage funding dashboard ppt layouts infographics
Present the topic in a bit more detail with this Pitch Deck For Early Stage Funding Dashboard Ppt Layouts Infographics. Use it as a tool for discussion and navigation on Low,Medium,High. This template is free to edit as deemed fit for your organization. Therefore download it now.
-
 Meter Gauge Icon For Energy Consumption
Presenting our set of slides with name Meter Gauge Icon For Energy Consumption. This exhibits information on three stages of the process. This is an easy-to-edit and innovatively designed PowerPoint template. So download immediately and highlight information on Meter Gauge Icon, Energy Consumption.
-
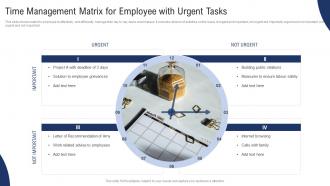 Time Management Matrix For Employee With Urgent Tasks
This slide shows matrix for employee to effectively and efficiently manage their day to day tasks at workplace. It includes division of activities on the basis of urgent and important, not urgent but important, urgent and not important, not urgent and not important. Introducing our premium set of slides with Time Management Matrix For Employee With Urgent Tasks. Elucidate the four stages and present information using this PPT slide. This is a completely adaptable PowerPoint template design that can be used to interpret topics like Time Management, Matrix, Employee, Urgent Tasks. So download instantly and tailor it with your information.
-
 Disciplined Agile Implementation For Project Management Icon
Introducing our premium set of slides with Disciplined Agile Implementation For Project Management Icon. Elucidate the three stages and present information using this PPT slide. This is a completely adaptable PowerPoint template design that can be used to interpret topics like Disciplined Agile Implementation, Project Management Icon. So download instantly and tailor it with your information.
-
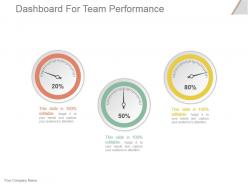 Dashboard for team performance powerpoint slide graphics
Presenting dashboard for team performance powerpoint slide graphics. This is a dashboard for team performance powerpoint slide graphics. This is a three stage process. The stages in this process are dashboard, business, finance, strategy, marketing.
-
 Powerpoint template and background with time to win business
Tackle crucial topics like a professional by downloading our Powerpoint Template And Background With Time To Win Business. This user-friendly PPT can be customized easily to meet your business needs. This ready-made template is loaded with high-resolution graphics and illustrations. It gives a professional touch to dull presentations and make them more engaging. You can describe the charts and other complex data in an understandable format by introducing this layout. Take your presentation a notch higher with our professionally designed Powerpoint Template And Background With Time To Win Business. This template helps improve your brainstorming sessions by discussing the subject matter in detail. You can incorporate this PPT for several uses and keep your data on point yet notably presentable. Boost your presentation with this modern-looking PowerPoint theme and increase your success rate like never before. With this entirely editable PPT, you can make sure that the purpose of your slide is well served. Meet the client requirements without wasting time by presenting this template.
-
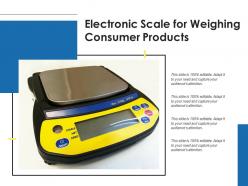 Electronic scale for weighing consumer products
Introducing our premium set of slides with name Electronic Scale For Weighing Consumer Products. Elucidate the one stage and present information using this PPT slide. This is a completely adaptable PowerPoint template design that can be used to interpret topics like Electronic Scale For Weighing Consumer Products. So download instantly and tailor it with your information.
-
 Powerpoint template and background with speedometer shows win metaphor
Tackle crucial topics like a professional by downloading our Powerpoint Template And Background With Speedometer Shows Win Metaphor. This user-friendly PPT can be customized easily to meet your business needs. This ready-made template is loaded with high-resolution graphics and illustrations. It gives a professional touch to dull presentations and make them more engaging. You can describe the charts and other complex data in an understandable format by introducing this layout. Take your presentation a notch higher with our professionally designed Powerpoint Template And Background With Speedometer Shows Win Metaphor. This template helps improve your brainstorming sessions by discussing the subject matter in detail. You can incorporate this PPT for several uses and keep your data on point yet notably presentable. Boost your presentation with this modern-looking PowerPoint theme and increase your success rate like never before. With this entirely editable PPT, you can make sure that the purpose of your slide is well served. Meet the client requirements without wasting time by presenting this template.
-
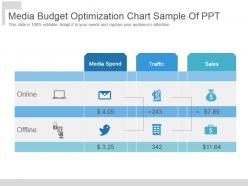 Media budget optimization chart sample of ppt
Presenting media budget optimization chart sample of ppt. This is a media budget optimization chart sample of ppt. This is a two stage process. The stages in this process are media spend, traffic, sales, online, offline.
-
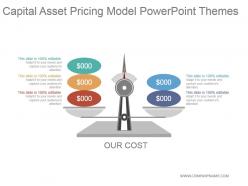 Capital asset pricing model powerpoint themes
Presenting capital asset pricing model powerpoint themes. This is a capital asset pricing model powerpoint themes. This is a two stage process. The stages in this process are our cost.
-
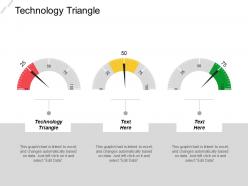 Technology triangle ppt powerpoint presentation gallery information cpb
Presenting this set of slides with name - Technology Triangle Ppt Powerpoint Presentation Gallery Information Cpb. This is an editable three stages graphic that deals with topics like Technology Triangle to help convey your message better graphically. This product is a premium product available for immediate download, and is 100 percent editable in Powerpoint. Download this now and use it in your presentations to impress your audience.
-
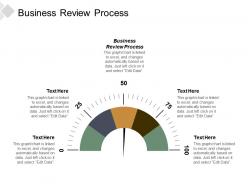 Business review process ppt powerpoint presentation infographics layout ideas cpb
Presenting this set of slides with name - Business Review Process Ppt Powerpoint Presentation Infographics Layout Ideas Cpb. This is an editable five stages graphic that deals with topics like Business Review Process to help convey your message better graphically. This product is a premium product available for immediate download, and is 100 percent editable in Powerpoint. Download this now and use it in your presentations to impress your audience.
-
 Launch monitoring dashboard snapshot ppt slides visual aids
Presenting this set of slides with name - Launch Monitoring Dashboard Snapshot Ppt Slides Visual Aids. This is a three stage process. The stages in this process are Dashboard, Business, Management, Marketing.
-
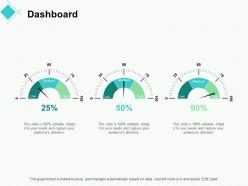 Dashboard strategy ppt powerpoint presentation professional good
Presenting this set of slides with name - Dashboard Strategy Ppt Powerpoint Presentation Professional Good. This is a three stage process. The stages in this process are Dashboard, Analysis, Business, Investment, Marketing.
-
 Vintage pocket chain clock for watching time
Presenting this set of slides with name Vintage Pocket Chain Clock For Watching Time. This is a one stage process. The stages in this process are Vintage Pocket Chain Clock For Watching Time. This is a completely editable PowerPoint presentation and is available for immediate download. Download now and impress your audience.
-
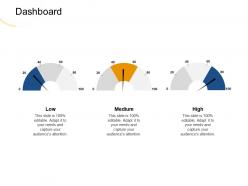 Dashboard medium m1962 ppt powerpoint presentation infographics objects
Presenting this set of slides with name Dashboard Medium M1962 Ppt Powerpoint Presentation Infographics Objects. This is a three stage process. The stages in this process are Low, Medium, High. This is a completely editable PowerPoint presentation and is available for immediate download. Download now and impress your audience.
-
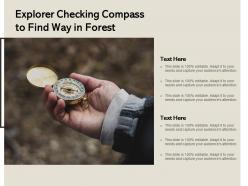 Explorer checking compass to find way in forest
Presenting this set of slides with name Explorer Checking Compass To Find Way In Forest. This is a one stage process. The stage in this process is Explorer Checking Compass To Find Way In Forest. This is a completely editable PowerPoint presentation and is available for immediate download. Download now and impress your audience.
-
 Template with ecstatic happiness depicted on a speedometer with red needle speeding past each word
Are you looking for inspirational design ideas or a fully equipped template for your next presentation Then this Template With Ecstatic Happiness Depicted On A Speedometer With Red Needle Speeding Past Each Word is an ideal fit for your next delivery. Portray your principal ideas and make your presentation stand out with this design. Make your audience fully aware of the concept by presenting information in an accessible way. The streamlined layout of this design will help your audience understand and retain the complicated idea thereby making it an impactful delivery. It can be used in businesses and organizations such as corporal presentations case studies reports marketing or any other academic presentation to make your message clear and distinctive. This PPT is designed as per the emerging trends in the marketplace and therefore you will face no difficulty in adapting it to your setting. The high resolution graphics and images make it free from any form of pixelation thus making your presentation delivery an absolute success.
-
 Powerpoint template and with financial crisis currency business framework model
Boost your presentation and its significance with this neatly presented Powerpoint Template And With Financial Crisis Currency Business Framework Model. This is a sharp professional presentation design that adheres to the standards of user friendliness and utility. It includes built in sections laden with content to help you portray important information with ease. Its versatility and flexibility is something that can help you take your presentation off the charts. Also an assortment of customizations that this layout responds to is noteworthy. Since it is a user friendly template it is suitable for any setting whether it is business academic or personal. With pre loaded graphics images content etc. it is very simple to use and include in your operations. Also presenting complex information and data in an easy to interpret format is one of the most notable features of this design that can be altered to fit your needs. Use it on multiple occasions as once downloaded this template can be saved for future portrayal.
-
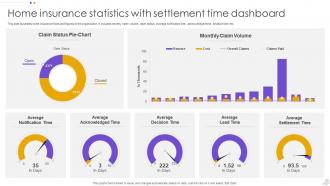 Home Insurance Statistics With Settlement Time Dashboard
This slide illustrates home insurance facts and figures of the organization. It includes monthly claim volume, claim status, average notification time, acknowledged time, decision time etc. Presenting our well structured Home Insurance Statistics With Settlement Time Dashboard. The topics discussed in this slide are Average Notification, Average Decision Time, Average Lead Time. This is an instantly available PowerPoint presentation that can be edited conveniently. Download it right away and captivate your audience.
-
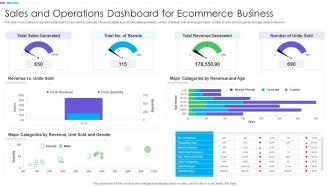 Sales And Operations Dashboard For Ecommerce Business
This slide covers sales and operations dashboard for ecommerce business. It involves details such as total sales generated, number of brands, total revenue generated, number of units sold and gender and age range breakdown. Introducing our Sales And Operations Dashboard For Ecommerce Business set of slides. The topics discussed in these slides are Sales And Operations, Dashboard, Ecommerce Business. This is an immediately available PowerPoint presentation that can be conveniently customized. Download it and convince your audience.
-
 B2b intent marketing features adoption b2b display marketing cpb
Presenting this set of slides with name - B2b Intent Marketing Features Adoption B2b Display Marketing Cpb. This is an editable three stages graphic that deals with topics like B2b Intent Marketing Features, Adoption B2b Display Marketing to help convey your message better graphically. This product is a premium product available for immediate download, and is 100 percent editable in Powerpoint. Download this now and use it in your presentations to impress your audience.
-
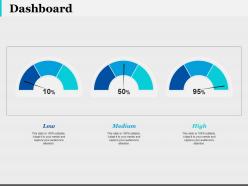 Dashboard snapshot low ppt infographic template infographic template
This is a three stage process. The stages in this process are Finance, Low, Medium, High, Marketing.
-
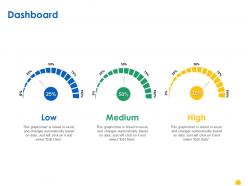 Dashboard high m162 ppt powerpoint presentation file diagrams
Presenting this set of slides with name Dashboard High M162 Ppt Powerpoint Presentation File Diagrams. This is a three stage process. The stages in this process are Low, Medium, High. This is a completely editable PowerPoint presentation and is available for immediate download. Download now and impress your audience.
-
 Business plan performance depicted via graph
Presenting this set of slides with name Business Plan Performance Depicted Via Graph. This is a three stage process. The stages in this process are Business Plan Performance Depicted Via Graph. This is a completely editable PowerPoint presentation and is available for immediate download. Download now and impress your audience.
-
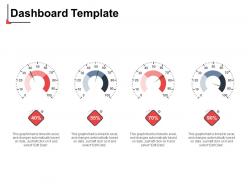 Dashboard template percentage n24 ppt powerpoint presentation styles smartart
Presenting this set of slides with name Dashboard Template Percentage N24 Ppt Powerpoint Presentation Styles Smartart. This is a four stage process. The stages in this process are Dashboard Template, Measure. This is a completely editable PowerPoint presentation and is available for immediate download. Download now and impress your audience.
-
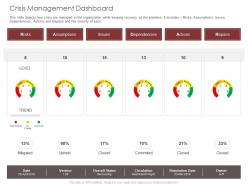 Crisis management dashboard level ppt powerpoint presentation infographics master slide
This slide depicts how crisis are managed in the organization while keeping recovery as the priorities. It includes Risks, Assumptions, Issues, Dependencies, Actions and Repairs and the severity of each. Presenting this set of slides with name Crisis Management Dashboard Level Ppt Powerpoint Presentation Infographics Master Slide. This is a six stage process. The stages in this process are Risks, Assumptions, Issues, Level, Trend. This is a completely editable PowerPoint presentation and is available for immediate download. Download now and impress your audience.
-
 Icon of speedometer in automobile dashboard
Presenting this set of slides with name Icon Of Speedometer In Automobile Dashboard. This is a three stage process. The stages in this process are Icon Of Speedometer In Automobile Dashboard. This is a completely editable PowerPoint presentation and is available for immediate download. Download now and impress your audience.
-
 Powerpoint template and background with apple and banana with measure tape
The most important feature of any presentation is its content that helps you reinforce your message more competently and widely. Similarly the design is also something that your presentation should pay attention to as it helps in keeping your audience hooked and interested. This Powerpoint Template And Background With Apple And Banana With Measure Tape offers both credible content and design beautifully merged into one another to make a powerful delivery. Use this layout to help your presentation look inspiring and professional without designing everything from scratch. Its cutting edge design and informative content will make complex data presentation easier thereby helping you impress your audience. It is also fully editable so it will meet your audiences standards without any difficulty. Everything is alterable giving you a lot of customizable options right from tweaking content to graphics. Also the feature of multiple applications which this template offers is commendable. Therefore get your hands on this template now by clicking on the download button.
-
 An old fashioned brass compass on a treasure map background
The most important feature of any presentation is its content that helps you reinforce your message more competently and widely. Similarly the design is also something that your presentation should pay attention to as it helps in keeping your audience hooked and interested. This An Old Fashioned Brass Compass On A Treasure Map Background offers both credible content and design beautifully merged into one another to make a powerful delivery. Use this layout to help your presentation look inspiring and professional without designing everything from scratch. Its cutting edge design and informative content will make complex data presentation easier thereby helping you impress your audience. It is also fully editable so it will meet your audiences standards without any difficulty. Everything is alterable giving you a lot of customizable options right from tweaking content to graphics. Also the feature of multiple applications which this template offers is commendable. Therefore get your hands on this template now by clicking on the download button.
-
 Heat caused by high temperature icon
Presenting this set of slides with name Heat Caused By High Temperature Icon. This is a three stage process. The stages in this process are Heat Caused By High Temperature Icon. This is a completely editable PowerPoint presentation and is available for immediate download. Download now and impress your audience.
-
 Temperature icon for premise climate control with airflow
Presenting this set of slides with name Temperature Icon For Premise Climate Control With Airflow. This is a three stage process. The stages in this process are Temperature Icon For Premise Climate Control With Airflow. This is a completely editable PowerPoint presentation and is available for immediate download. Download now and impress your audience.
-
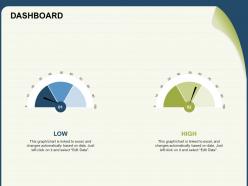 Dashboard Snapshot low high data n176 powerpoint presentation graphics template
Presenting this set of slides with name Dashboard Snapshot Low High Data N176 Powerpoint Presentation Graphics Template. This is a two stage process. The stages in this process are Dashboard. This is a completely editable PowerPoint presentation and is available for immediate download. Download now and impress your audience.
-
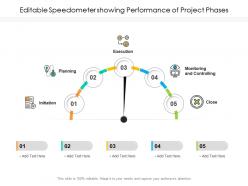 Editable speedometer showing performance of project phases
Presenting this set of slides with name Editable Speedometer Showing Performance Of Project Phases. The topics discussed in these slides are Initiation, Planning, Execution. This is a completely editable PowerPoint presentation and is available for immediate download. Download now and impress your audience.
-
 Risk Management Introduction And Assessment Dashboard Icon
Introducing our premium set of slides with Risk Management Introduction And Assessment Dashboard Icon. Ellicudate the four stages and present information using this PPT slide. This is a completely adaptable PowerPoint template design that can be used to interpret topics like Risk Management Introduction And Assessment Dashboard Icon. So download instantly and tailor it with your information.
-
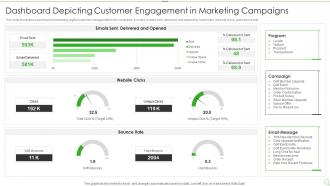 Dashboard Depicting Customer Engagement In Marketing Campaigns
This slide illustrates a dashboard showcasing digital customer management in the campaign. It covers emails sent, delivered, and opened by customers, website clicks, and bounce rate. Introducing our Dashboard Depicting Customer Engagement In Marketing Campaigns set of slides. The topics discussed in these slides are Program, Campaign, Email Message. This is an immediately available PowerPoint presentation that can be conveniently customized. Download it and convince your audience.
-
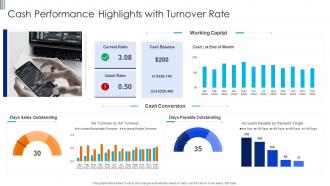 Cash Performance Highlights With Turnover Rate
Present the topic in a bit more detail with this Cash Performance Highlights With Turnover Rate. Use it as a tool for discussion and navigation on Payable Outstanding, Sales Outstanding, Cash Conversion. This template is free to edit as deemed fit for your organization. Therefore download it now.
-
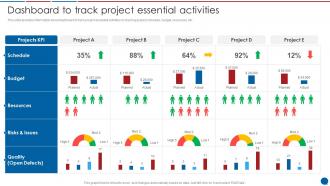 Dashboard To Track Project Essential Activities Stakeholder Communication Plan
This slide provides information about dashboard to track project essential activities by tracking project schedule, budget, resources, etc. Present the topic in a bit more detail with this Dashboard To Track Project Essential Activities Stakeholder Communication Plan. Use it as a tool for discussion and navigation on Dashboard, Project Essential Activities. This template is free to edit as deemed fit for your organization. Therefore download it now.
-
 Multiple stack of coins 50 cents money
Presenting this set of slides with name - Multiple Stack Of Coins 50 Cents Money. This is a one stage process. The stages in this process are Stack Of Coins, Queue Of Penny, Pile Of Coins.
-
 Stack of coins with jar filled with coins
Presenting this set of slides with name - Stack Of Coins With Jar Filled With Coins. This is a three stage process. The stages in this process are Stack Of Coins, Queue Of Penny, Pile Of Coins.
-
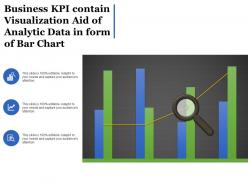 Business kpi contain visualization aid of analytic data in form of bar chart
Presenting this set of slides with name - Business Kpi Contain Visualization Aid Of Analytic Data In Form Of Bar Chart. This is a four stage process. The stages in this process are Business Kpi, Business Dashboard, Business Metrics.
-
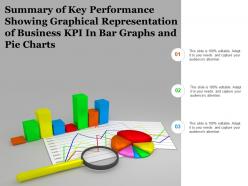 Summary of key performance showing graphical representation of business kpi in bar graphs and pie charts
Presenting this set of slides with name - Summary Of Key Performance Showing Graphical Representation Of Business Kpi In Bar Graphs And Pie Charts. This is a three stage process. The stages in this process are Business Kpi, Business Dashboard, Business Metrics.
-
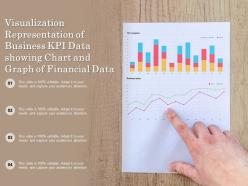 Visualization representation of business kpi data showing chart and graph of financial data
Presenting this set of slides with name - Visualization Representation Of Business Kpi Data Showing Chart And Graph Of Financial Data. This is a four stage process. The stages in this process are Business Kpi, Business Dashboard, Business Metrics.
-
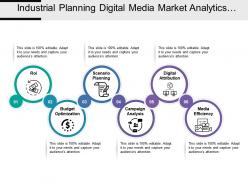 Industrial planning digital media market analytics with icons and circles
Presenting this set of slides with name - Industrial Planning Digital Media Market Analytics With Icons And Circles. This is a six stage process. The stages in this process are Marketing Analytics, Marketing Performance, Marketing Discovery.
-
 Market analytics icon with globe and mobile with bar distribution
Presenting this set of slides with name - Market Analytics Icon With Globe And Mobile With Bar Distribution. This is a two stage process. The stages in this process are Marketing Analytics, Marketing Performance, Marketing Discovery.
-
 Kpi icon showing laptop screen and pie chart
Presenting this set of slides with name - Kpi Icon Showing Laptop Screen And Pie Chart. This is a four stage process. The stages in this process are Metrics Icon, Kpi Icon, Statistics Icon.
-
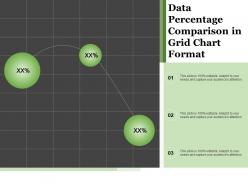 Data percentage comparison in grid chart format
Presenting this set of slides with name - Data Percentage Comparison In Grid Chart Format. This is a three stage process. The stages in this process are Percentage Comparison, Percentage Compare, Percentage Balancing.
-
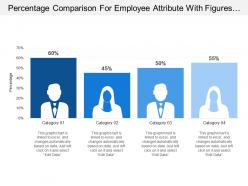 Percentage comparison for employee attribute with figures in percent
Presenting this set of slides with name - Percentage Comparison For Employee Attribute With Figures In Percent. This is a five stage process. The stages in this process are Percentage Comparison, Percentage Compare, Percentage Balancing.
-
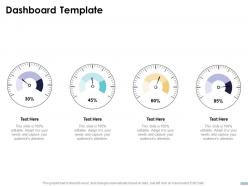 Dashboard template ppt powerpoint presentation layouts outline
Presenting this set of slides with name Dashboard Template Ppt Powerpoint Presentation Layouts Outline. This is a four stage process. The stages in this process are Dashboard. This is a completely editable PowerPoint presentation and is available for immediate download. Download now and impress your audience.
-
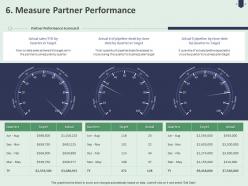 6 measure partner performance ppt powerpoint presentation infographics display
Presenting this set of slides with name 6 Measure Partner Performance Ppt Powerpoint Presentation Infographics Display. This is a three stage process. The stages in this process are Partner Performance Scorecard, Quarters, Target, Actual. This is a completely editable PowerPoint presentation and is available for immediate download. Download now and impress your audience.
-
 Meter shows businessman performance icon
Presenting this set of slides with name Meter Shows Businessman Performance Icon. This is a three stage process. The stages in this process are Meter Shows Businessman Performance Icon. This is a completely editable PowerPoint presentation and is available for immediate download. Download now and impress your audience.
-
 Performance icon showing laptop and meter
Presenting this set of slides with name Performance Icon Showing Laptop And Meter. This is a three stage process. The stages in this process are Performance Icon Showing Laptop And Meter. This is a completely editable PowerPoint presentation and is available for immediate download. Download now and impress your audience.
-
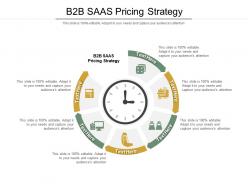 B2b saas pricing strategy ppt powerpoint presentation inspiration designs cpb
Presenting this set of slides with name B2B SAAS Pricing Strategy Ppt Powerpoint Presentation Inspiration Designs Cpb. This is an editable Powerpoint six stages graphic that deals with topics like B2B SAAS Pricing Strategy to help convey your message better graphically. This product is a premium product available for immediate download and is 100 percent editable in Powerpoint. Download this now and use it in your presentations to impress your audience.


