Dashboards Measuring PowerPoint Designs, Presentations Slides & PPT Shapes
- Sub Categories
-
- Arrows and Targets
- Bullet and Text Slides
- Charts and Graphs
- Circular Cycle Diagrams
- Concepts and Shapes
- Custom Flat Designs
- Dashboards and Measuring
- Flow Process
- Funnels
- Gears
- Growth
- Harvey Balls
- Idea Innovation and Light Bulbs
- Leadership
- Linear Process Diagrams
- Magnifying Glass
- Misc Other Graphics
- Opportunity and Handshake
- Organization Charts
- Puzzles
- Pyramids
- Roadmaps and Timelines
- Silhouettes
- Steps
- Strategic Planning Analysis
- SWOT Analysis
- Tables and Matrix
- Teamwork
- Technology and Communication
- Venn Diagrams
- Visuals and Illustrations
-
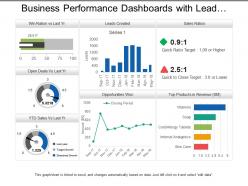 Business performance dashboards with lead creation and sales ratios
Presenting, business performance dashboards with lead creation and sales ratios for cost efficiency and performance indication PPT presentation. Bright and informative PowerPoint presentation slides. Gives regulations to achieve business success and targets. Produces error-free execution. Acts as a model for planning future assignments for marketing capabilities. Fully editable by any user at any point in time. Performs a clarity of marketing and presentation objectives without creating any confusions and misconceptions. Simple to be projected to widescreen without degradation in quality.
-
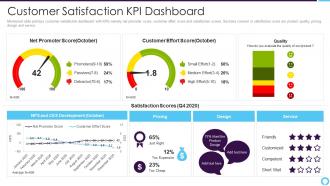 Partner relationship management customer satisfaction kpi dashboard
Mentioned slide portrays customer satisfaction dashboard with KPIs namely net promoter score, customer effort score and satisfaction scores. Sections covered in satisfaction score are product quality, pricing, design and service. Deliver an outstanding presentation on the topic using this Partner Relationship Management Customer Satisfaction Kpi Dashboard. Dispense information and present a thorough explanation of Customer Satisfaction Kpi Dashboard using the slides given. This template can be altered and personalized to fit your needs. It is also available for immediate download. So grab it now.
-
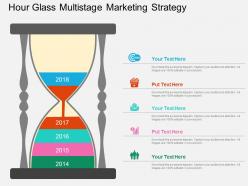 Hour glass multistage marketing strategy flat powerpoint design
We are proud to present our hour glass multistage marketing strategy flat powerpoint design. Graphic of hour glass has been used to craft this power point template diagram. This PPT diagram contains the concept of marketing strategy representation. Use this PPT diagram for business and marketing related presentations.
-
 Performance metrics icon powerpoint images
Presenting performance metrics icon PowerPoint images PPT slide. This performance metrics slide is easily downloadable and export it into JPEG or PDF format. A presenter can display this performance metrics icon slide in the standard or widescreen view. You can even amend the color, text, font type & font size, aspect ratio, etc. of performance metrics icon slide. The performance metrics icon template gets 100% synced with Google Slides and fully editable in PowerPoint. You can share this performance metrics icon slide easily with large segment due to its tremendous pixel quality. The performance metrics icon slide gets linked with the excel sheet.
-
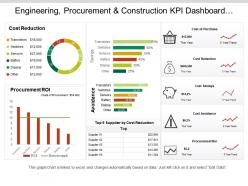 Engineering procurement and construction kpi dashboard showing cost of purchase order and cost reduction
You can use this PPT slideshow very easily as it is fully customizable. You can effortlessly insert or remove any diagrammatic representation from the given template. The font size, font color and font style can be easily edited. This graph PPT is linked to excel and changes automatically based on the data you enter. You can save the deck in either PDF or JPG format. To make any changes in the PPT slideshow, simply follow the instructions given in the sample slides. The size, color and orientation of all shapes are 100% customizable, so don’t waste any further time and download this presentation.
-
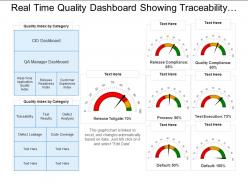 Real time quality dashboard showing traceability test results defects analysis
Presenting this set of slides with name - Real Time Quality Dashboard Showing Traceability Test Results Defects Analysis. This is a three stage process. The stages in this process are Quality Dashboard, Quality Kpi, Quality Metircs.
-
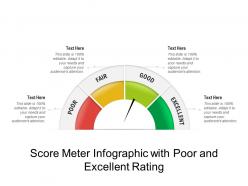 Score meter infographic with poor and excellent rating
Presenting our Score Meter Infographic With Poor And Excellent Rating PowerPoint Presentation Slide. It is completely editable and adaptable according to requirements. Take advantage of this professionally created PPT design that allows you to add or edit any text, image, and graph to your presentation making it more attractive and educational. It can also be presented with a different color, font, font size, and font types. The entire shape and appearance of the objects can be changed in this PPT layout. This template also supports standard (4:3) and widescreen (16:9) format. It presents you with thousands of icons for your topic to choose from. This template is also compatible with Google Slides.
-
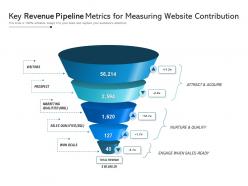 Key Revenue Pipeline Metrics For Measuring Website Contribution
Presenting this set of slides with name Key Revenue Pipeline Metrics For Measuring Website ContributionKey Revenue Pipeline Metrics For Measuring Website Contribution. This is a five stage process. The stages in this process are Key Revenue, Pipeline Metrics, Measuring Website, Contribution. This is a completely editable PowerPoint presentation and is available for immediate download. Download now and impress your audience.
-
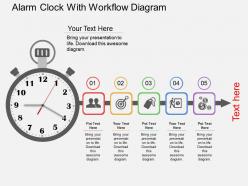 Alarm clock with workflow diagram flat powerpoint design
We are proud to present our alarm clock with workflow diagram flat powerpoint design. This power point template diagram has been crafted with graphic of alarm clock with workflow diagram. This PPT diagram contains the concept of time management. Use this PPT diagram for business and management related presentations.
-
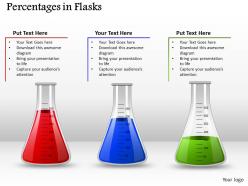 0514 Three Value Measuring Flasks For Science Medical Images For Powerpoint
We are proud to present our 0514 three value measuring flasks for science medical images for powerpoint. For displaying science related measurement use this three value measuring flasks Power Point template. This Power Point template is very useful for scientific measurement display of any liquid quantity. To display any measurement related data you can use this template in your presentation .
-
 Rating meter monitoring performance risk assessment credit score
If you require a professional template with great design, then this Rating Meter Monitoring Performance Risk Assessment Credit Score is an ideal fit for you. Deploy it to enthrall your audience and increase your presentation threshold with the right graphics, images, and structure. Portray your ideas and vision using twelve slides included in this complete deck. This template is suitable for expert discussion meetings presenting your views on the topic. With a variety of slides having the same thematic representation, this template can be regarded as a complete package. It employs some of the best design practices, so everything is well-structured. Not only this, it responds to all your needs and requirements by quickly adapting itself to the changes you make. This PPT slideshow is available for immediate download in PNG, JPG, and PDF formats, further enhancing its usability. Grab it by clicking the download button.
-
 Meter with client satisfaction level indication flat powerpoint design
We are proud to present our meter with client satisfaction level indication flat powerpoint design. Graphic of meter has been used to design this power point template diagram. This PPT diagram contains the concept of client satisfaction level indication. Use this PPT diagram for business and marketing related presentations.
-
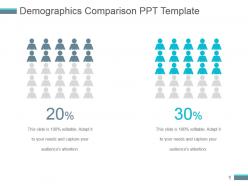 Demographics comparison ppt template
Presenting demographics comparison ppt template. Presenting demographics comparison ppt template. This is a demographics comparison ppt template. This is a two stage process. The stages in this process are finance, business, marketing, management, percentage.
-
 Security dashboard of account identity and access
Presenting this set of slides with name Security Dashboard Of Account Identity And Access. The topics discussed in these slides are Security Dashboard Of Account Identity And Access. This is a completely editable PowerPoint presentation and is available for immediate download. Download now and impress your audience.
-
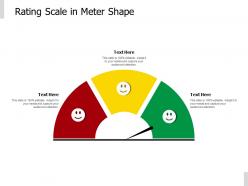 Rating scale in meter shape
Presenting this set of slides with name Rating Scale In Meter Shape. This is a three stage process. The stages in this process are Product Improvement, Rating Scale, Product Quality. This is a completely editable PowerPoint presentation and is available for immediate download. Download now and impress your audience.
-
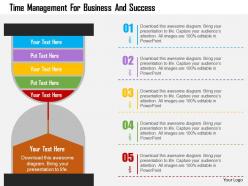 Time management for business and success flat powerpoint design
We are proud to present our time management for business and success flat powerpoint design. Concept of time management for business and success has been displayed in this PPT diagram. This PPT diagram contains the graphic of sand clock. Use this PPT diagram for business and management related presentations.
-
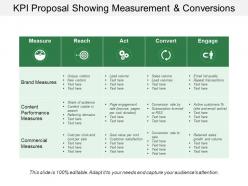 Kpi proposal showing measurement and conversions
Presenting this set of slides with name - Kpi Proposal Showing Measurement And Conversions. This is a five stage process. The stages in this process are Kpi Proposal, Kpi Plan, Kpi Scheme.
-
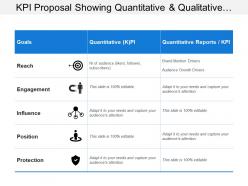 Kpi proposal showing quantitative and qualitative kpi
Presenting this set of slides with name - Kpi Proposal Showing Quantitative And Qualitative Kpi. This is a three stage process. The stages in this process are Kpi Proposal, Kpi Plan, Kpi Scheme.
-
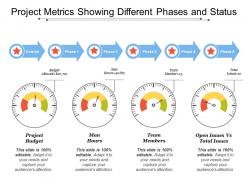 Project metrics showing different phases and status
Presenting this set of slides with name - Project Metrics Showing Different Phases And Status. This is a four stage process. The stages in this process are Project Kpis, Project Dashboard, Project Metrics.
-
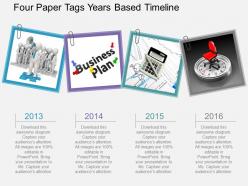 Ci four paper tags years based timeline flat powerpoint design
Simple and swift to download in convenient steps. Totally modifiable color, contrast, orientation and size of PPT icons. No change in resolution of PPT images post editing. Convert into PDF or JPG according to requirement. Fully modifiable text as per the context. Perfectly suited for financial planners, risk assessors, project developers etc.
-
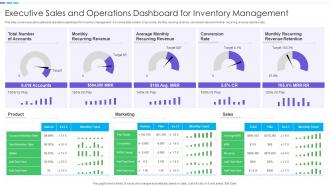 Executive Sales And Operations Dashboard Snapshot For Inventory Management
This slide covers executive sales and operations dashboard snapshot for inventory management. It involves total number of accounts, monthly recuring revenue, conversion rate and monthly recurring revenue retention rate. Introducing our Executive Sales And Operations Dashboard For Inventory Management set of slides. The topics discussed in these slides are Monthly Recurring Revenue, Conversion Rate, Recurring Revenue Retention. This is an immediately available PowerPoint presentation that can be conveniently customized. Download it and convince your audience.
-
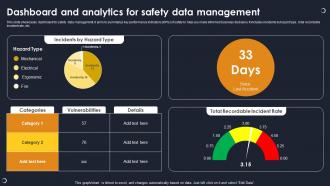 Dashboard And Analytics For Safety Data Management
This slide showcases dashboard for safety data management. it aims to summarize key performance indicators KPIs of safety to help you make informed business decisions. It includes incidents by hazard type, total recordable incident rate, etc. Presenting our well structured Dashboard And Analytics For Safety Data Management. The topics discussed in this slide are Incidents By Hazard Type, Vulnerabilities, Total Recordable Incident Rate. This is an instantly available PowerPoint presentation that can be edited conveniently. Download it right away and captivate your audience.
-
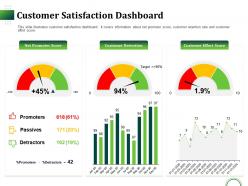 Customer satisfaction dashboard snapshot ppt powerpoint presentation show
This slide illustrates customer satisfaction dashboard. It covers information about net promoter score customer retention rate and customer effort score. Presenting this set of slides with name Customer Satisfaction Dashboard Snapshot Ppt Powerpoint Presentation Show. This is a three stage process. The stages in this process are Net Promoter Score, Customer Retention, Customer Effort Score. This is a completely editable PowerPoint presentation and is available for immediate download. Download now and impress your audience.
-
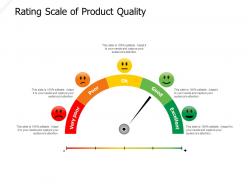 Rating scale of product quality
Presenting this set of slides with name Rating Scale Of Product Quality. This is a five stage process. The stages in this process are Product Improvement, Rating Scale, Product Quality. This is a completely editable PowerPoint presentation and is available for immediate download. Download now and impress your audience.
-
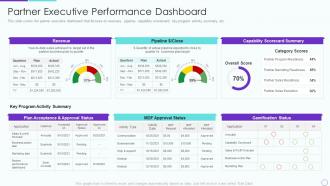 Partner relationship management prm partner executive performance dashboard
This slide covers the partner executive dashboard that focuses on revenues, pipeline, capability scoreboard, key program activity summary, etc. Present the topic in a bit more detail with this Partner Relationship Management PRM Partner Executive Performance Dashboard. Use it as a tool for discussion and navigation on Key Program Activity Summary, Capability Scorecard Summary, Gamification Status, Mdf Approval Status, Revenue. This template is free to edit as deemed fit for your organization. Therefore download it now.
-
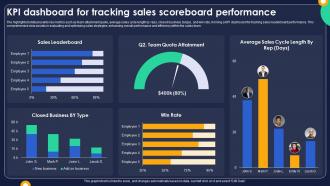 KPI Dashboard For Tracking Sales Scoreboard Performance
The highlighted slide presents key metrics such as team attainment quote, average sales cycle length by reps, closed business by type, and win rate, forming a KPI dashboard for tracking sales leaderboard performance. This comprehensive view assists in evaluating and optimizing sales strategies, enhancing overall performance and efficiency within the sales team. Presenting our well structured KPI Dashboard For Tracking Sales Scoreboard Performance. The topics discussed in this slide are Tracking, Sales, Performance. This is an instantly available PowerPoint presentation that can be edited conveniently. Download it right away and captivate your audience.
-
 Sequence of thermometer for result analysis flat powerpoint design
We are proud to present our sequence of thermometer for result analysis flat powerpoint design. This power point template diagram has been crafted with graphic of thermometer in sequence. This PPT diagram contains the concept of business result analysis. Use this PPT diagram for business and medical presentations.
-
 Icon for project benefit measurement with meter
Presenting this set of slides with name Icon For Project Benefit Measurement With Meter. This is a three stage process. The stages in this process are Icon For Project Benefit Measurement With Meter. This is a completely editable PowerPoint presentation and is available for immediate download. Download now and impress your audience.
-
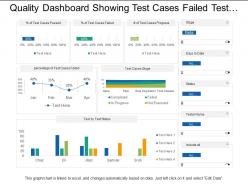 Quality dashboard showing test cases failed test status and in progress
SlideTeam feels immense pleasure in presenting to you its quality dashboard showing test cases failed test status and in progress. Following simple instructions given in the sample template you can easily alter the given set of predesigned slides. You can view the PPT template in standard size display ratio of 4:3 or widescreen display ratio of 16:9. The business slides are very easy to use and operate as they are compatible with Google Slides and can be similarly saved in format of PDF or JPG.
-
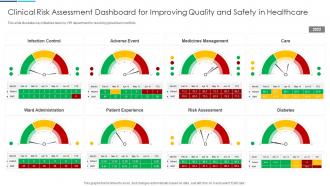 Clinical Risk Assessment Dashboard For Improving Quality And Safety In Healthcare
This slide illustrates key initiatives taken by HR department for resolving global team conflicts. Introducing our Clinical Risk Assessment Dashboard For Improving Quality And Safety In Healthcare set of slides. The topics discussed in these slides are Clinical Risk Assessment Dashboard For Improving Quality And Safety In Healthcare. This is an immediately available PowerPoint presentation that can be conveniently customized. Download it and convince your audience.
-
 Di watch for time management with tags flat powerpoint design
Readymade PPT graphic helps in saving time and effort. Include or exclude slide content as per your individual need. Colors and text can be easily changed as the PPT slide is completely editable. Personalize the presentation with individual company name and logo. This PPT Slide is available in both Standard and Widescreen slide size. Easy and quick downloading process. Flexible option for conversion in PDF or JPEG formats.
-
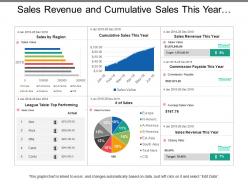 Sales revenue and cumulative sales this year dashboards
Presenting this set of slides with name - Sales Revenue And Cumulative Sales This Year Dashboards. Completely amendable presentation design as some elements are editable. Ease to personalize the slide with your company name, logo and even tag line. PowerPoint slide can be downloaded easily and transform into JPG and PDF format. More designs can be accessed with different nodes and stages. PPT diagram can be projected in standard and widescreen view. Great use of colors and innovatively designed. PPT template is compatible with Google slides.
-
 Performance icon with rating scale and star
Presenting this set of slides with name Performance Icon With Rating Scale And Star. This is a three stage process. The stages in this process are Performance Icon With Rating Scale And Star. This is a completely editable PowerPoint presentation and is available for immediate download. Download now and impress your audience.
-
 Partner executive performance dashboard managing strategic partnerships
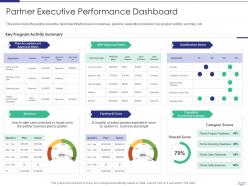
This slide covers the partner executive dashboard that focuses on revenues, pipeline, capability scoreboard, key program activity summary, etc. Present the topic in a bit more detail with this Partner Executive Performance Dashboard Managing Strategic Partnerships. Use it as a tool for discussion and navigation on Revenue, Pipeline Dollar Close, Capability Scorecard Summary, Gamification Status. This template is free to edit as deemed fit for your organization. Therefore download it now.
-
 Sales activity dashboard snapshot ppt samples
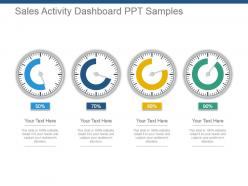
Presenting sales activity dashboard snapshot ppt samples. This is a sales activity dashboard ppt samples. This is a four stage process. The stages in this process are sales, activity, dashboard, financial, strategy.
-
 KPI Dashboard To Evaluate Effectiveness Achieving Higher ROI With Brand Development
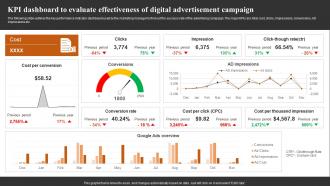
The following slide outlines the key performance indicator dashboard used by the marketing manager to find out the success rate of the advertising campaign. The major KPIs are total cost, clicks, impressions, conversions, AD impressions etc. Present the topic in a bit more detail with this KPI Dashboard To Evaluate Effectiveness Achieving Higher ROI With Brand Development. Use it as a tool for discussion and navigation on Clicks, Impression, Click Though Rate. This template is free to edit as deemed fit for your organization. Therefore download it now.
-
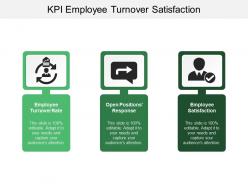 Kpi employee turnover satisfaction
Presenting this set of slides with name - Kpi Employee Turnover Satisfaction. This is a three stage process. The stages in this process are Kpi, Dashboard, Metrics.
-
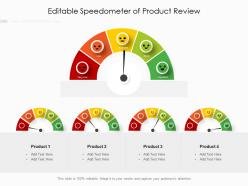 Editable speedometer of product review
Presenting this set of slides with name Editable Speedometer Of Product Review. The topics discussed in these slide is Editable Speedometer Of Product Review. This is a completely editable PowerPoint presentation and is available for immediate download. Download now and impress your audience.
-
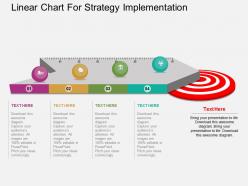 Ic linear chart for strategy implementation flat powerpoint design
Completely editable content including fonts, text, colors. Compatible with number of software options. Personalize the presentation with individual company name and logo. Excellence in picture quality even on wide screen output. Easy and quick downloading process. Flexible option for conversion in PDF or JPG formats. Compatible with Google slides. Perfect for business entrepreneurs, managers, strategist, planning experts and management leaders.
-
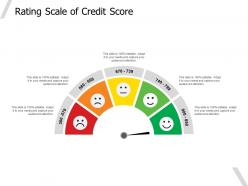 Rating scale of credit score
Presenting this set of slides with name Rating Scale Of Credit Score. This is a five stage process. The stages in this process are Product Improvement, Rating Scale, Product Quality. This is a completely editable PowerPoint presentation and is available for immediate download. Download now and impress your audience.
-
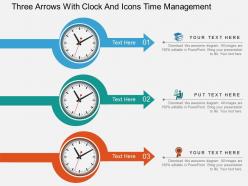 Qu three arrows with clock and icons time management flat powerpoint design
Pre-designed PPT graphic helps in saving time and effort. Include or exclude slide content as per your individual need. Colors and text can be easily changed as the PPT slide is completely editable. Personalize the presentation with individual company name and logo. This PPT Slide is available in both Standard and Widescreen slide size. Easy and quick downloading process. Flexible option for conversion in PDF or JPEG formats.
-
 Project Schedule And Time Management Icon
Introducing our premium set of slides with Project Schedule And Time Management Icon. Elucidate the three stages and present information using this PPT slide. This is a completely adaptable PowerPoint template design that can be used to interpret topics like Project Schedule, Time Management, Icon. So download instantly and tailor it with your information.
-
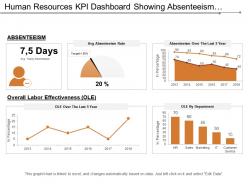 Human resources kpi dashboard showing absenteeism overall labor effectiveness
Presenting this set of slides with name - Human Resources Kpi Dashboard Showing Absenteeism Overall Labor Effectiveness. This is a five stage process. The stages in this process are Human Resource, Hrm, Human Capital.
-
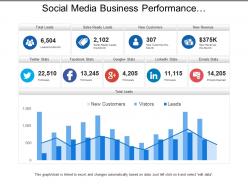 Social media business performance dashboards with total leads
Presenting this set of slides with name - Social Media Business Performance Dashboards With Total Leads. This is a three stage process. The stages in this process are Business Dashboard, Business Kpi, Business Performance.
-
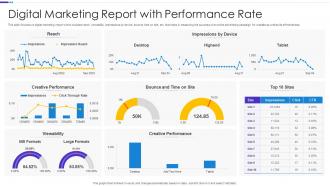 Digital Marketing Report With Performance Rate
This slide focuses on digital marketing report which includes reach, viewability, impressions by device, bounce ,time on site, etc. that helps in measuring the success of an online advertising campaign for website as well as its effectiveness. Introducing our Digital Marketing Report With Performance Rate set of slides. The topics discussed in these slides are Impressions, Bounce And Time On Site, Creative Performance. This is an immediately available PowerPoint presentation that can be conveniently customized. Download it and convince your audience.
-
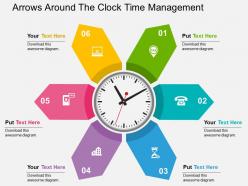 Arrows around the clock time management flat powerpoint design
Visually appealing PowerPoint presentation patterns. High quality images and visuals used in the PPT design. Adaptable PPT slides as fully compatible with Google slides. Beneficial for industry professionals, managers, executives, researchers, sales people, etc. The presentation template can be downloaded and saved in any desired format. Privilege of insertion of logo and trademarks for more personalization.
-
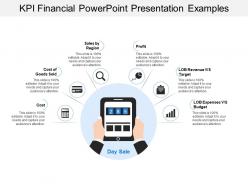 Kpi financial powerpoint presentation examples
Presenting this set of slides with name - Kpi Financial Powerpoint Presentation Examples. This is a one stage process. The stages in this process are Kpi, Dashboard, Metrics.
-
 Kpi icons powerpoint slide background designs
Presenting this set of slides with name - Kpi Icons Powerpoint Slide Background Designs. This is a eight stage process. The stages in this process are Kpi, Dashboard, Metrics.
-
 Dashboard For Tracking Sales By Various Products Effective Sales Techniques To Boost Business MKT SS V
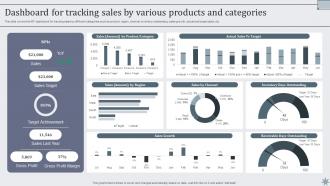
This slide covers the KPI dashboard for tracking sales by different categories such as product, region, channel, inventory outstanding, sales growth, actual and target sales, etc. Present the topic in a bit more detail with this Dashboard For Tracking Sales By Various Products Effective Sales Techniques To Boost Business MKT SS V. Use it as a tool for discussion and navigation on Sales, Products, Categories. This template is free to edit as deemed fit for your organization. Therefore download it now.
-
 Kpi icons powerpoint slide background picture
Presenting this set of slides with name - Kpi Icons Powerpoint Slide Background Picture. This is a four stage process. The stages in this process are Kpi, Dashboard, Metrics.
-
 Our key metrics ppt sample presentations
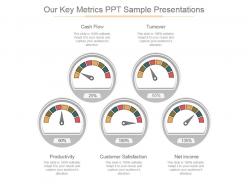
Presenting our key metrics ppt sample presentations. This is a our key metrics ppt sample presentations. This is a five stage process. The stages in this process are cash flow, turnover, net income, customer satisfaction, productivity.
-
 Lx watch with perfect symbol flat powerpoint design
100 percent editable PPT icon, text, color, shade, shape and size. Can be used independently or in collaboration with any other marketing graphic. Impressive and eye catchy. High resolution slide background ensures the zooming of image does not deter its quality. Compatible with wide screen output. Adaptable to numerous software available both online and offline. Beneficial for business administrators, professionals, students and other individuals.
-
 Newspaper headlines opened newspaper in businessman hands
Presenting, the newspaper headlines PowerPoint Presentation Slide. This Presentation has been designed under the strict supervision of professionals and is fully editable. You can have access to play with the font size, font type, colors, and even the background. This Template is disciplinary with Google Slide and can be saved in JPG or PDF format without any nuisance created. Fast download at the click of the button.
-
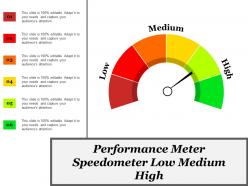 Performance meter speedometer low medium high
Presenting, the performance meter speedometer PowerPoint Presentation Slide. This Presentation has been designed professionally and is fully editable. You can personalize font size, font type, colors, and even the background. This Template is obedient with Google Slide and can be saved in JPG or PDF format without any hassle. Fast download at the click of the button.
-
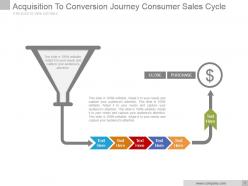 Acquisition to conversion journey consumer sales cycle powerpoint slide
Presenting acquisition to conversion journey consumer sales cycle PowerPoint slide. Download is quick and can be easily shared. Suitable for corporate leaders, marketing professionals and business associates. Flexible PPT slide as can be used whenever required. PowerPoint design can be shared in Standard and Widescreen view. Option to alter the design into JPEG and PDF document. Helps in making effective consumer sales workflows. These designs have remarkable quality and accuracy. They come with easy instructions for their modification.
-
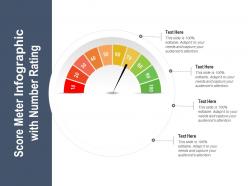 Score meter infographic with number rating
Presenting Score Meter Infographic With Number Rating slide. This PPT supports both the standard(4:3) and widescreen(16:9) sizes. This presentation is very easy to download and can be converted into numerous images or document formats including JPEG, PNG, or PDF. It is also compatible with Google Slides and editable in PowerPoint. Alter the style, size, color, background, and other attributes according to your requirements. Moreover, high-quality images prevent the lowering of quality.
-
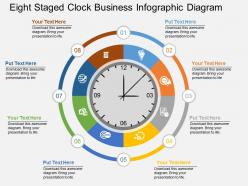 Fa eight staged clock business infographic diagram flat powerpoint design
Presenting fa eight staged clock business infographic diagram flat powerpoint design. Eight staged clock business info graphics diagram has been used to craft this power point template diagram. This PPT diagram contains the concept of time management. Use this PPT diagram for business and marketing related presentations.
-
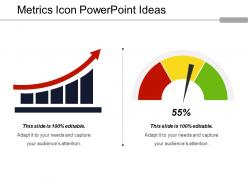 Metrics icon powerpoint ideas
Presenting Metrics Icon PowerPoint Ideas which is completely editable. Can be changed into formats like PDF, JPG, and PNG. The slide is readily available in both 4:3 and 16:9 aspect ratio. The template is compatible with Google Slides, which makes it accessible at once. Modify the colors, fonts, font size, and font types of the template as per the requirements.
-
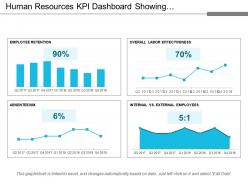 Human resources kpi dashboard showing employee retention absenteeism
Presenting this set of slides with name - Human Resources Kpi Dashboard Showing Employee Retention Absenteeism. This is a four stage process. The stages in this process are Human Resource, Hrm, Human Capital.
-
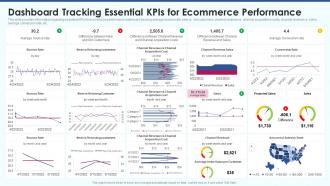 Ecommerce strategy playbook dashboard tracking essential kpis for ecommerce performance
This slide provides information regarding essential KPIs for ecommerce performance dashboard tracking average bounce rate, new vs. old customers, channel revenue vs. channel acquisitions costs, channel revenue vs. sales, average conversion rate, etc. Deliver an outstanding presentation on the topic using this Ecommerce Strategy Playbook Dashboard Tracking Essential KPIS For Ecommerce Performance. Dispense information and present a thorough explanation of Bounce Rate, Retuning Customer, Channel Revenue, Projected Sales using the slides given. This template can be altered and personalized to fit your needs. It is also available for immediate download. So grab it now.


