Harvey Balls PowerPoint Designs, Presentation Templates & Download PPT Designs
- Sub Categories
-
- Arrows and Targets
- Bullet and Text Slides
- Charts and Graphs
- Circular Cycle Diagrams
- Concepts and Shapes
- Custom Flat Designs
- Dashboards and Measuring
- Flow Process
- Funnels
- Gears
- Growth
- Harvey Balls
- Idea Innovation and Light Bulbs
- Leadership
- Linear Process Diagrams
- Magnifying Glass
- Misc Other Graphics
- Opportunity and Handshake
- Organization Charts
- Puzzles
- Pyramids
- Roadmaps and Timelines
- Silhouettes
- Steps
- Strategic Planning Analysis
- SWOT Analysis
- Tables and Matrix
- Teamwork
- Technology and Communication
- Venn Diagrams
- Visuals and Illustrations
-
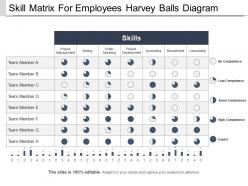 Skill matrix for employees harvey balls diagram ppt background
Presenting this set of slides with name- Skill Matrix for employees Harvey Balls Diagram PPT Background. Get easy access to this customizable template. You can change the color, text and font size as per your need. You can add or delete the content wherever required. Its compatibility with Google Slides makes it readily available. The PPT slide is available both in standard as well widescreen size. Convert and save this PPT slide in both PDF and JPG format.
-
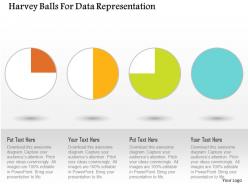 Harvey balls for data representation flat powerpoint design
Basic theme yet it can modified with respect to font, color and layout. Attractive and professional color scheme. PPT graphic offers font size which can be read from a distance. High resolution is offered by the presentation visual. Easy to download and instant use of pre designed PPT layout adds to its advantage.
-
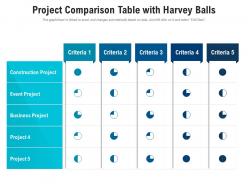 Project comparison table with harvey balls
Presenting our well-structured Project Comparison Table With Harvey Balls. The topics discussed in this slide are Project Comparison Table With Harvey Balls. This is an instantly available PowerPoint presentation that can be edited conveniently. Download it right away and captivate your audience.
-
 Crm vendor comparison with harvey balls diagram
Presenting this set of slides with name - Crm Vendor Comparison With Harvey Balls Diagram. This is a two stage process. The stages in this process are Harvey Balls, Booz Balls, Pie Charts, Comparison, Table.
-
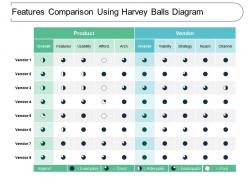
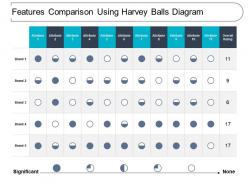 Features comparison using harvey balls diagram
Presenting this set of slides with name - Features Comparison Using Harvey Balls Diagram. This is a five stage process. The stages in this process are Harvey Balls, Booz Balls, Pie Charts, Comparison, Table.
-
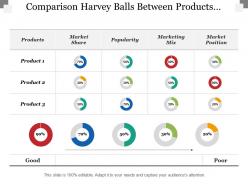 Comparison harvey balls between products market share popularity
Presenting this set of slides with name - Comparison Harvey Balls Between Products Market Share Popularity. This is a four stage process. The stages in this process are Differentiation, Comparison, Compare.
-
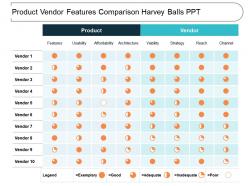 Product vendor features comparison harvey balls ppt
Presenting this set of slides with name - Product Vendor Features Comparison Harvey Balls Ppt. This is a eight stage process. The stages in this process are Harvey Balls, Booz Balls, Pie Charts, Comparison, Table.
-
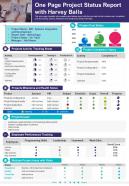 One page project status report with harvey balls presentation infographic ppt pdf document
In presenting the project status report, Harvey balls is a visual tool to communicate the progress. It evaluates the success rate of the project tasks and compares the data in different stages. Here is an efficiently designed One Page Project Status Report with Harvey Balls that includes cost, completion, issues, activity tracking, milestones, project key areas, etc. Get access to the one-page report now.
-
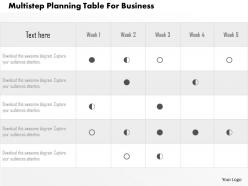 Multistep planning table for business flat powerpoint design
SlideTeam proudly presents to you its multistep-planning table for business flat PowerPoint design. This tabular PPT presentation is 100% customizable and adjusts as per your needs and the changes you make. You can alter the color, size and orientation of the graphical images used in the given pre-designed slides. You can view the slides in standard size display ratio of 4:3 or widescreen display ratio of 16:9. The slideshow can also be saved in format of either PDF or JPG easily.
-
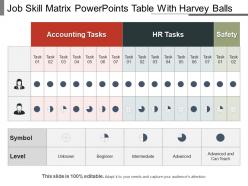 Job skill matrix powerpoints table with harvey balls
The designs are 100% editable in this PowerPoint template. The font size, font color, graphic colors, and slide background can be customized without any hassle. The users can add or remove rows and columns in the table according to their needs. This template includes one slide which is designed by keeping compatibility with Google Slides in mind. It is available in both standard and widescreen.
-
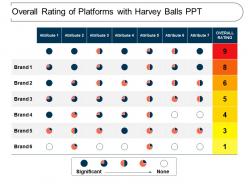 Overall rating of platforms with harvey balls ppt
Presenting this set of slides with name - Overall Rating Of Platforms With Harvey Balls Ppt. This is a seven stage process. The stages in this process are Harvey Balls, Booz Balls, Pie Charts, Comparison, Table.
-
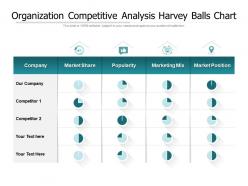 Organization competitive analysis harvey balls chart
Presenting this set of slides with name Organization Competitive Analysis Harvey Balls Chart. The topics discussed in these slides are Company, Market Share, Popularity, Marketing Mix, Market Position. This is a completely editable PowerPoint presentation and is available for immediate download. Download now and impress your audience.
-
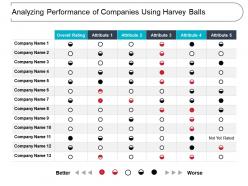 Analyzing performance of companies using harvey balls
Presenting this set of slides with name - Analyzing Performance Of Companies Using Harvey Balls. This is a five stage process. The stages in this process are Harvey Balls, Booz Balls, Pie Charts, Comparison, Table.
-
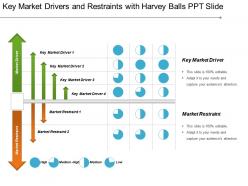 Key market drivers and restraints with harvey balls ppt slide
Presenting key market drivers and restraints with harvey balls PPT slide which is completely editable. This presentation is data driven, it can be customized and personalized. It is compatible with Google Slides and numerous format options. The graphics and icons used in this PPT slides are of high quality, definition and the visuals do not pixelate when projected on a wide screen and the editing instructions are also provided for your kind assistance.
-
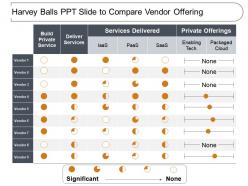 Harvey balls ppt slide to compare vendor offering
Presenting this set of slides with name - Harvey Balls Ppt Slide To Compare Vendor Offering. This is a five stage process. The stages in this process are Harvey Balls, Booz Balls, Pie Charts, Comparison, Table.
-
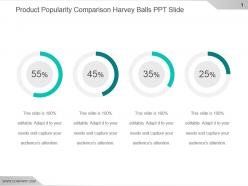 Product popularity comparison harvey balls ppt slide
Presenting product popularity comparison harvey balls ppt slide. This is a product popularity comparison harvey balls ppt slide. This is a four stage process. The stages in this process are business, percentage, finance, marketing, strategy, success.
-
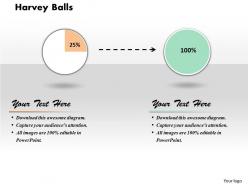 Harvey balls powerpoint template slide
We are proud to present our harvey balls powerpoint template slide. Inside this Harvey Balls PPT template you will find multiple Harvey Ball ideas created with PowerPoint shapes and layouts. The color variants let you use another dimension to represent your data, for example you may choose to represent different severity levels in a bug tracking management platform assigning different colors to the bugs.
-
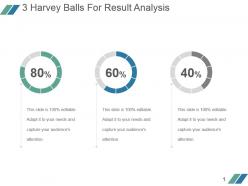 3 harvey balls for result analysis example of ppt
Presenting 3 harvey balls for result analysis example of ppt. This is a 3 harvey balls for result analysis example of ppt. This is a three stage process. The stages in this process are finance, process, business, marketing, percentage.
-
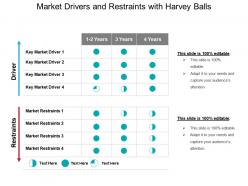 Market drivers and restraints with harvey balls powerpoint slide designs
Presenting market drivers and restraints with harvey balls PPT Slide which is 100% editable. This slideshow is data driven chart and the shapes of the graphics adjust automatically according to your data. Easy to customize and personalize this PowerPoint template and its high resolution visuals are easy to modify as per your need. This PowerPoint theme is compatible with Google Slides , multiple software and format options. This PPT is used by business analysts and professionals belongs to sales and marketing.
-
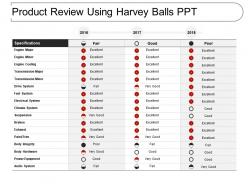 Product review using harvey balls ppt
Presenting this set of slides with name - Product Review Using Harvey Balls Ppt. This is a three stage process. The stages in this process are Harvey Balls, Booz Balls, Pie Charts, Comparison, Table.
-
 Review report using harvey balls powerpoint slide
Presenting this set of slides with name - Review Report Using Harvey Balls Powerpoint Slide. This is a two stage process. The stages in this process are Harvey Balls, Booz Balls, Pie Charts, Comparison, Table.
-
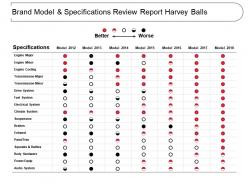 Brand model and specifications review report harvey balls
Presenting this set of slides with name - Brand Model And Specifications Review Report Harvey Balls. This is a seven stage process. The stages in this process are Harvey Balls, Booz Balls, Pie Charts, Comparison, Table.
-
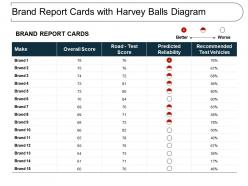 Brand report cards with harvey balls diagram
Presenting this set of slides with name - Brand Report Cards With Harvey Balls Diagram. This is a four stage process. The stages in this process are Harvey Balls, Booz Balls, Pie Charts, Comparison, Table.
-
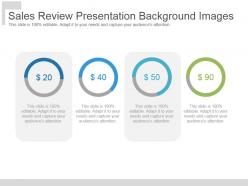 Sales review presentation background images
Presenting sales review presentation background images. This is a sales review presentation background images. This is a four stage process. The stages in this process are business, marketing, success, strategy, process, management.
-
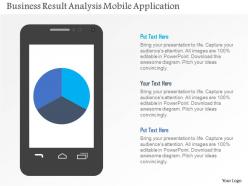 Business result analysis mobile application flat powerpoint design
We are proud to present our business result analysis mobile application flat powerpoint design. Concept of business result analysis on mobile has been displayed in this power point template diagram. This PPT diagram contains the graphic of mobile and pie graph. Use this PPT diagram for business and finance related presentations.
-
 Opportunity icon with idea bulb and dollar sign
Presenting this set of slides with name Opportunity Icon With Idea Bulb And Dollar Sign. This is a threestage process. The stages in this process are Opportunity Icon With Idea Bulb And Dollar Sign. This is a completely editable PowerPoint presentation and is available for immediate download. Download now and impress your audience.
-
 Thank You Healthcare Technology Capital Raising Pitch Deck
Increase audience engagement and knowledge by dispensing information using Thank You Healthcare Technology Capital Raising Pitch Deck. This template helps you present information on three stages. You can also present information on Address, Contact Number, Email Address using this PPT design. This layout is completely editable so personaize it now to meet your audiences expectations.
-
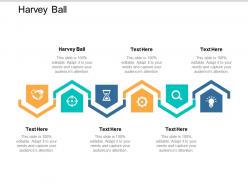 Harvey ball ppt powerpoint presentation file samples cpb
Presenting this set of slides with name - Harvey Ball Ppt Powerpoint Presentation File Samples Cpb. This is an editable six stages graphic that deals with topics like Harvey Ball to help convey your message better graphically. This product is a premium product available for immediate download, and is 100 percent editable in Powerpoint. Download this now and use it in your presentations to impress your audience.
-
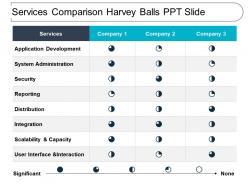 Services comparison harvey balls ppt slide
Presenting this set of slides with name - Services Comparison Harvey Balls Ppt Slide. This is a three stage process. The stages in this process are Harvey Balls, Booz Balls, Pie Charts, Comparison, Table.
-
 Project status report with harvey balls
Presenting this set of slides with name - Project Status Report With Harvey Balls. This is a five stage process. The stages in this process are Harvey Balls, Booz Balls, Pie Charts, Comparison, Table.
-
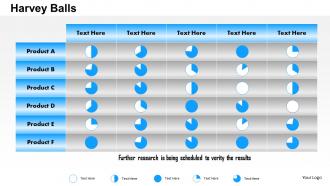 0414 harvey balls powerpoint presentation
Easy proofing and editing is added on feature of presentation visual. Presentation slide is useful in business marketing, management and recourse disbursement. Basic theme yet it can modified with respect to font, color and layout. Attractive color scheme gives a professional look to PPT layout. Conversion into PDF or JPG formats is very easy and handy. PPT graphic offers font size which can be read from a distance. Shapes are in vector format and can be edited.


