The capacity to make informed decisions at the right time is critical for success in today's competitive commercial world. If you lack vision or don't know what to do in a challenging situation, you'll be shooting in the dark, which is harmful to the growth of your organization, regardless of size or industry.
This is where two terms come into the fray: Big Data and Performance Dashboards. Using Big Data and Performance Dashboards to gain a competitive edge and increase brand awareness. You may ask, what exactly is the link between the two?
Let’s understand by considering the below example.
Health care is about to undergo a big data revolution, and performance dashboards will be a crucial management tool to monitor these developments. Dashboards provide vital management information about effectiveness and efficiency while also displaying the progress being made.
Health care as an industry is only a small spectacle in the huge world of big data. In the coming years, we will see a burgeoning number of industries achieving economies of scale solely with the help of big data and data analytics.
As we keep on exploring the link between performance dashboards and big data, we will look at the Top Ten Performance Dashboard Templates, which will showcase some of the best-performing business dashboard templates for your business offered by SlideTeam.
Gain deeper insights and make better data-driven decisions with these 100% editable, unique, and helpful timeline templates.
Check out our blog here to know what our team at SlideTeam has to offer when it comes to detailed and vibrant infographic-oriented performance dashboard templates for your next blockbuster presentation.
Start creating your dashboard today with SlideTeam’s best-in-class PPT Templates.
Template 1: Business Performance Dashboards Snapshot With New Customers And Gross Profit PPT
Analyze the growth and performance of your business using our snapshot of business dashboards PPT Template. . Different sections on this template are displayed in this PPT design, which includes maps, text, charts, graphs, and bar and rating graphs to reflect on the performance of your firm. Validate your plans, and describe the methods for achieving your objectives and goals using this content-ready PPT Slide, To arrange your data in accordance with the strategy, use the text fields. Download our first highly detailed and well-equipped performance dashboard template now!
Template 2: Project Portfolio Status Cost And Performance Dashboards Snapshot PPT
Improve your business processes with our project portfolio status, cost, and performance dashboards. The inclusion of business icons on this PPT slide enables us to present complex company financial data in a way that is both simple and intelligible. Bar graphs, pie charts, and comparison charts are used to display the performance metrics on this PPT Slide.. With the use of a chart template, you can display data and other vital information to your clients and stakeholders. Prepare for a flawless experience with your economics sale presentations by downloading this template today!
Template 3: Sales Performance Dashboard Sales Comparison Sales By Product Category PPT
This PowerPoint Template helps you assess your sales figures and the growth of your business. You may assess every element of the sales with our performance dashboard PPT design, including sales data, customer happiness, new customers, gross profit, brand profitability, and sales by product category. The presentation graphic is accessible in excel format, allowing you to alter the data with your company's information. Regularly assessing sales performance helps you identify the gaps and improve your product. Get this now!
Template 4: Sales Performance Dashboard Revenue New Customers PPT
With the help of this PowerPoint template, evaluate the performance of several factors of your start-up, including sales by product category, sales comparison, sales by month, brand profitability, client happiness, acquisition of new clients, and gross profit. Deploy this ready-to-use sales performance dashboard PowerPoint Template to keep tabs on the profit and revenue of the company. Analyze your month-wise sales to devise an action plan to scale up your business. So don’t hesitate and download this today!
Template 5: Business Performance Dashboards With Lead Creation And Sales Ratios PPT
Use our company performance dashboards to create a strong sales funnel and increase customer retention. This PPT deck is full of eye-catching icons and hues; it includes a graphic of seven stages that uses bar graphs, bar charts, dot charts, and performance meters to show how the firm is performing. The visuals used in these designs are fully modifiable, and by simply following a few basic instructions, the user can even include personal notes and corporate logos in them. Bid your worries goodbye with the help of this interactive lead creation and sales ratios template.
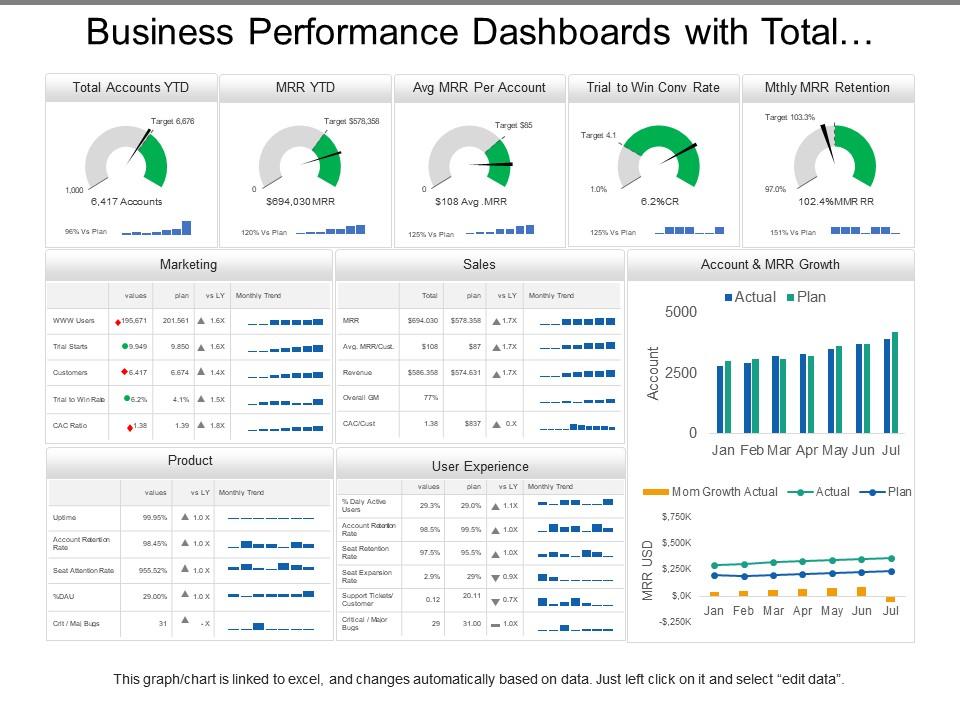
Template 6: Business Performance Dashboards With Total Accounts Marketing And Product PPT
In order to evaluate your company's success and draw accurate comparisons, pie charts, bar graphs, dot charts, and line charts are displayed in this template. Here, engaging visuals and colors are used to keep the audience interested throughout the presentation. Download this PPT design right away.
Template 7: Business Performance Dashboards With Total Accounts Marketing And Product PPT
Recognize the essential characteristics that distinguish leading organizations, build internal procedures, and boost internal effectiveness before modifying the business model. The performance and operation of your financial plan during the start of your project are demonstrated in the subsequent PPT design. Here, several graphs and line charts are displayed in enticing hues and a visually appealing style for you to consider. To learn what will work best for your business, download this PPT template today!
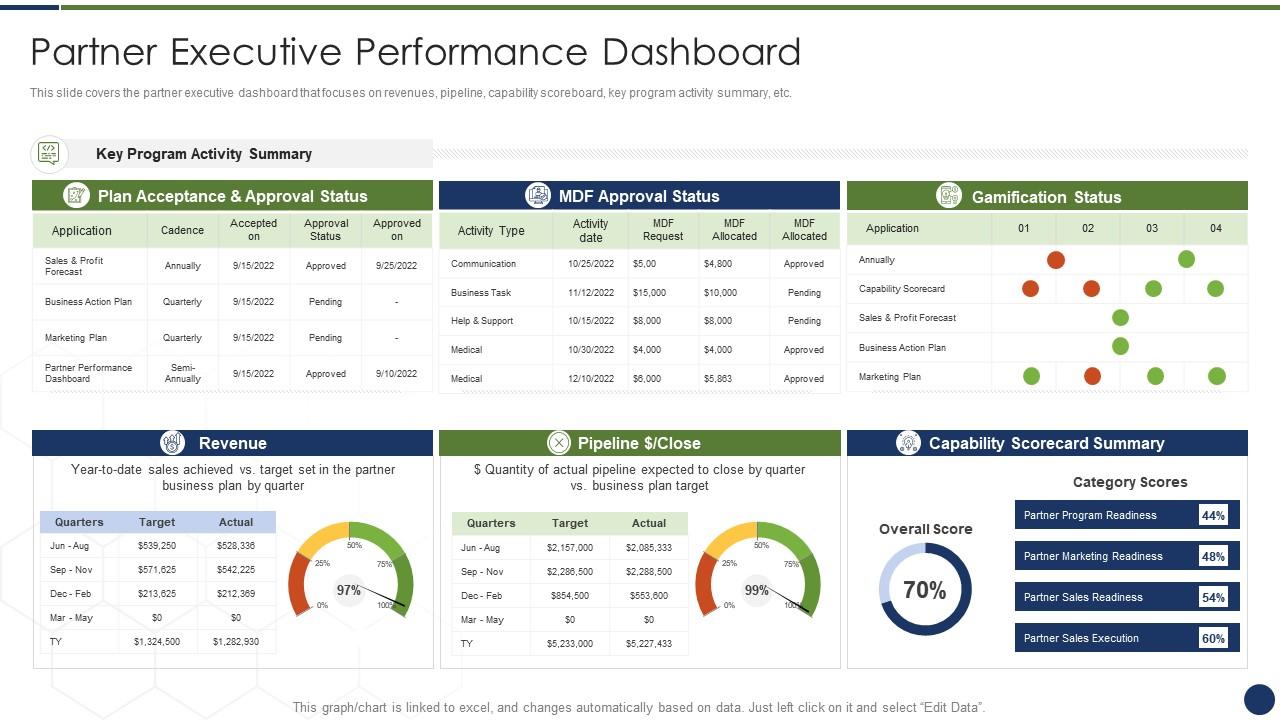
Template 8: Partner Executive Performance Dashboard Effective Partnership Management Customers PPT
An executive dashboard, which focuses on revenues, pipeline, capabilities scoreboard, important program activity summary, etc., is covered on the first slide of this template. Using these slides, provide facts and emphasize the Capability Scorecard Summary, Plan Acceptance And Approval, and Activity Summary. You can customize this template to meet your needs. Grab this template now!
Template 9: Sales Product Performance Dashboard Incremental Sales Campaign PPT
This presentation template was specifically created to satisfy the needs of the sales and marketing sectors. With this design, you can easily draw attention to the crucial elements of sales product performance, such as the most profitable product, the incremental sales campaign, the cost of products sold, etc. You can display your data in the most concise manner by using this presentation diagram. You can assess each product's performance using the sales product performance dashboard, and then decide how to approach marketing it. Get this today!
Template 10: Partner Executive Performance Dashboard Improve Management Complex Business PPT
This executive dashboard, which focuses on revenues, pipeline, capabilities scoreboard, important program activity summary, etc., is covered on the first slide of this template. Use it to facilitate conversation and navigation about revenue, pipeline dollars, capability scorecard summaries, and target. You are allowed to modify this template however you see fit for your business. Download this unique template today!
The Final Performance
.An important tip on the process of building a dashboard is understanding your core or end goal of creating it. Figuring out what kind of data you need to analyze and assess the numbers in it will help you get your analytics and data visualization tools right to finish building your dashboard. Set out to create that perfect dashboard today with SlideTeam!
FAQs on Performance Dashboard Templates
What is a good performance dashboard?
Clear, interactive, and user-friendly are the best characteristics of a good dashboard. They must effectively communicate information through data visualizations, allowing users to gather actionable insights, sports trends, and patterns, and identify possibilities for improvement through an easy-to-use online data analysis process. To create a dashboard, it is important to prioritize the most pertinent data, consider usability, and follow the main objectives of the company.
How do you make a performance dashboard?
To get your dashboard up and running as soon as possible, follow these five easy steps:
- Pick the KPIs and metrics you want to monitor;
- Pick your information sources;
- Recognize the target market;
- Create a dashboard with clear and informative graphs;
- Distribute the dashboard.
Why is a performance dashboard important?
Performance dashboards are extremely important for your data-driven needs for the following reasons. They
- Use business performance metrics to keep track of crucial business operations and activities while warning users of potential issues;
- Investigate the underlying causes of issues using current and pertinent information;
- Make better judgments and, maximize corporate performance, manage people and processes.
How is a dashboard performance measured?
The easiest way to judge a dashboard's quality is by how often it is used or its 'usage rate'. A dashboard has already achieved success if stakeholders often use it. Something that is not useful wouldn't be used.
You can quickly check the backend users and how frequently they access the dashboard if you use Tableau or Looker.


 Customer Reviews


![Top 10 Daily Status Report Templates to Document Your Performance [Free PDF Attached]](https://www.slideteam.net/wp/wp-content/uploads/2022/06/Top-10-Daily-Status-Report-Templates_1-1013x441.png)


