

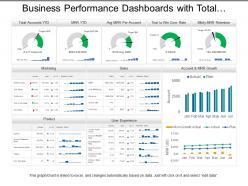
Business performance dashboards with total accounts marketing and product






Try Before you Buy Download Free Sample Product
 Impress Your
Audience
 100%
Editable
 Save Hours
of Time


Lift your ambitions high with our, business performance dashboards with total accounts marketing and product PPT layout. Following graphics shows, performance dashboard graphs for accounting and marketing related concerns. Supervise yourself towards the formulation and implementation of the major goals and initiatives taken by your organization. Pie charts, bar graphs, dot and line charts are shown here to reflect on your business performance and make valid comparisons. Use this PPT design to demonstrate the viability of your plans, expansion of the company to purchase new assets and motivate your workmates to do better. Appealing colors and visuals are shown here to keep the viewer involved throughout the presentation. Our Business Performance Dashboards With Total Accounts Marketing And Product contain the best from all ares. They bring about a convergence of cultures.
People who downloaded this PowerPoint presentation also viewed the following :
Business performance dashboards with total accounts marketing and product with all 6 slides:
Expose false idols with our Business Performance Dashboards With Total Accounts Marketing And Product. Convince folks they have feet of clay.


FAQs for Business performance dashboards with total accounts
Honestly, start with the big money stuff - revenue, profit margins, how much you're spending to get customers. Cash flow is critical too (learned that one the hard way lol). Customer churn matters a ton if you've got recurring revenue. Then throw in some operational metrics like conversion rates and customer satisfaction. Don't go crazy though - I'd stick to maybe 6-8 max or you'll never actually use the dashboard. It's tempting to track everything but you won't. Begin with whatever drives your revenue and add others as you figure out what decisions you're making regularly.
Honestly, data viz is a game changer - it turns boring spreadsheets into stuff you can actually read quickly. Why scroll through endless rows when a good chart shows you trends right away? Your sales going up or down, which teams are crushing it, conversion problems - it's all there visually. The trick is picking charts that actually make sense for what you're measuring. I learned this the hard way after making some truly ugly dashboards lol. Keep it clean though, because if your boss can't understand it in 10 seconds, you've lost them. Way better than trying to explain numbers in a meeting.
Real-time data lets you catch problems while they're happening instead of finding out about them next week when you're screwed. You can actually respond to what's going on rather than just staring at old numbers that don't help anymore. Think of it like - you wouldn't drive a car only looking at where you've been, right? Same logic applies here. Focus on the stuff that changes fast and actually matters to your business first. Those are your biggest wins. Then you can worry about the less critical metrics later. Trust me, once you start seeing things update live, you'll never want to go back to static reports.
Honestly, start with what actually moves the needle in your field - inventory turnover if you're retail, patient wait times for healthcare, that kind of thing. Most tools are pretty intuitive with the drag-and-drop stuff for widgets and charts. Focus on maybe 5-7 metrics that really drive your business instead of trying to track literally everything (I've seen people go overboard and it gets messy fast). Once your team's comfortable, you can add more specialized dashboards. The trick is figuring out what success looks like first, then building your KPIs around that. Don't overcomplicate it initially.
Top left corner is prime real estate - that's where people look first, so put your most important stuff there. Don't go crazy cramming every metric you can think of onto one screen though. I've seen dashboards that look like airplane cockpits and nobody uses them. Stick with consistent colors, make your charts obvious without explanations. Real-time updates are cool for things that actually change fast, but refreshing everything every second is just annoying. Oh, and definitely test it with real users first - they'll spot weird stuff you'd never notice.
Dude, user feedback is seriously where the magic happens. You think you know what people need on your dashboard, but they'll straight up tell you which metrics actually matter to them (spoiler: it's probably not what you expected). They catch stuff like confusing navigation or charts that make their eyes bleed. Missing data that would help them do their jobs better? They'll call that out too. Set up something simple - maybe just a quick form or grab coffee with users sometimes. The trick is actually doing something with what they tell you instead of just nodding and forgetting about it.
Budget matters here, obviously. Tableau and Power BI are total powerhouses but you'll pay for it - plus they take forever to learn properly. Google Data Studio's solid if you're already using Google stuff and don't want to spend much. I actually know people who've made decent dashboards in Excel, though that gets messy with live data. Klipfolio's pretty user-friendly for quick wins. Here's what I'd do: grab free trials of maybe 2-3 options and build the exact same basic dashboard in each. You'll know pretty fast which one doesn't make you want to throw your laptop.
So dashboards take all your scattered data and turn it into charts you can actually read. Pretty game-changing honestly. You'll spot trends way faster - like which months are killing it versus the duds. But here's the cool part: filter by demographics or whatever segments matter to you. That's where you find gold. Your product might look meh overall, but then you realize Gen Z is obsessed while boomers hate it. Oh, and definitely set alerts for the metrics that actually matter so you don't miss stuff.
Start with revenue growth, profit margins, and cash flow - they'll tell you if your business is actually making money or just burning through it. Customer acquisition cost and lifetime value are huge too, though most people ignore them for some reason. Honestly, don't get caught up tracking like 15 different metrics right away. These five will give you the real picture of your unit economics. Once you've got clean data on those basics, then you can add stuff like burn rate if you need it. Way better than drowning in dashboards that don't actually help.
Honestly, dashboards are game-changers because you can see all your important metrics in real-time instead of guessing what's happening. No more chasing down random spreadsheets from different teams - everything's in one spot. You'll spot problems early and can actually make smart decisions based on data. The visual aspect makes it way easier when you're presenting to higher-ups too. I'd say pick your top 3-5 KPIs first (don't go crazy with like 20 metrics right away). Then you can track if you're hitting your goals and pivot when something's clearly not working.
Honestly, dashboards are game-changers for keeping everyone honest. Real-time metrics mean nobody can quietly miss targets for weeks without anyone noticing. Your team sees who's crushing it and who's struggling - kind of like a sports scoreboard but for work stuff. The cool thing is it actually motivates people instead of stressing them out. Good performers get props right away, and people who need help get it faster. I'd do weekly reviews with the whole team so everyone stays on track. Oh, and you'll catch problems way earlier before they snowball into bigger issues.
So executives just want the big picture stuff - revenue, growth rates, those strategic numbers for major decisions. Managers need more detail though, like team productivity and budget variances to catch issues early. Then your frontline teams are all about the daily grind - individual performance, workflow problems, that kind of thing. The slick dashboards let you click down from CEO view all the way to team level, which is pretty cool. Just don't overwhelm people with info they can't actually use - I've seen way too many dashboards that are basically digital junk drawers. Customize what each group sees based on what they'll actually act on.
Honestly, data quality will be your biggest headache - stuff's scattered everywhere, half of it's garbage or old. Integration is brutal. But here's what really gets people: building something amazing that nobody uses. Users won't magically show up just because you built it, trust me on this one. They need to see real value in their day-to-day work. Oh, and you'll probably overthink metrics at first. My advice? Figure out what business questions actually keep your boss up at night, then trace back to what data answers those. Everything else is just shiny distractions.
Don't just throw all your historical data on there - you'll create a mess nobody wants to look at. Start with trend lines covering maybe 12-18 months of your main metrics. Then add those year-over-year comparisons that actually matter for decisions. Color coding works great when current numbers are way off from historical patterns. If your business has seasonal stuff (most do), add those overlays too. Oh, and make sure people can drill down when they need the details. I learned this the hard way - data overload kills dashboards faster than anything else.
AI insights are probably the biggest thing happening right now - dashboards that actually tell you what's wrong instead of making you figure it out yourself. Mobile design is everywhere too, which makes sense since I'm literally checking stuff on my phone between meetings all the time. Natural language search is getting scary good... you can ask "why did revenue tank?" and get real answers. Oh, and self-service tools are huge because nobody wants to wait for the data team anymore. Look for something that does at least a few of these things well.
No Reviews