


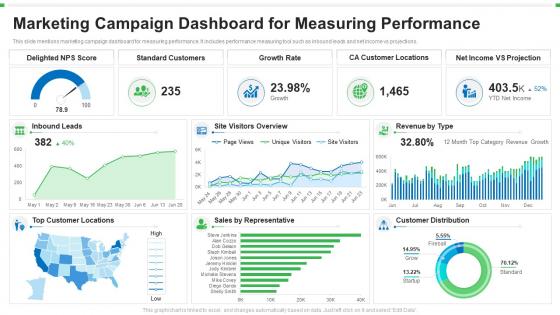
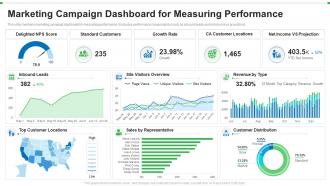
Marketing campaign dashboard for measuring performance


Try Before you Buy Download Free Sample Product
 Impress Your
 Audience
Editable
of Time


Our Marketing Campaign Dashboard For Measuring Performance are topically designed to provide an attractive backdrop to any subject. Use them to look like a presentation pro.
People who downloaded this PowerPoint presentation also viewed the following :
Marketing campaign dashboard for measuring performance with all 2 slides:
Use our Marketing Campaign Dashboard For Measuring Performance to effectively help you save your valuable time. They are readymade to fit into any presentation structure.

FAQs for Marketing campaign dashboard
Really depends what you're trying to achieve, but stick to the basics first: revenue growth, profit margins, customer satisfaction, employee engagement. Don't go crazy with too many - I've seen teams get buried under spreadsheets they never actually use. Pick maybe 3-5 that your team can genuinely impact. Mix leading indicators (stuff that predicts what's coming) with lagging ones (results already baked). Honestly? Skip the vanity metrics that just make reports look pretty. Focus on numbers that'll help you make real decisions.
Honestly, start with what actually moves the needle for your business goals. Customer retention? Track repeat purchases or NPS, not random website clicks. Most companies get sucked into vanity metrics that look pretty in decks but mean nothing. Break these down so each team knows how their daily grind connects to the big picture. Like, your support team should see how response times tie to retention goals. Oh and definitely review this stuff regularly - I learned this the hard way when priorities shifted and we were still measuring outdated things. Strategic goals change, so your metrics should too.
Look, you need benchmarks to actually understand what your numbers mean. Is 85% customer satisfaction decent? Could be amazing or awful depending on your industry. I'd grab 2-3 solid benchmarks for your main metrics - competitors, industry averages, whatever makes sense. Then you'll spot the real gaps and know where to focus. It's like having a map instead of wandering around lost. Your past performance works too if external data's hard to find. Just pick something consistent to measure against.
So basically, you track your key metrics to see what's actually working versus what's bombing. Then you can fix the real problems instead of just throwing darts in the dark. Think of it like having GPS for your business processes - shows you exactly where you're at and what direction to head next. The trick is measuring stuff that actually matters (not just random data for data's sake) and then doing something about it. I've seen too many people collect tons of metrics but never act on them. You'll spot trends and gaps over time that give you those "aha" moments for improvements.
Honestly, the biggest pain is usually crappy data quality and employees thinking you're trying to spy on them. Leadership always wants to track literally everything - which just makes a mess nobody can navigate. Different systems never talk to each other properly, so good luck getting consistent numbers. Plus you'll probably pick metrics that sound impressive but don't actually move the needle business-wise. My advice? Start super small with maybe 2-3 things people already get and trust. Once they see it's not some corporate surveillance thing and actually helps, then you can slowly add more stuff.
Honestly, automating data collection is a game changer - no more manual spreadsheet hell. Dashboards and analytics tools pull everything automatically from different sources, so you're not stuck doing it by hand. AI catches patterns that you'd never notice just scanning through numbers (I mean, who has time for that anyway?). The time savings are insane. What used to eat up hours now happens instantly, and your measurements are way more accurate. I'd start with tools that already work with what you've got, then add more once you see how much time you're saving back.
So quantitative is just your hard data - sales numbers, response times, error rates. Easy to track and compare. Qualitative gets at the "why" stuff like customer feedback or how well teams work together. Most people obsess over numbers because they're simpler to measure, but honestly? You're only getting half the picture that way. Numbers show you what's happening, qualitative tells you why it's happening. Use quantitative when you need clear benchmarks. Go qualitative when you want to actually understand what's going on and fix processes. Best bet is combining both - they work way better together than apart.
Start with flexible measurement from day one - don't just track what happened last quarter. Leading indicators are your friend here since they actually warn you before things go sideways. I learned this the hard way watching teams get totally caught off guard! Monthly or weekly reviews work way better than quarterly ones. You'll catch shifts faster. Also, regularly question if your current KPIs even make sense anymore. Like, would these metrics still push the right behaviors if everything changed tomorrow? It's honestly kind of wild how many companies stick with outdated measurements just because "that's what we've always done."
Dude, skip the boring bar charts - stakeholders literally zone out. Heat maps are clutch for showing performance across different areas. Interactive stuff like Tableau lets people dig into whatever they actually care about. Color-coded scorecards work well too, or simple infographics that highlight wins and problem spots. Trend lines are solid for showing progress over time. Oh and dashboards that actually tell a story with your data - that's what gets attention. Start with one clean viz that answers their main question first, then add more later.
Ditch the annual reviews for a sec. Try tracking peer feedback and how fast people solve problems. 360-degree feedback is gold - catches collaboration stuff your manager totally misses. Learning velocity is big too (basically how quick someone masters new skills). Customer impact scores work great if you're client-facing. Honestly? Some of our strongest players look meh on traditional metrics. I'd start simple - maybe track how often someone's ideas actually get used or their response time on cross-team stuff. Those metrics tell you way more about real performance than hitting quarterly numbers alone.
So performance measurement is super helpful for staying on top of your project - you'll spot problems early and make way better decisions. But here's the thing: it's kind of a pain to set up right, and your team might think you're breathing down their necks if you go overboard. Plus you can get obsessed with tracking every little detail instead of the stuff that actually moves the needle. Oh, and it eats up time you probably don't have. Start small though - pick like 3 metrics that really matter for your project's success. You can always add more later once you've got the hang of it.
Look, feedback loops are game changers - they turn boring performance reports into actual conversations that improve things. You measure something, share it with your team, then use what they tell you to make your tracking better. It's way more useful than just throwing numbers at people and hoping something sticks. Pick one metric and ask your team how to make it actually helpful (trust me, they'll have opinions). The whole point is acting on what you hear, not just collecting it. Honestly though, start small or you'll overwhelm everyone including yourself.
Oh man, culture is HUGE for this stuff. When your metrics clash with how people actually work and what they value, they'll either find ways around it or just pretend it doesn't exist. Seen it blow up so many times. Some teams are all about individual wins, others hate that and want group recognition. Plus there's the whole feedback thing - some cultures are super direct, others... not so much. You really gotta talk to your people first and figure out what actually drives them. Don't just copy-paste some generic system and hope it works.
Okay so basically you want checkpoints built into your whole process - catches bias early before it messes everything up. Get different people involved when you're designing the metrics because they'll see stuff you totally missed. Mix quantitative with qualitative data, and standardize how you collect it all so nobody's personal quirks throw things off. I know audits sound boring but do them regularly. Train people on unconscious bias too - honestly most folks don't realize they're doing it. Maybe rotate who's doing the evaluating sometimes? And document your methodology clearly so others can actually follow your logic.
Think about what your audience actually needs first. Executives? They want bottom-line impact, not details. Front-line teams need stuff they can actually use tomorrow. Visuals are your friend here - nobody wants to decode spreadsheets if they don't have to. Ditch the technical jargon that makes perfect sense to you but sounds like gibberish to them. Connect everything back to goals they care about. Show trends, not just random numbers. Honestly, half the battle is just asking yourself: what decision are they trying to make with this info?
-
Innovative and Colorful designs.
-
Understandable and informative presentation.
-
Understandable and informative presentation.
-
Presentation Design is very nice, good work with the content as well.