


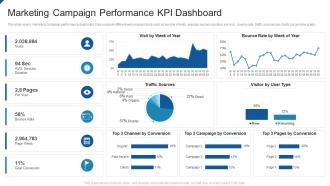
Marketing campaign performance kpi dashboard


Try Before you Buy Download Free Sample Product
 Impress Your
 Audience
Editable
of Time


Our Marketing Campaign Performance KPI Dashboard are topically designed to provide an attractive backdrop to any subject. Use them to look like a presentation pro.
People who downloaded this PowerPoint presentation also viewed the following :
Marketing campaign performance kpi dashboard with all 2 slides:
Use our Marketing Campaign Performance KPI Dashboard to effectively help you save your valuable time. They are readymade to fit into any presentation structure.
FAQs for Marketing campaign
Revenue's the obvious one, but don't forget conversion rates at each stage of your funnel. Average deal size and sales cycle length tell you a ton too. Activity stuff like calls and meetings booked - sounds boring but it matters. Pipeline value gives you that forward look you need. Oh, and lead response time is absolutely critical since everyone's competing for attention these days. Honestly, I'd stick with maybe 6-8 metrics max. Real-time updates are key though. You can always pile on more metrics later once your team actually starts using the thing regularly.
Honestly, good visualization is what separates useful dashboards from total garbage. Color coding saves your life - green for good stuff, red for "oh crap we need to fix this." Pick charts that actually make sense too, like sparklines for trends or gauges when you're tracking against targets. Don't try cramming everything on one screen though, that's just overwhelming. The whole point is making problems and patterns obvious right away instead of making people dig through boring tables. I'd start with maybe 2-3 visual tricks that work for whoever's using it, then add more later.
Honestly, real-time data is what separates useful dashboards from fancy paperweights. You'll catch problems while they're still fixable instead of discovering disasters after the fact. Nobody wants to explain why they missed something obvious, trust me on that one. Quick reactions beat perfect hindsight every time. Just make sure your data feeds are solid and focus on KPIs that actually need immediate attention - there's no point getting live updates on quarterly metrics, you know? Set up alerts for the critical stuff so you're not glued to your screen all day.
Talk to each team first - figure out what decisions they're actually making with the data. Executives just want the big picture stuff like revenue and customer costs. Operations needs the nitty-gritty daily numbers to spot problems. Sales managers are obsessed with pipeline metrics (seriously, they'll refresh those conversion rates every five minutes). Marketing cares about lead quality and campaign performance. Set up role-based dashboards so people don't get overwhelmed with irrelevant stuff. Build each view around their specific workflows - that's what'll actually get used.
Ugh, don't cram everything onto one screen just because you think more data looks better. You'll create this weird paralysis where nobody knows what matters. I see people obsessing over vanity metrics all the time - stuff that looks cool but doesn't actually help you make decisions. Focus on maybe 5-7 things that tie to real business goals, not just whatever's easiest to track. Here's my test: after every metric, ask yourself "so what?" If you can't give a solid answer, ditch it. Keep things simple and actually useful.
Honestly, dashboards are game-changers because you'll finally see what's actually moving the needle vs what just looks good on paper. That "amazing" campaign? Might be total garbage once you dig into the numbers. Set up alerts when things go sideways - trust me, you don't want to find out about problems weeks later. Make sure everyone can actually read the damn thing too, not just the data nerds. Oh, and schedule those review meetings or the dashboard just becomes expensive digital wallpaper. Real data beats guessing every time.
Interactive dashboards are game-changers, trust me. Instead of staring at boring static charts, people can actually click around and dig deeper into the data. Filters, date ranges, clickable elements - all that good stuff. Your stakeholders won't constantly ping you for "hey can you pull this one specific report?" anymore, which honestly saves so much time. They can just explore and find answers themselves. I'd start simple though - basic filtering and date controls first. You'll be shocked how much more your team actually uses the dashboard once they can interact with it.
Honestly? Weekly updates work for most dashboards. Daily makes sense if you're tracking sales or web traffic - that stuff changes fast and you actually need to know. But strategic metrics like customer satisfaction? Monthly is totally fine. I've watched teams go crazy trying to make everything real-time, which gets expensive quick and nobody even looks at it that much. Match your update speed to how fast you need to react, ya know? Start weekly and see what your team actually uses. You can always dial it up or down from there.
Honestly, I'd go with Google Data Studio first since it's free and does the job for most stuff. Tableau and Power BI are amazing but they'll cost you - only worth it if you really need the advanced features. Klipfolio's pretty sweet for dashboard-specific work, way less of a headache to set up than the big enterprise tools. Oh, and don't sleep on Google Sheets or Excel for quick mockups - they're surprisingly decent. Geckoboard's solid too if you want something clean. Start free, see what you actually need, then upgrade later if you have to.
Dude, mobile access is clutch - you can check your numbers anywhere instead of being stuck at your desk all day. Like when you're in client meetings or whatever, you can pull up metrics on the spot. Honestly the best part is catching problems right away instead of finding out hours later. Makes decision-making way faster too. Oh and definitely test how your dashboard looks on your phone first because some are absolutely awful on small screens - learned that the hard way. Being able to review stuff before calls while you're still in the elevator? Total game changer.
NPS, CSAT, and Customer Effort Score are your bread and butter for sentiment stuff. After that, definitely track retention and churn rates - those tell the real story. Support ticket resolution time is huge too. First-call resolution rates are gold if you've got phone support (seriously underrated metric). Honestly though? Start small. Pick maybe 3 or 4 metrics max so you don't go crazy staring at dashboards all day. You can always add more later once you figure out what actually matters for your business. The operational stuff usually connects pretty directly to how customers feel anyway.
Build everything modular from the start - trust me on this one. You want components you can easily copy and tweak, not some giant monster dashboard (I've seen those disasters firsthand). Different roles need different views anyway, so don't cram everything onto one screen. Here's the thing though - nail down your data sources and metric definitions early. Cleaning that mess up later with dozens of teams? Brutal. Oh, and set rules around who can create new dashboards, otherwise you'll have so much dashboard sprawl you won't know what's actually useful anymore.
Oh absolutely, aesthetics are huge! I've literally watched entire teams just stop using dashboards that looked like garbage, even when the data was perfect. Clean design can boost engagement by like 40% - people actually want to look at your stuff when it doesn't hurt their eyes. Good color coding and white space aren't just pretty touches either. They guide people to what matters most and help brains process info way faster. Honestly, cluttered dashboards with weird color choices are the worst. Your data's useless if nobody wants to open the thing, you know?
You'll want to build validation checks before data even touches your dashboard. Automated quality checks are huge - duplicate detection, null alerts, range validations. We had conversion rates hit 150% one month and I wanted to crawl under my desk! Cross-reference your KPI math with source systems constantly. Document where everything comes from so you can trace weird numbers back to their origin. Set up regular audits comparing dashboard vs manual calculations. Also create alerts for funky data patterns - way better to catch issues yourself than have your boss do it. Oh, and approval workflows for any data source changes.
Honestly, dashboards work because nobody wants to look bad when their numbers are up there for everyone to see. It's like a scoreboard - suddenly people care more about hitting their targets. Set up weekly reviews where teams actually explain what happened and what they're doing next. Just make sure you're tracking stuff that matters, not random metrics that look impressive but don't mean anything (we've all seen those vanity dashboards). The visibility plus regular check-ins combo is pretty solid. No more "we're working on it" nonsense when the data's right there.
-
Easily Understandable slides.