Six of the world’s ten most prominent companies are data-driven. The volume of data collected each day makes proper data management challenging. Statista, a German market research firm, expects the global volume of data created by 2024 to reach 149 zettabytes. This massive volume of data, often known as “big data,” is used to detect trends, patterns, and opportunities that might, otherwise, go unnoticed.
“What gets measured gets managed.” Use our pre-designed PPT Templates for a user-friendly and effective solution for streamlining weekly tracking and reporting operations.
Data collection, correlation, and connection from business departments and systems are possible through business dashboards. These dashboards enable access to real-time KPIs, allowing firms to handle difficulties before they become problems. Companies make critical strategic decisions and improve performance using simple, real-time data graphics culled from across sources.
Summary Dashboard: A collection of effective data displays.
Summary dashboards break down your data into more consumable chunks of visual information to help identify what you're doing well and where you can improve. They help managers and business owners view operations holistically. This centralized source of truth for your business saves time on sporadic data pulls and fixing malfunctioning macros.
SlideTeam’s user-friendly PPT Designs will revolutionize how your company understands and engages its workers. Grab it today!
This blog is a must-have resource for all businesses, big and small, looking to combine data into a single, centralized spot. The samples and templates create a process for everything. Use SlideTeam’s Top 10 Summary Dashboard Templates to automate repetitive activities and visualize data across departments. These templates provide clarity and visual symbols, making it easy to take the right step. The 100% customizable nature of the templates allows you to edit your presentations. The content-ready slides give you the much-needed structure.
Use SlideTeam’s finest PPT Templates to report and track your essential Key Performance Indicators (KPIs).
Continue reading to learn about the most beneficial data visualization tool for non-experts to evaluate complex data.
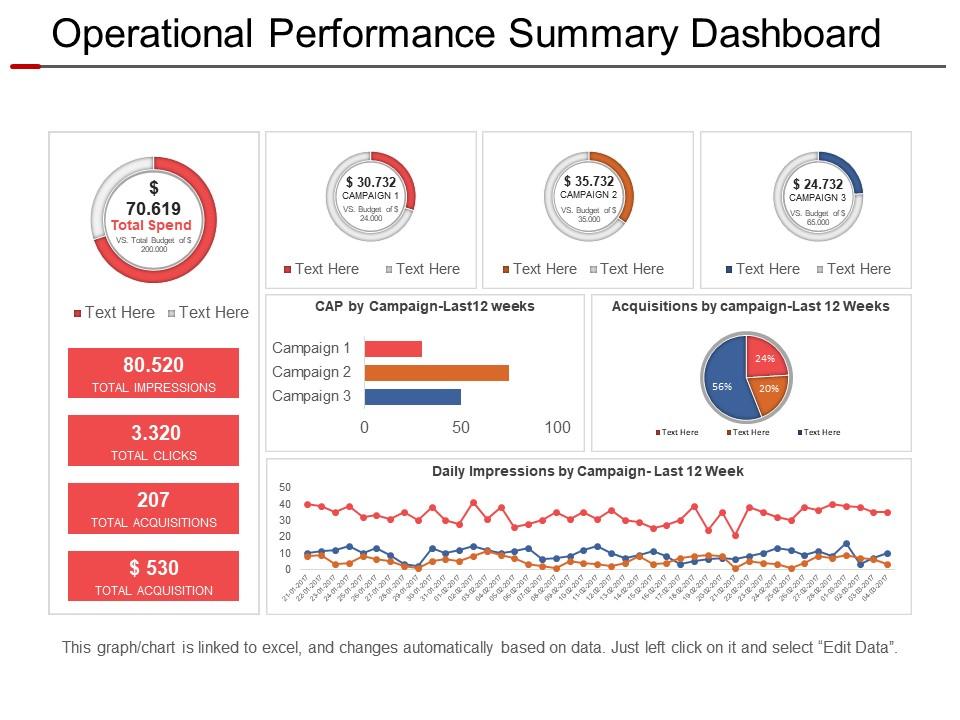
Template 1: Operational Performance Summary Dashboard Presentation Design PPT
An operational performance analysis is critical for monitoring and optimizing the company summary. Get this performance summary dashboard to track and boost the way your business operations are performing on projects. This allows businesses to maintain control and highlight the most critical data, metrics, and KPIs to differentiate between strategic, analytical, operational, and tactical dashboards. This PPT Slide is ideal for demonstrating the value of a reporting dashboard in driving modest, continual improvements and promoting a culture of data-driven decisions for review orders, inventory, and process efficiency. Total impressions, clicks, acquisitions, and other metrics are included. Use this download to suit information needs of businesses by converting data into easily understandable information. Grab it now!
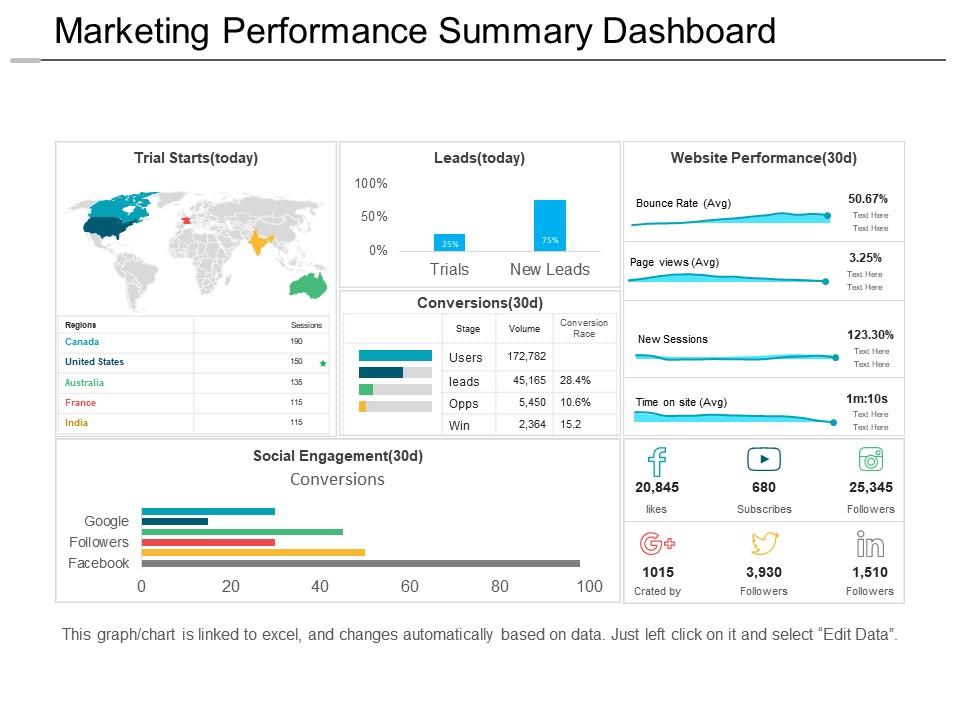
Template 2: Marketing Performance Summary Dashboard Snapshot PPT
A marketing performance summary is the ideal performance evaluation document for providing executives with a high-level perspective, and marketing professionals with a detailed analysis. This marketing campaign dashboard aids in the development and refinement of marketing strategy. It covers indicators like trial starts, leads, social engagement, website performance, and conversions. This is a must-have for any well-equipped marketing team, social media professionals, marketing trainers, sales gurus, SEO officers, educators, marketing consultants, and other professionals. Build an effective, data-driven marketing strategy. Get it right away!
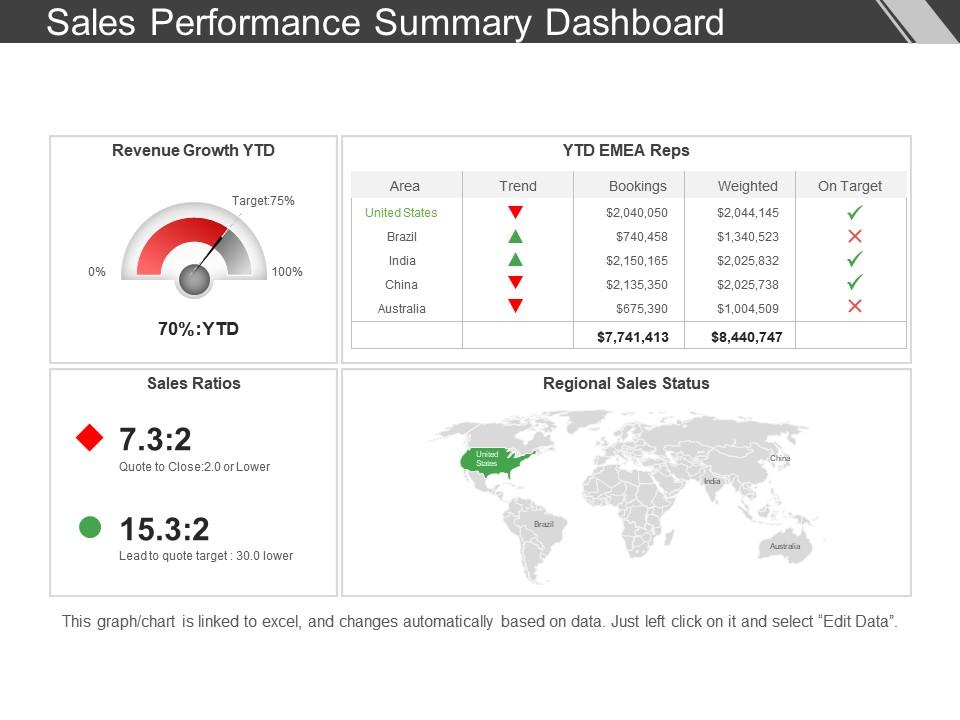
Template 3: Sales Performance Summary Dashboard Template
This sales dashboard is designed to help marketing managers oversee sales KPIs, project performance, and monitor them all in one location. It is an excellent performance analysis resource for drilling into data and gaining insights. This PPT Slide features four segments that display data-driven charts. It contains a graphical representation of Year-to-date (YTD) revenue growth, sales ratios, YTD EMEA reps, and a map indicating the regional sales status. This presentation can help you achieve your sales goals by providing extensive assessments of sales performance, cycle lengths, and sales funnels. Save it now!
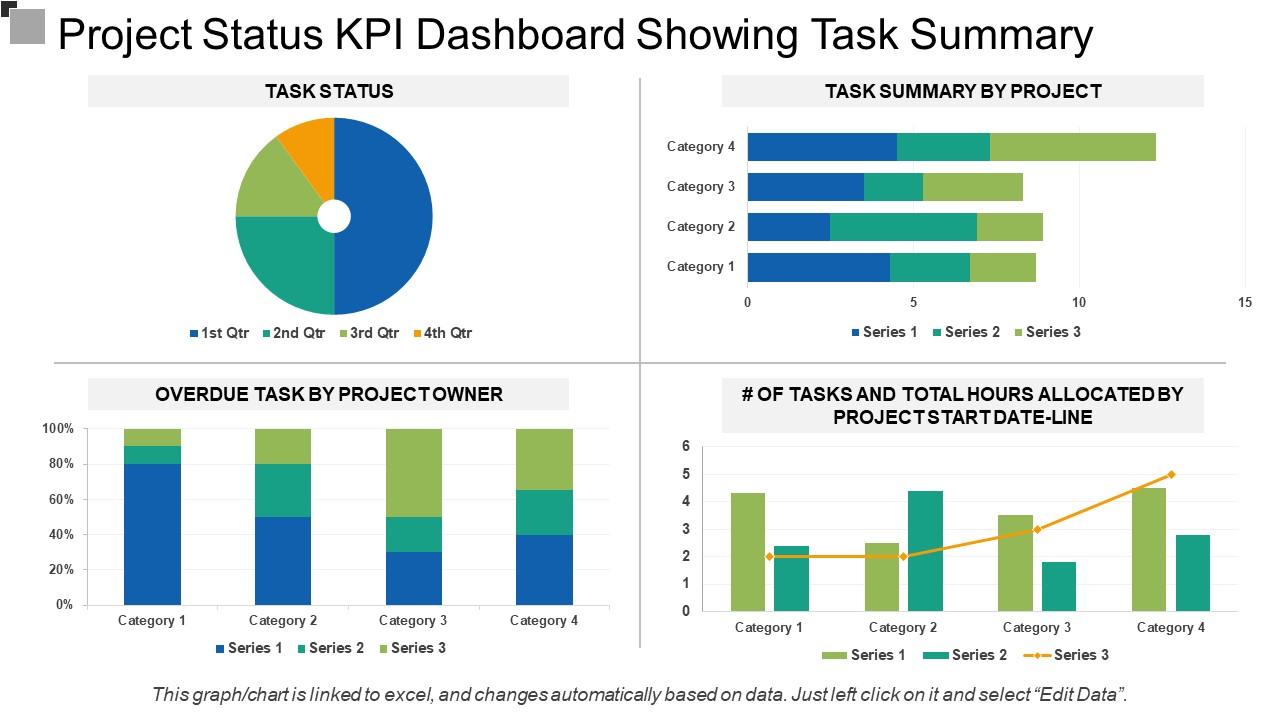
Template 4: Project Status KPI Dashboard Showing Task Summary
This project management dashboard includes a project performance status report that allows project managers and stakeholders to visualize data. It is a great tool for reviewing your project’s KPIs to meet milestones, enhance project estimation, and improve project performance. This four-column procedure displays project-related information such as task status, task summary by project, overdue tasks by project owner, and the number of tasks and total hours given. Use this PowerPoint Template to track the project’s timeframe, budget, quality, and effectiveness. Get it now!
Template 5: Social Media Performance Summary Dashboard Presentation
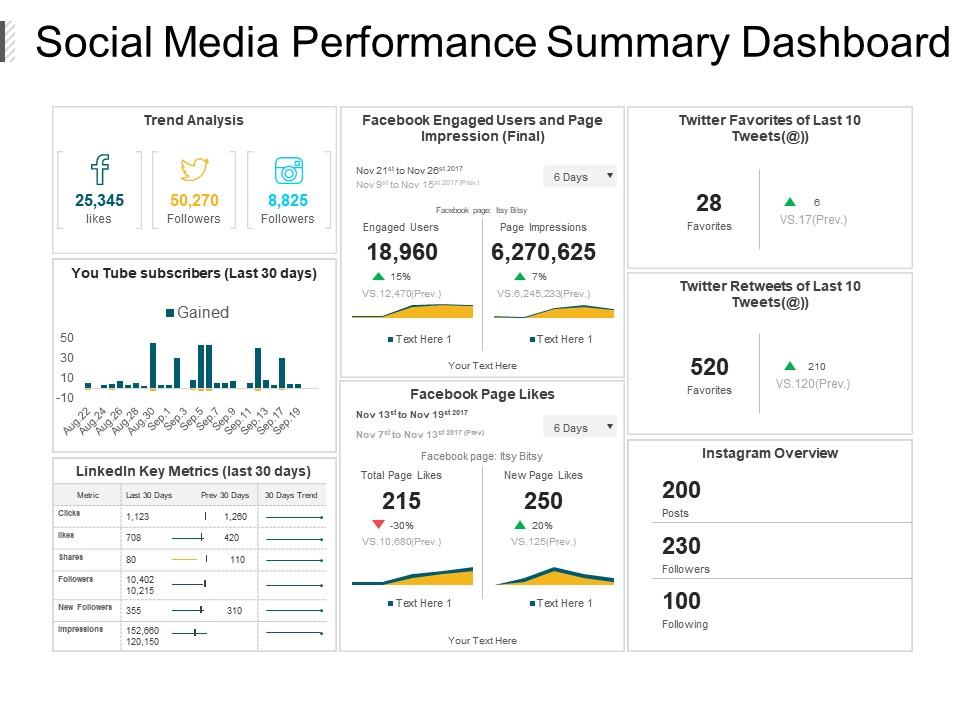
This social media summary dashboard is great to generate performance analysis of your social media marketing metrics and KPIs. This performance assessment is a vital tool to keep tab and offer company summary across social media platforms. It includes slots for analysis data covering major social networking platforms like trend analysis across platforms, Facebook engaged users and page impression, twitter favorites, twitter retweets, YouTube subscribers, LinkedIn metrics, Facebook page likes and Instagram overview. Download it now!
Template 6: Marketing Campaign Overall Impact Summary Dashboard PPT
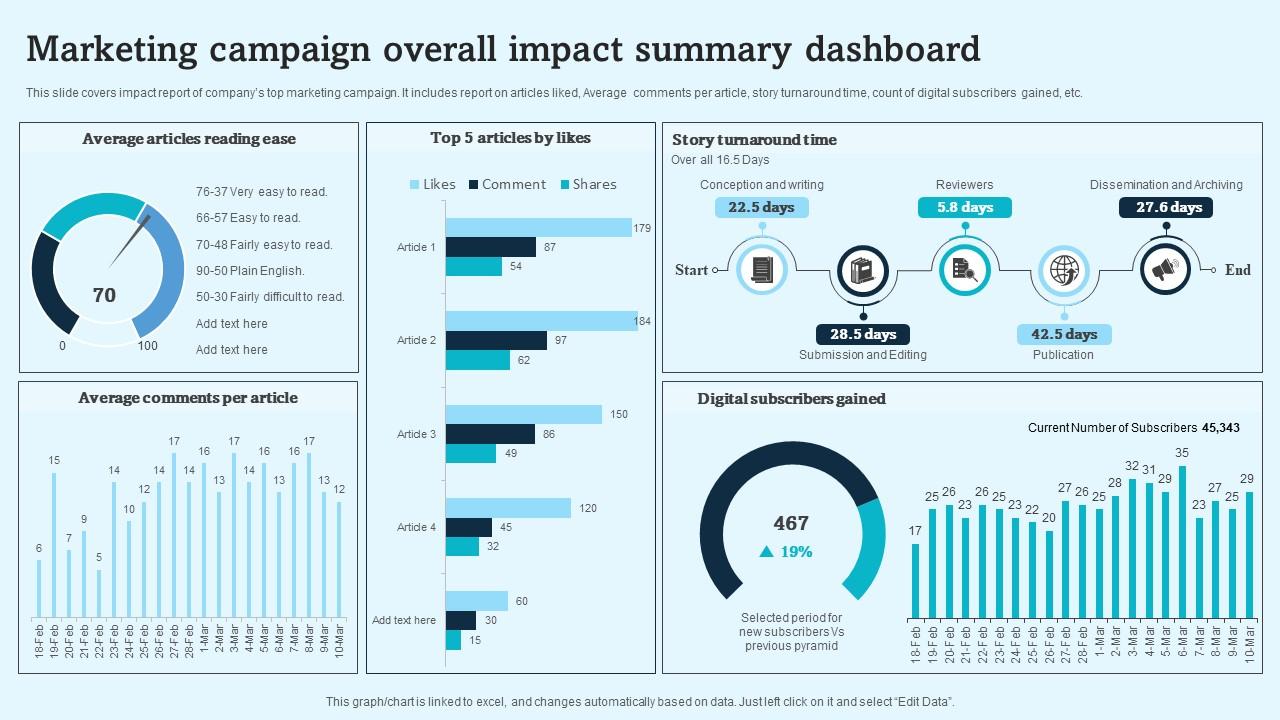
Need to demonstrate the impact of marketing on the company’s sales? Use this marketing campaign dashboard template to provide a depiction of Key Performance Indicators (KPIs) and other data related to your company's marketing efforts. This slide includes a report on articles liked, the average number of comments per item, the turnaround time for stories, the number of digital subscribers earned, and so on. Employ this PowerPoint Template to validate actions or change any sales or marketing strategy. Get it today!
Template 7: Product Sales Performance Summary Dashboard
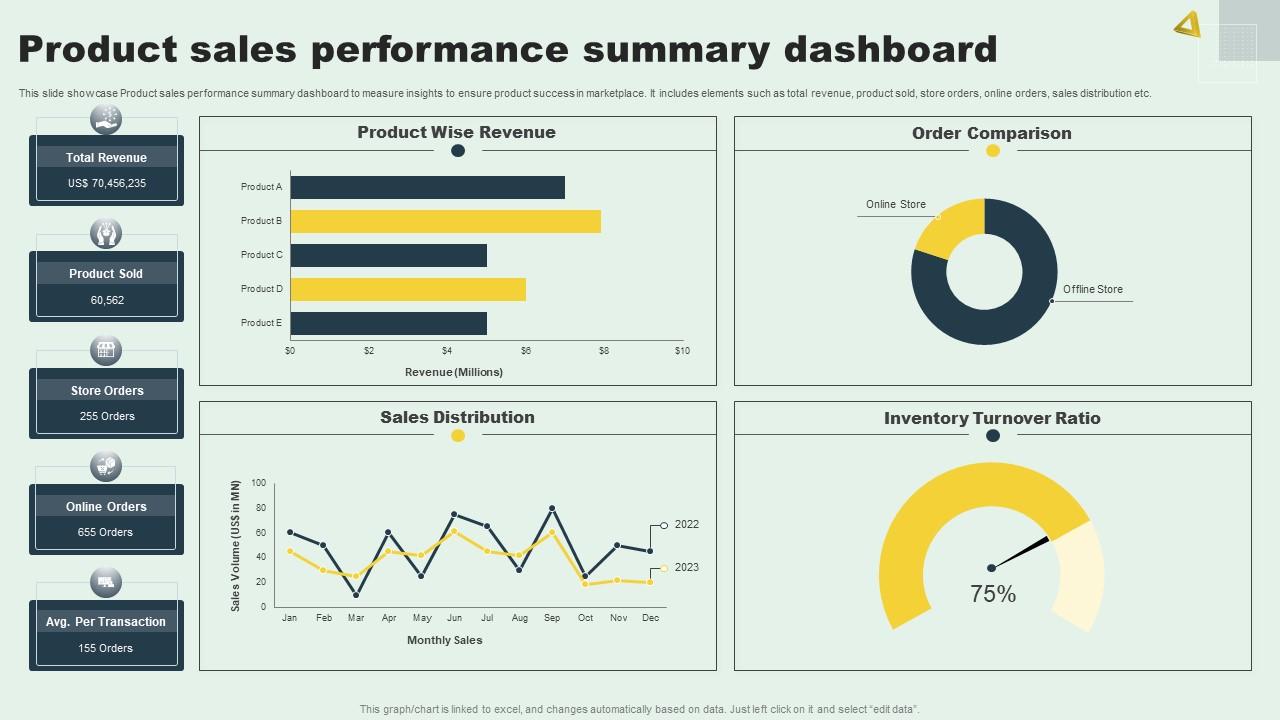
The right product, at the right place, to the right people—that’s what product performance data is all about. This performance evaluation will provide insights into ensuring product success in the marketplace. It covers revenue, product sales, store orders, internet orders, and sales distribution. Download this PPT for a full overview of major data sets. Grab it now!
Template 8: Corporate Performance Summary Dashboard Snapshot with Net Promoter Score
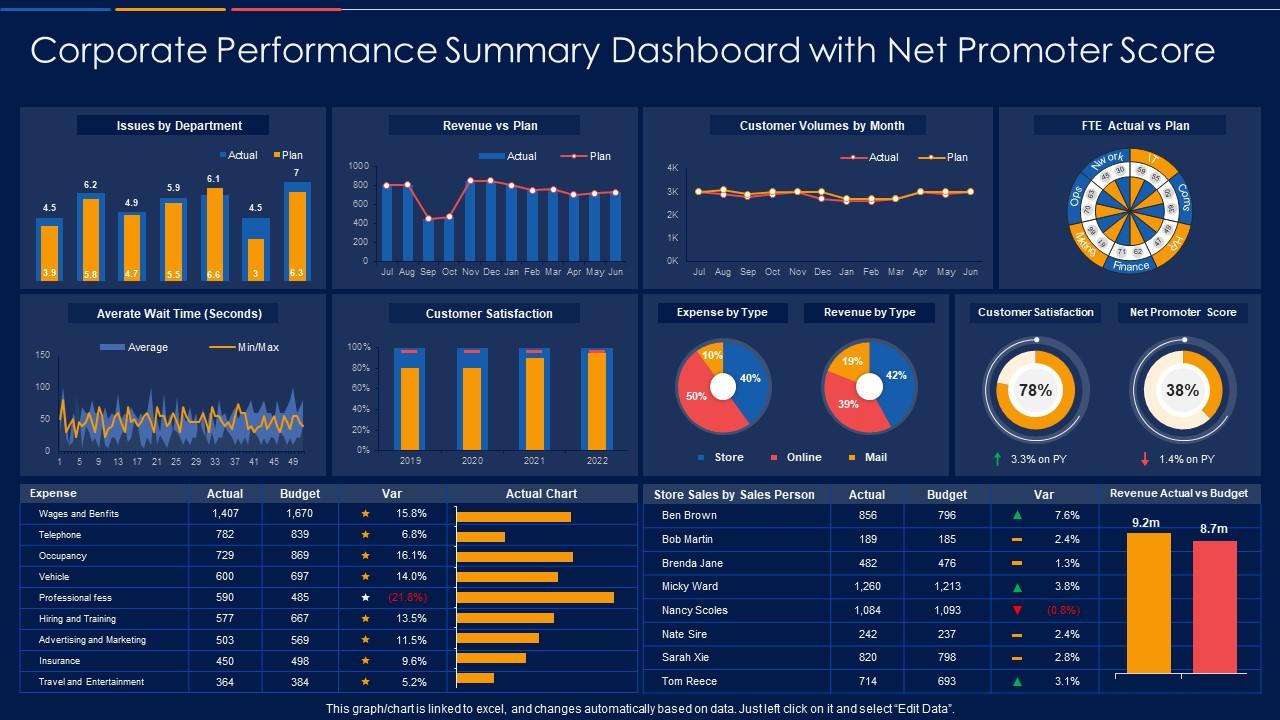
A company performance summary is a key management tool to gauge a project performance and progress. Use this PowerPoint Presentation to display a company summary and an in-depth assessment of the procedures and operations. It covers issues by department, revenue vs plan, customer volumes by month, FTE Actual vs Plan, and customer satisfaction. This custom-built presentation helps to make strategic financial decisions and ensure long-term viability. Grab it now!
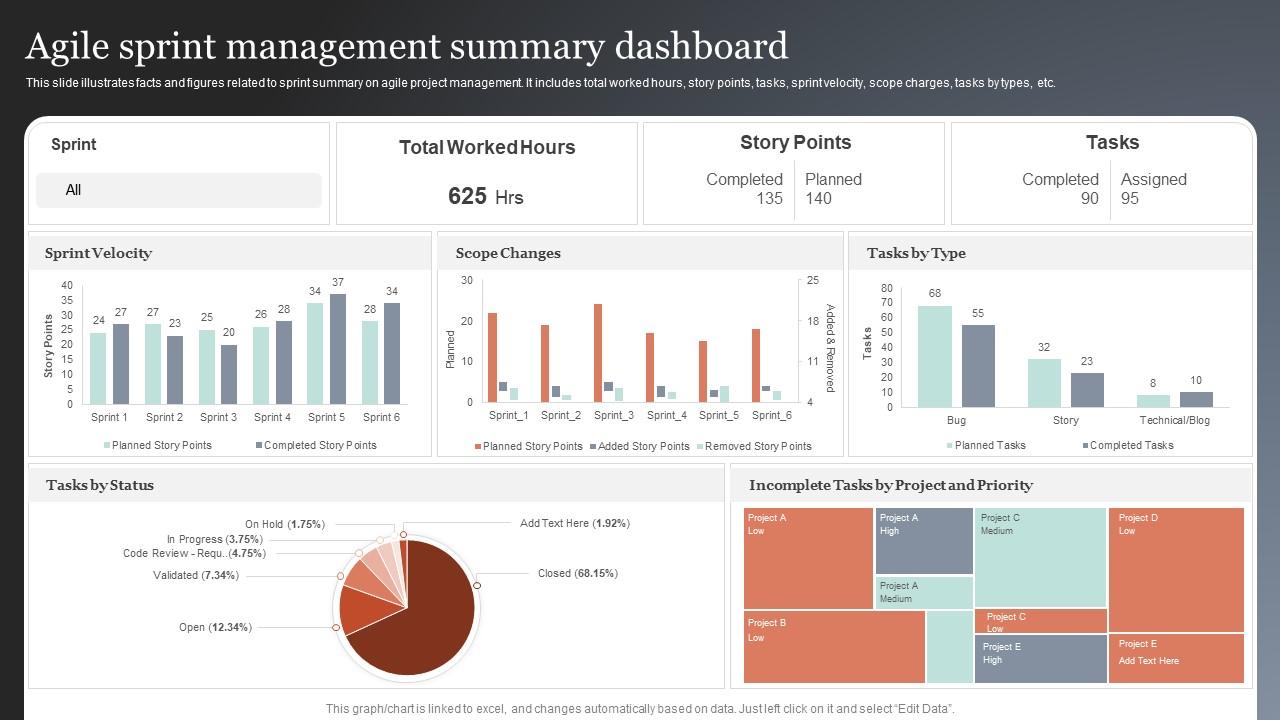
Template 9: Agile Sprint Management Summary Dashboard
This agile summary dashboard presents project performance data to keep project leaders informed. This summary of vital sprint management data is critical for gaining insight into the team’s development. This presentation depicts information and numbers connected to sprint summary, such as total worked hours, narrative points, tasks, sprint velocity, scope charges, task types, etc., to show project specifics in one place. This download allows you to go filter data for more in-depth research. Get it now!
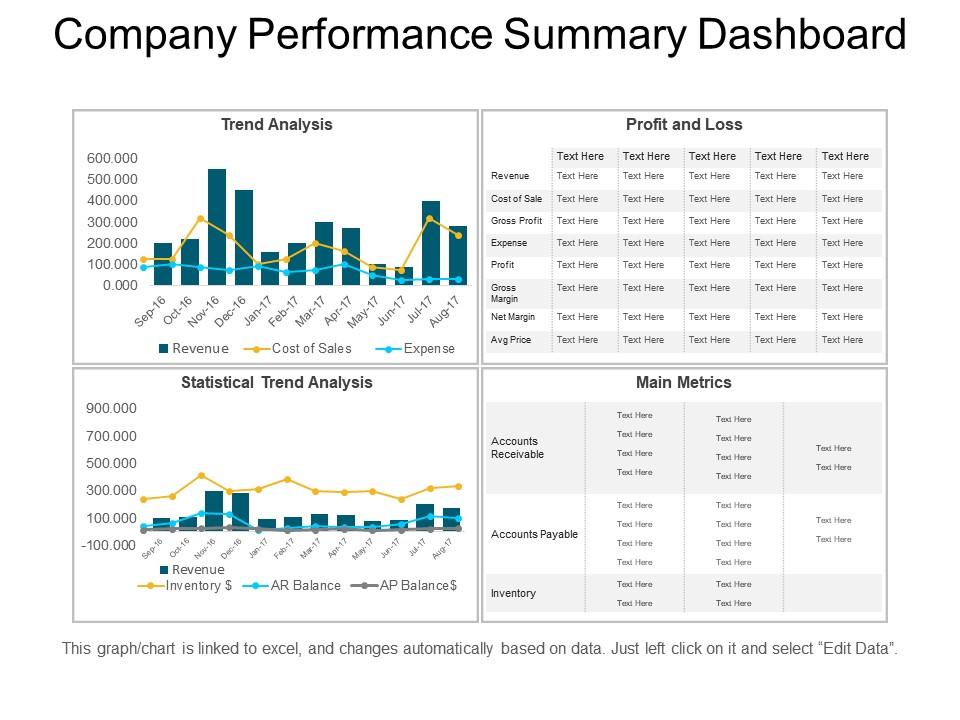
Template 10: Company Performance Summary Dashboard PPT
Our company performance summary dashboard PPT design allows you to assess the health of your finances. This PowerPoint Template helps in displaying your company’s financial capacity and position by presenting trend analysis, profit and loss statements, and other information in an infographic format. Explain the elements that may affect your financial efficiency and impinge on product value and quality, external and internal business considerations, consumer expectations, etc., to increase your company’s visibility. This PPT will take you deep into critical metrics, KPIs, and data analysis. Get it right away!
Start tracking your metrics.
Summary Dashboards are essential for identifying chances for improving your operations and business processes. Use SlideTeam’s PPT Templates to gain a high-level overview of critical corporate health data and determine what works and what doesn’t.
PS Extract relevant insights from your Excel file containing numerical responses in a flash. Use SlideTeam’s Market Research Dashboard Templates to plan your marketing strategy and increase the likelihood of engagement.




 Customer Reviews

