Market research is a complex data-driven area with several channels, programs, and key performance indicators (KPIs) that require close attention. The foundation of making well-informed judgments is employing a comprehensive Market Research Dashboard that presents a unified picture of the industry's numerous information sources.
The core of a Market Research Dashboard is its unparalleled capacity to centralize data from several research sources. This feature spares researchers from the time-consuming task of manually pulling data from numerous advertising networks or platforms by providing a unified repository where all relevant information merges seamlessly.
The importance of having a unified perspective of primary market data cannot be stressed enough. It enables research teams to closely monitor their performance, ensuring that no campaign escapes their examination. The Market Research Dashboard is one of the most significant and crucial tools in a market researcher's toolbox. Its distinct ability to deliver facts in an instructive and visually engaging manner distinguishes it from static presentations.
Essence of Market Research Dashboard
As opposed to traditional static forms, Market Research Dashboards are interactive and live, enabling users to participate actively with their data. Through dynamic visualization, survey data, the core of market research, gets groundbreaking value.
It might be difficult for decision-makers and stakeholders to quickly extract meaningful insights from an Excel file full of numerical replies. In contrast, interactive dashboards enable impact evaluation, provide a variety of chart kinds, and dynamically update with real-time data, resulting in an easily accessible and insightful medium for research.
Our hands-on and effective templates walk you through the process of crafting your market research dashboard. This translates into offering a structured approach to align your keywords with the appropriate ad groups. Additionally, it provides a space to strategize your marketing approach by identifying the target audience, enhancing the likelihood of engagement from potential customers, when they come across your ad. SlideTeam’s content-ready PPT Templates are 100% customizable and editable. They provide you with a much-needed head-start for crafting a market research dashboard.
Let’s Explore!
Template 1: Market Research Survey Analysis Dashboard
A market research dashboard is helpful in presenting survey data from market research studies to partners or clients. This PowerPoint Slide showcases a dashboard presenting an overview of the market survey. It includes the total number of surveys, respondents, collectors, average time taken in minutes, and partial respondents. A pie chart depicting a survey completion rate based on company departments like HR, marketing, R&D, etc., is presented. This template also displays the survey summary based on the survey creation date, questions, respondents, completion rate, and partial responses. This dashboard is an interactive technique that allows you to ask and answer several questions at once. Download now!
Template 2: Product Target Market Research Survey Result Reporting Dashboard
Market research is beneficial since guessing and gut impulses are ineffective when launching profitable products and generating effective marketing messaging. This PowerPoint Slide showcases a report presenting the results of a product market research survey to collect customer feedback about new products. It includes ingredient desire results, new product concept surveys, and demographic responses. The survey is based on the product's uniqueness, problem, effectiveness, trend, and safety. Market research surveys are an inexpensive and dependable method of gathering information from your target customers. Download now!
Template 3: Dashboard For Customer Feedback Analysis
This PowerPoint Slide aims to summarize the results of a business market research survey conducted by a marketing manager to collect customer feedback. The results provided are related to user description and user experience. You will not derive much value from your feedback if you don't analyze the results, regardless of how well-executed the survey is. With the correct survey design approach and data interpretation tools, you'll be able to gain significant findings from your survey results and help your organization thrive. Download now!
Template 4: Dashboard Showcasing Customer Brand Perception
The culmination of a customer's emotions, encounters, and ideas regarding a good or service is their brand perception. It is what people perceive a brand, not what it claims to represent. This PowerPoint Slide represents a dashboard showcasing brand metrics to measure customer perception. It illustrates brand awareness, customer loyalty, brand image, value, etc. Brand image is based on the product's outdoorsiness, comfort-ability, reliability, trendiness, and more. Customers grow more loyal to brands they believe in. Businesses that comprehend how consumers perceive their brands use this data to build brand equity.
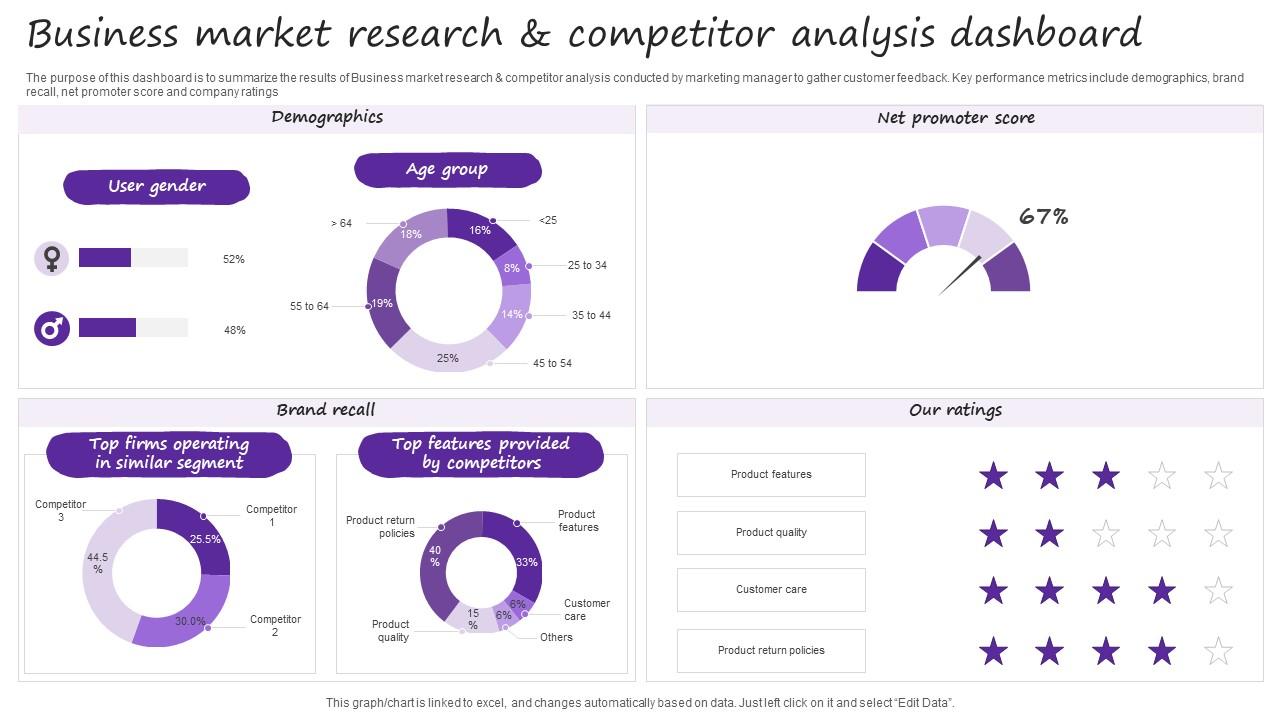
Template 5: Business Market Research And Competitor Analysis Dashboard
A competitive analysis may assist you in understanding the business landscape and making educated decisions to better your industry position. This dashboard aims to summarize the results of Business market research and competitor analysis conducted by marketing managers to gather customer feedback. Key performance metrics like demographics, brand recall, net promoter score, and company ratings are showcased in this PPT Template. Competitive studies are vital for every company seeking to flourish in an increasingly competitive and crowded marketplace. Download now!
Template 6: Dashboard For Customer Behavior Analysis
A customer behavior analysis looks at every phase of the customer journey and gives insight into what drives buying patterns using qualitative and quantitative approaches. This PowerPoint Slide depicts a customer behavioral research dashboard for business growth and a better decision-making process. It includes parameters such as net promoter score, customer purchase effort score, quality rating, pricing rating, product design, and more. Download now!
Template 7: Market Observation Research Results With KPI Dashboard Snapshot
Have you ever watched people at a crowded café or observed how shoppers behave in a store? Observational research gathers data by watching and recording people's behaviors in their natural environment. This PowerPoint Template highlights the KPIs of market research associated with customer satisfaction. It includes net promoter score, customer effort score, monthly NPS, CES trend, etc. Download now!
Template 8: Survey Analysis Dashboard
It's simpler than ever to conduct surveys—and as easy to become buried in survey data. Using this PowerPoint Template dashboard to communicate survey data and offer insights at presentations and meetings is a very efficient and practical approach to communicating survey data. This PowerPoint slide shows a dashboard for effectively analyzing market survey results and responses. It includes employee job satisfaction, organization size, survey respondents by country, etc. Download now!
Template 9: Dashboard For Customer Demographics
The Customer Demographics dashboard identifies your clients so that you can provide them with the appropriate goods and services. The following PowerPoint Slide consists of a dashboard that can be used to conduct market research on customer demographics and strategize accordingly. The key performance metrics include customer gender, education level, technology adopters, and brand innovators. Download now!
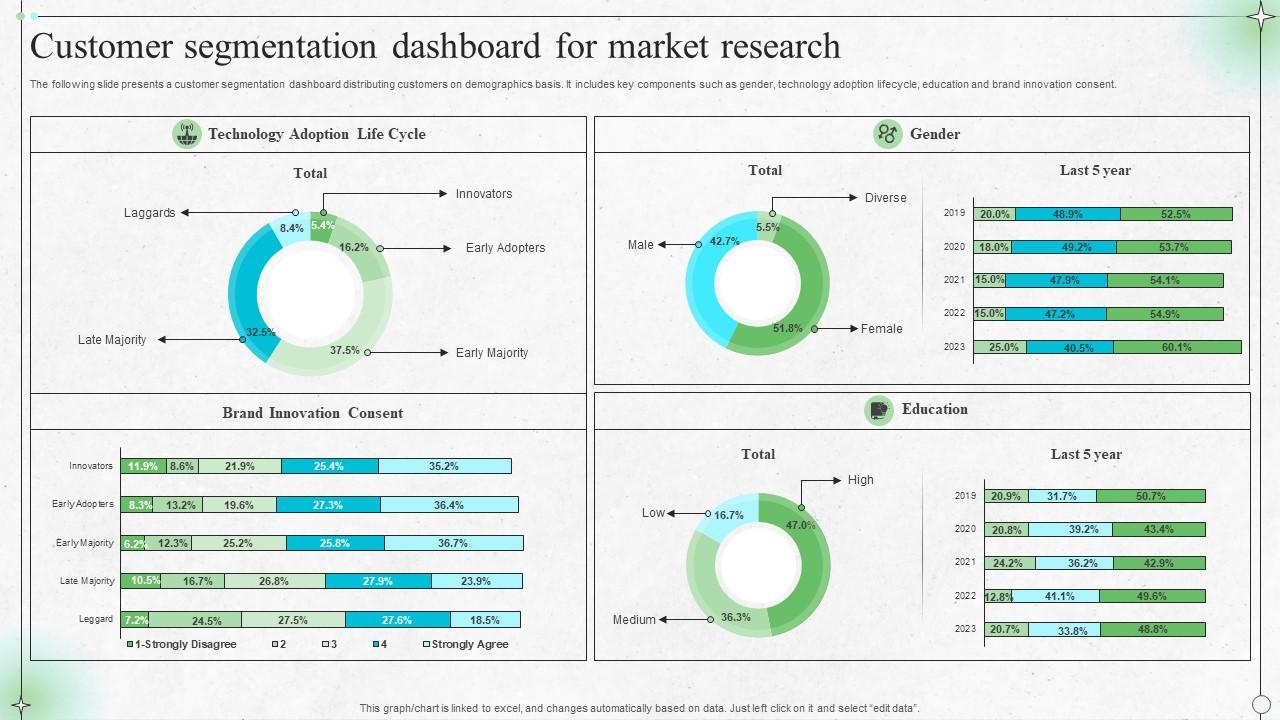
Template 10: Customer Segmentation Dashboard
This PowerPoint Slide presents a customer segmentation dashboard distributing customers on a demographic basis. It includes components such as gender, technology adoption lifecycle, education and brand innovation consent. Download now!
Final Word
The traditional difficulties related to dashboard construction or outsourcing are already obsolete. The ability to quickly create Market Research Dashboards gives you a world of possibilities. These dashboards provide information effectively and enable customers and researchers to investigate and solve many questions, enabling a collaborative and stimulating research environment.
In market research, the dashboard templates are light for discovering trends, monitoring campaign performance, and directing choices with a data-driven compass.


 Customer Reviews


