

Market Research Dashboard For Customer Feedback Analysis





Try Before you Buy Download Free Sample Product
 Impress Your
Audience
 100%
Editable
 Save Hours
of Time


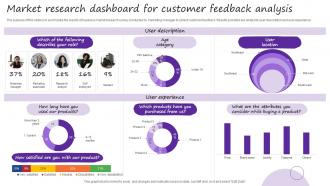
The purpose of this slide is to summarize the results of business market research survey conducted by marketing manager to collect customer feedback. Results provided are related to user description and user experience
People who downloaded this PowerPoint presentation also viewed the following :
Market Research Dashboard For Customer Feedback Analysis with all 7 slides:
Use our Market Research Dashboard For Customer Feedback Analysis to effectively help you save your valuable time. They are readymade to fit into any presentation structure.






FAQs for Market Research Dashboard For
A comprehensive market research dashboard should include customer acquisition costs, market share trends, competitor pricing analysis, customer satisfaction scores, and demographic segmentation data. These metrics enable organizations to track performance across multiple dimensions, identify emerging opportunities, and make data-driven strategic decisions, with many companies finding that integrated dashboards significantly enhance their competitive positioning and market responsiveness.
Visual elements enhance data interpretability by transforming complex datasets into intuitive charts, graphs, color-coded metrics, interactive filters, and trend visualizations that reveal patterns instantly. Through strategic use of heat maps, comparative bar charts, and dynamic segmentation tools, market researchers can identify consumer behavior shifts, competitive gaps, and emerging opportunities more efficiently, ultimately enabling faster strategic decisions and more targeted campaign development.
Effective tools for creating interactive market research dashboards include Tableau, Power BI, Qlik Sense, Looker, and D3.js for custom solutions. These platforms streamline data visualization by offering drag-and-drop functionality, real-time analytics, and seamless integration capabilities, with many organizations finding that interactive dashboards enhance decision-making speed and stakeholder engagement significantly.
Segmentation data maximizes impact through interactive heat maps, demographic breakdowns, behavioral flow charts, and geographic visualizations that reveal distinct customer patterns. These visual approaches enable marketing teams to identify high-value segments, optimize targeting strategies, and allocate resources more effectively, with many organizations finding that dynamic segmentation displays significantly enhance campaign performance and strategic decision-making.
Real-time data transforms market research dashboards from static reporting tools into dynamic decision-making platforms by delivering immediate insights into consumer behavior, competitor actions, and market fluctuations as they occur. This enables businesses to respond quickly to emerging trends, adjust marketing strategies instantly, and capitalize on time-sensitive opportunities, with many retail and financial services companies finding that real-time capabilities significantly enhance their competitive positioning and customer responsiveness.
Market research dashboards can be tailored through customized metrics, role-specific visualizations, and targeted data filters that align with each stakeholder's responsibilities and decision-making needs. Marketing teams focus on campaign performance and customer insights, while executives require high-level market trends and competitive positioning, with sales teams leveraging prospect data and territory analysis, ultimately enabling faster strategic decisions across all organizational levels.
Common pitfalls include overcrowding with excessive metrics, poor data visualization choices, lack of stakeholder input during design, ignoring mobile responsiveness, and failing to establish clear objectives. These design flaws can overwhelm users and reduce decision-making effectiveness, with many organizations finding that streamlined dashboards focusing on key performance indicators ultimately deliver better strategic insights and user adoption.
User feedback enhances market research dashboard design by identifying usability gaps, highlighting missing data visualizations, and revealing workflow inefficiencies that designers might overlook. Through iterative testing and stakeholder input, organizations can streamline navigation, customize reporting features, and optimize data presentation formats, ultimately delivering more intuitive interfaces and actionable insights for decision-makers.
Market research dashboards should integrate primary research data, competitive intelligence, social media analytics, customer feedback systems, and third-party market reports. These diverse sources streamline comprehensive analysis by combining survey insights, competitor positioning, consumer sentiment tracking, and industry benchmarks, with many organizations finding that this strategic combination delivers deeper market understanding and accelerated decision-making capabilities.
Industry benchmarks directly shape dashboard KPIs by providing comparative standards for metrics like market share, customer acquisition costs, conversion rates, and competitive positioning. These benchmarks enable organizations to contextualize their performance against sector leaders, identify performance gaps, and prioritize strategic initiatives, with many companies finding that benchmark-driven dashboards enhance decision-making and accelerate competitive advantage.
Best practices for updating and maintaining a market research dashboard include establishing regular data refresh schedules, implementing automated data validation checks, maintaining consistent visualization standards, conducting quarterly accuracy audits, and ensuring stakeholder feedback integration. These practices streamline decision-making by delivering real-time insights, minimizing data discrepancies, and enhancing analytical reliability, with many organizations finding that systematic maintenance ultimately delivers improved market responsiveness and competitive advantage.
Storytelling transforms market research dashboard insights by creating compelling narratives around data trends, customer behaviors, and market opportunities, helping stakeholders understand complex information through contextual frameworks. Through strategic data visualization and sequential presentation, organizations can guide audiences from problem identification to actionable solutions, ultimately delivering more persuasive presentations and faster decision-making across departments.
Essential security measures include end-to-end encryption, role-based access controls, multi-factor authentication, data anonymization protocols, and secure cloud infrastructure with compliance certifications. These safeguards enable organizations to confidently share market insights across teams while maintaining data integrity, with many financial services and healthcare companies finding that robust security frameworks ultimately enhance collaboration without compromising sensitive information.
Mobile-friendly designs significantly enhance market research dashboard usability by enabling responsive layouts, touch-optimized interactions, and streamlined data visualization across devices. Through adaptive interfaces, professionals in consulting, retail, and financial services access real-time insights seamlessly, conduct field research more efficiently, and make data-driven decisions faster, ultimately delivering competitive advantage in increasingly mobile business environments.
Innovations shaping market research dashboards include AI-powered predictive analytics, interactive 3D visualizations, real-time sentiment mapping, automated insight generation, and voice-activated query systems. These technologies streamline data interpretation by delivering personalized visual narratives, enabling natural language interactions, and providing predictive market modeling, with many research teams finding that advanced visualizations significantly accelerate decision-making processes.
-
Superb! The innovative and inspiring template designs provide an edge to the presentation.
-
I want to thank SlideTeam for the work that they do, especially their customer service.