Powerpoint Templates and Google slides for Dashboard
Save Your Time and attract your audience with our fully editable PPT Templates and Slides.
-
 Project Management Dashboard PowerPoint PPT Template Bundles
Introduce your topic and host expert discussion sessions with this Project Management Dashboard PowerPoint PPT Template Bundles. This template is designed using high-quality visuals, images, graphics, etc, that can be used to showcase your expertise. Different topics can be tackled using the sixty three slides included in this template. You can present each topic on a different slide to help your audience interpret the information more effectively. Apart from this, this PPT slideshow is available in two screen sizes, standard and widescreen making its delivery more impactful. This will not only help in presenting a birds-eye view of the topic but also keep your audience engaged. Since this PPT slideshow utilizes well-researched content, it induces strategic thinking and helps you convey your message in the best possible manner. The biggest feature of this design is that it comes with a host of editable features like color, font, background, etc. So, grab it now to deliver a unique presentation every time.
-
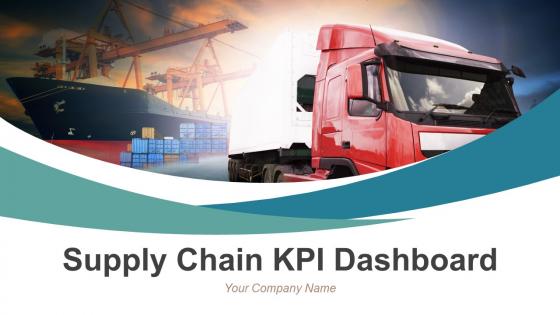 Supply Chain Kpi Dashboard Powerpoint Presentation Slides
Presenting our supply chain KPI dashboard PowerPoint presentation slides. This PowerPoint design contains fifty-nine slides in it which can be completely customized and edited. It is available for both standard as well as for widescreen formats. This PowerPoint template is compatible with all the presentation software like Microsoft Office, Google Slides, etc. You can download this PPT layout from below.
-
 Customer relationship management process and dashboard powerpoint presentation slides
58 presentation slides to utterly make it ready to download. 100% complete for a customer relationship manager, strategic thinker, business manager etc. Presentation templates having adequate space to insert titles, sub titles or logos. Manually customize color, layout or background to perfectly match your style. Easy option to introduce videos and animation. Works well with all modern software’s. Easy option to convert into PDF or JPG formats.
-
 Hospitality management industry kpi and dashboards powerpoint presentation slides
Presenting our Hospitality Management Industry KPI And Dashboards PowerPoint Presentation Slides. This is a 100% editable and adaptable PPT slide. You can save it in different formats like PDF, JPG, and PNG. It can be edited with different colour, font, font size, and font type of the template as per your requirements. This template supports the standard (4:3) and widescreen (16:9) format. It is also compatible with Google slides.
-
 Crm application dashboard powerpoint presentation slides
Presenting our CRM application dashboard PowerPoint presentation slides. This PowerPoint design contains forty nine slides in it which can be completely customized and edited. It is available for both standard as well as for widescreen formats. This PowerPoint template is compatible with all the presentation software like Microsoft Office, Google Slides, etc. It can be downloaded in varying formats like JPEG, PDF, PNG, etc. You can download this PPT layout from below.
-
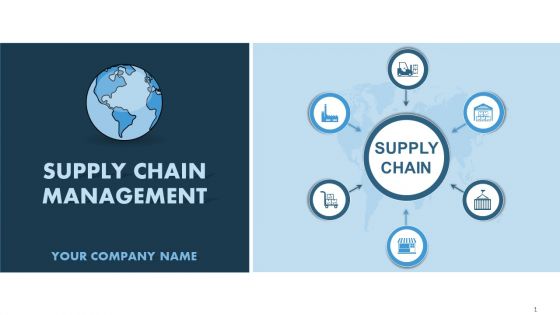 Supply chain management dashboard powerpoint presentation with slides
A complete set of ready made 47 PowerPoint slides perfect for a supply chain manager. All slide templates are of high resolution. Manually edit color, layout, text or PPT background as per your style. Original PPT info graphics illustrating each aspect. Effortless inclusion procedure to put in company logo, trademark or name. Exclusive Thank you and Business Quote presentation slides. Well compatible with Google slides. The stages in this process are order processing time,inventory management,demand forecasting,logistic management,cash flow optimization.
-
 Content Marketing Freelance Metrics Dashboard Powerpoint Ppt Template Bundles
If you require a professional template with great design,then this Content Marketing Freelance Metrics Dashboard Powerpoint Ppt Template Bundles is an ideal fit for you. Deploy it to enthrall your audience and increase your presentation threshold with the right graphics,images,and structure. Portray your ideas and vision using twenty seven slides included in this complete deck. This template is suitable for expert discussion meetings presenting your views on the topic. With a variety of slides having the same thematic representation,this template can be regarded as a complete package. It employs some of the best design practices,so everything is well-structured. Not only this,it responds to all your needs and requirements by quickly adapting itself to the changes you make. This PPT slideshow is available for immediate download in PNG,JPG,and PDF formats,further enhancing its usability. Grab it by clicking the download button.
-
 Dashboards By Function Powerpoint Presentation Slides
Presenting Dashboards By Function PowerPoint Presentation Slides. Get access to 29 visually impressive slides by downloading this complete PPT deck. All the templates feature 100% customizability. You can alter the patterns, background, color, font and text as per your choice. It is also possible to view it on Google Slides. You can also view this PowerPoint slideshow on standard and widescreen. Convert the PPT file format easily into PDF, PNG, or JPG.
-
 SaaS Dashboard Powerpoint Ppt Template Bundles
Engage buyer personas and boost brand awareness by pitching yourself using this prefabricated set. This SaaS Dashboard Powerpoint Ppt Template Bundles is a great tool to connect with your audience as it contains high quality content and graphics. This helps in conveying your thoughts in a well structured manner. It also helps you attain a competitive advantage because of its unique design and aesthetics. In addition to this, you can use this PPT design to portray information and educate your audience on various topics. With twenty slides, this is a great design to use for your upcoming presentations. Not only is it cost effective but also easily pliable depending on your needs and requirements. As such color, font, or any other design component can be altered. It is also available for immediate download in different formats such as PNG, JPG, etc. So, without any further ado, download it now.
-
 Dashboards Snapshot By Platform Powerpoint Presentation Slides
Introducing Dashboards Snapshot By Platform PowerPoint Presentation Slides. This is a complete PPT deck that comprises 27 professionally designed slides. You can edit them as per your convenience as they are 100% customizable. This PowerPoint slideshow is compatible with Google Slides. You may also convert and save the PPT in PDF, PNG, and JPG formats. Moreover, this presentation features a dual-screen aspect ratio and is a perfect fit for standard and widescreen.
-
 Dashboards By Industry Powerpoint Presentation Slides
This complete deck has PPT slides on Dashboards By Industry Powerpoint Presentation Slides with well-suited graphics and subject driven content. This deck consists of a total of twenty-seven slides. All templates are completely editable for your convenience. You can change the color, text and font size of these slides. You can add or delete the content as per your requirement. The templates are compatible with Google Slides so it can be easily accessible. It can be saved into various file formats like PDF, JPG. And PNG. It is available in both standard and widescreen formats.
-
 Project portfolio management kpi and dashboard powerpoint presentation slides
Presenting our content ready Portfolio Management KPI And Dashboard PowerPoint Presentation Slides. This PowerPoint deck comprises twenty-five fully editable slides. These slides support the standard(4:3) and widescreen(16:9) viewing angles. Alter the color, text, and font size of these layouts. This PPT slideshow is compatible with Google Slides. Convert these templates into various images or document formats like JPEG or PDF.
-
 Financial Assets Management Kpi And Dashboard Powerpoint Presentation Slides
This complete deck focuses on Financial Assets Management Kpi And Dashboard Powerpoint Presentation Slides and consists of professionally designed templates with suitable graphics and appropriate content. This deck has a total of twenty-five slides. Our designers have created customizable templates for your convenience. You can make the required changes in the templates like color, text and font size. The presentation is fully supported by Google Slides. It can be easily converted into JPG or PDF format. When you download this presentation by clicking the download button, you get the presentation in both standard and widescreen formats.
-
 Portfolio investment kpis and dashboard powerpoint presentation slides
This complete deck is oriented to make sure you do not lag in your presentations. Our creatively crafted slides come with apt research and planning. This exclusive deck with twenty-five slides is here to help you to strategize, plan, analyze, or segment the topic with clear understanding and apprehension. This slide is 100% editable in PowerPoint. You can alter the font type, size, diagram color, background color, etc. The presentation can be saved in multiple image formats such as JPEG, PNG, and PDF This presentation deck can be used by all professionals, managers, individuals, internal-external teams involved in any company organization.
-
 Portfolio management kpi and dashboard powerpoint presentation slides
Presenting our content ready Portfolio Management KPI And Dashboard PowerPoint Presentation Slides. This PowerPoint deck comprises twenty-five fully editable slides. These slides support the standard(4:3) and widescreen(16:9) viewing angles. Alter the color, text, and font size of these layouts. This PPT slideshow is compatible with Google Slides. Convert these templates into various images or document formats like JPEG or PDF.
-
 Hospitality Management KPI And Dashboard Powerpoint Presentation Slides
This complete deck focuses on Hospitality Management KPI And Dashboard Powerpoint Presentation Slides and consists of professionally designed templates with suitable graphics and appropriate content. Our designers have created customizable templates for your convenience. You can make the required changes in the templates like color, text and font size. Other than this, content can be added or deleted from the slide as per the requirement. The templates are compatible with Google Slides so it can be easily accessible. It can be saved into various file formats like PDF, JPG. And PNG. It is available in both standard and widescreen formats.
-
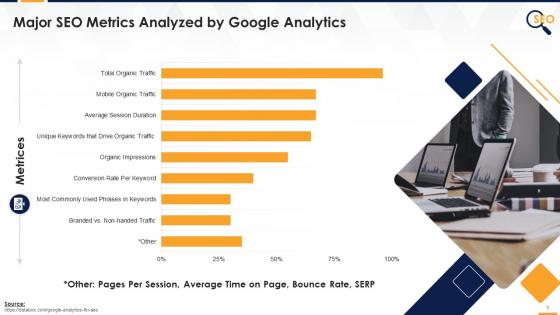 Google SEO Analytics Major Metrics Traffic Bounce Rate Page Speed Landing Pages Custom Dashboards And More Edu Ppt
Presenting Google SEO Analytics Major Metrics, Traffic, Bounce Rate, Page Speed, Landing Pages, Custom Dashboards and more. Our PowerPoint experts have included all the necessary templates, designs, icons, graphs, and other essential material. This deck is well crafted by an extensive research. Slides consist of amazing visuals and appropriate content. These PPT slides can be instantly downloaded with just a click. Compatible with all screen types and monitors. Supports Google Slides. Premium Customer Support available. Suitable for use by managers, employees, and organizations. These slides are easily customizable. You can edit the color, text, icon, and font size to suit your requirements.
-
 Problem Management Dashboard Powerpoint Ppt Template Bundles
If you require a professional template with great design, then this Problem Management Dashboard Powerpoint Ppt Template Bundles is an ideal fit for you. Deploy it to enthrall your audience and increase your presentation threshold with the right graphics, images, and structure. Portray your ideas and vision using twenty slides included in this complete deck. This template is suitable for expert discussion meetings presenting your views on the topic. With a variety of slides having the same thematic representation, this template can be regarded as a complete package. It employs some of the best design practices, so everything is well-structured. Not only this, it responds to all your needs and requirements by quickly adapting itself to the changes you make. This PPT slideshow is available for immediate download in PNG, JPG, and PDF formats, further enhancing its usability. Grab it by clicking the download button.
-
 Lab Dashboard Powerpoint Ppt Template Bundles
If you require a professional template with great design, then this Lab Dashboard Powerpoint Ppt Template Bundles is an ideal fit for you. Deploy it to enthrall your audience and increase your presentation threshold with the right graphics, images, and structure. Portray your ideas and vision using twenty slides included in this complete deck. This template is suitable for expert discussion meetings presenting your views on the topic. With a variety of slides having the same thematic representation, this template can be regarded as a complete package. It employs some of the best design practices, so everything is well structured. Not only this, it responds to all your needs and requirements by quickly adapting itself to the changes you make. This PPT slideshow is available for immediate download in PNG, JPG, and PDF formats, further enhancing its usability. Grab it by clicking the download button.
-
 Goal Status Dashboard Powerpoint Ppt Template Bundles
Deliver a lucid presentation by utilizing this Goal Status Dashboard Powerpoint Ppt Template Bundles. Use it to present an overview of the topic with the right visuals, themes, shapes, and graphics. This is an expertly designed complete deck that reinforces positive thoughts and actions. Use it to provide visual cues to your audience and help them make informed decisions. A wide variety of discussion topics can be covered with this creative bundle such as Progress Tracking, Organizational Goal Achievement Tracking, HR Goal Management Dashboard, Status Dashboard, Sales Target Management. All the sixteen slides are available for immediate download and use. They can be edited and modified to add a personal touch to the presentation. This helps in creating a unique presentation every time. Not only that, with a host of editable features, this presentation can be used by any industry or business vertical depending on their needs and requirements. The compatibility with Google Slides is another feature to look out for in the PPT slideshow.
-
 OKR Dashboard Powerpoint Ppt Template Bundles
Deliver a credible and compelling presentation by deploying this OKR Dashboard Powerpoint Ppt Template Bundles Intensify your message with the right graphics, images, icons, etc. presented in this complete deck. This PPT template is a great starting point to convey your messages and build a good collaboration. The sixteen slides added to this PowerPoint slideshow helps you present a thorough explanation of the topic. You can use it to study and present various kinds of information in the form of stats, figures, data charts, and many more. This sixteen PPT slideshow is available for use in standard and widescreen aspects ratios. So, you can use it as per your convenience. Apart from this, it can be downloaded in PNG, JPG, and PDF formats, all completely editable and modifiable. The most profound feature of this PPT design is that it is fully compatible with Google Slides making it suitable for every industry and business domain.
-
 Finance Portfolio Management KPIs And Dashboard Powerpoint Presentation Slides
Presenting our Finance Portfolio Management KPIs And Dashboard PowerPoint Presentation Slides. This is a 100% editable and adaptable PPT slide. You can save it in different formats like PDF, JPG, and PNG. It can be edited with different color, font, font size, and font type of the template as per your requirements. This template supports the standard (4:3) and widescreen (16:9) format. It is also compatible with Google slides.
-
 Devops dashboard it powerpoint presentation slides
Deliver an informational PPT on various topics by using this DevOps Dashboard IT Powerpoint Presentation Slides. This deck focuses and implements best industry practices, thus providing a birds-eye view of the topic. Encompassed with twenty two slides, designed using high-quality visuals and graphics, this deck is a complete package to use and download. All the slides offered in this deck are subjective to innumerable alterations, thus making you a pro at delivering and educating. You can modify the color of the graphics, background, or anything else as per your needs and requirements. It suits every business vertical because of its adaptable layout.
-
 Employee Payroll Dashboard Powerpoint Ppt Template Bundles
Deliver a credible and compelling presentation by deploying this Employee Payroll Dashboard Powerpoint Ppt Template Bundles. Intensify your message with the right graphics, images, icons, etc. presented in this complete deck. This PPT template is a great starting point to convey your messages and build a good collaboration. The seventeen slides added to this PowerPoint slideshow helps you present a thorough explanation of the topic. You can use it to study and present various kinds of information in the form of stats, figures, data charts, and many more. This Employee Payroll Dashboard Powerpoint Ppt Template Bundles PPT slideshow is available for use in standard and widescreen aspects ratios. So, you can use it as per your convenience. Apart from this, it can be downloaded in PNG, JPG, and PDF formats, all completely editable and modifiable. The most profound feature of this PPT design is that it is fully compatible with Google Slides making it suitable for every industry and business domain.
-
 Compensation Dashboard Powerpoint Ppt Template Bundles
Deliver an informational PPT on various topics by using this Compensation Dashboard Powerpoint Ppt Template Bundles. This deck focuses and implements best industry practices, thus providing a birds eye view of the topic. Encompassed with seventeen slides, designed using high quality visuals and graphics, this deck is a complete package to use and download. All the slides offered in this deck are subjective to innumerable alterations, thus making you a pro at delivering and educating. You can modify the color of the graphics, background, or anything else as per your needs and requirements. It suits every business vertical because of its adaptable layout.
-
 Payment Dashboard Powerpoint Ppt Template Bundles
Engage buyer personas and boost brand awareness by pitching yourself using this prefabricated set. This Payment Dashboard Powerpoint Ppt Template Bundles is a great tool to connect with your audience as it contains high-quality content and graphics. This helps in conveying your thoughts in a well-structured manner. It also helps you attain a competitive advantage because of its unique design and aesthetics. In addition to this, you can use this PPT design to portray information and educate your audience on various topics. With seventeen slides, this is a great design to use for your upcoming presentations. Not only is it cost-effective but also easily pliable depending on your needs and requirements. As such color, font, or any other design component can be altered. It is also available for immediate download in different formats such as PNG, JPG, etc. So, without any further ado, download it now.
-
 Agriculture Dashboard Powerpoint PPT Template Bundles
Deliver a credible and compelling presentation by deploying this Agriculture Dashboard Powerpoint PPT Template Bundles. Intensify your message with the right graphics, images, icons, etc. presented in this complete deck. This PPT template is a great starting point to convey your messages and build a good collaboration. The seventeen slides added to this PowerPoint slideshow helps you present a thorough explanation of the topic. You can use it to study and present various kinds of information in the form of stats, figures, data charts, and many more. This Agriculture Dashboard Powerpoint PPT Template Bundles PPT slideshow is available for use in standard and widescreen aspects ratios. So, you can use it as per your convenience. Apart from this, it can be downloaded in PNG, JPG, and PDF formats, all completely editable and modifiable. The most profound feature of this PPT design is that it is fully compatible with Google Slides making it suitable for every industry and business domain.
-
 Information Security Dashboard Powerpoint Ppt Template Bundles
Deliver a credible and compelling presentation by deploying this Information Security Dashboard Powerpoint Ppt Template Bundles. Intensify your message with the right graphics, images, icons, etc. presented in this complete deck. This PPT template is a great starting point to convey your messages and build a good collaboration. The seventeen slides added to this PowerPoint slideshow helps you present a thorough explanation of the topic. You can use it to study and present various kinds of information in the form of stats, figures, data charts, and many more. This Information Security Dashboard Powerpoint Ppt Template Bundles PPT slideshow is available for use in standard and widescreen aspects ratios. So, you can use it as per your convenience. Apart from this, it can be downloaded in PNG, JPG, and PDF formats, all completely editable and modifiable. The most profound feature of this PPT design is that it is fully compatible with Google Slides making it suitable for every industry and business domain.
-
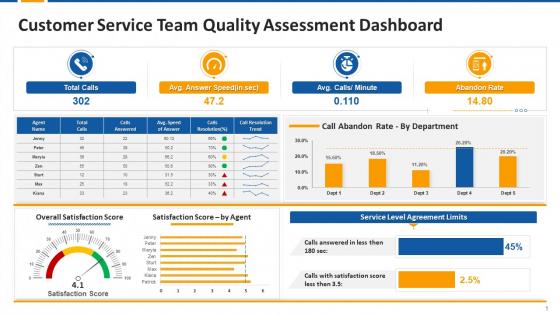 Customer Support Quality Assurance Dashboards Edu Ppt
Presenting Customer Support Quality Assurance Dashboards. This slide is well crafted and designed by our PowerPoint specialists. This PPT presentation is thoroughly researched by the experts, and every slide consists of appropriate content. You can add or delete the content as per your need.
-
 JIRA Dashboarding Powerpoint Ppt Template Bundles
If you require a professional template with great design, then this JIRA Dashboarding Powerpoint Ppt Template Bundles is an ideal fit for you. Deploy it to enthrall your audience and increase your presentation threshold with the right graphics, images, and structure. Portray your ideas and vision using sixteen slides included in this complete deck. This template is suitable for expert discussion meetings presenting your views on the topic. With a variety of slides having the same thematic representation, this template can be regarded as a complete package. It employs some of the best design practices, so everything is well-structured. Not only this, it responds to all your needs and requirements by quickly adapting itself to the changes you make. This PPT slideshow is available for immediate download in PNG, JPG, and PDF formats, further enhancing its usability. Grab it by clicking the download button.
-
 Operations Dashboard Powerpoint Ppt Template Bundles
Deliver a credible and compelling presentation by deploying this Operations Dashboard Powerpoint Ppt Template Bundles. Intensify your message with the right graphics, images, icons, etc. presented in this complete deck. This PPT template is a great starting point to convey your messages and build a good collaboration. The sixteen slides added to this PowerPoint slideshow helps you present a thorough explanation of the topic. You can use it to study and present various kinds of information in the form of stats, figures, data charts, and many more. This Operations Dashboard Powerpoint Ppt Template Bundles PPT slideshow is available for use in standard and widescreen aspects ratios. So, you can use it as per your convenience. Apart from this, it can be downloaded in PNG, JPG, and PDF formats, all completely editable and modifiable. The most profound feature of this PPT design is that it is fully compatible with Google Slides making it suitable for every industry and business domain.
-
 Safety KPI Dashboard Powerpoint Ppt Template Bundles
If you require a professional template with great design,then this Safety KPI Dashboard Powerpoint Ppt Template Bundles is an ideal fit for you. Deploy it to enthrall your audience and increase your presentation threshold with the right graphics,images,and structure. Portray your ideas and vision using sixteen slides included in this complete deck. This template is suitable for expert discussion meetings presenting your views on the topic. With a variety of slides having the same thematic representation,this template can be regarded as a complete package. It employs some of the best design practices,so everything is well-structured. Not only this,it responds to all your needs and requirements by quickly adapting itself to the changes you make. This PPT slideshow is available for immediate download in PNG,JPG,and PDF formats,further enhancing its usability. Grab it by clicking the download button.
-
 BI Dashboard PowerPoint PPT Template Bundles
If you require a professional template with great design, then this BI Dashboard PowerPoint PPT Template Bundles is an ideal fit for you. Deploy it to enthrall your audience and increase your presentation threshold with the right graphics, images, and structure. Portray your ideas and vision using sixteen slides included in this complete deck. This template is suitable for expert discussion meetings presenting your views on the topic. With a variety of slides having the same thematic representation, this template can be regarded as a complete package. It employs some of the best design practices, so everything is well structured. Not only this, it responds to all your needs and requirements by quickly adapting itself to the changes you make. This PPT slideshow is available for immediate download in PNG, JPG, and PDF formats, further enhancing its usability. Grab it by clicking the download button.
-
 Corporate Dashboard Powerpoint Ppt Template Bundles
If you require a professional template with great design, then this Corporate Dashboard Powerpoint Ppt Template Bundles is an ideal fit for you. Deploy it to enthrall your audience and increase your presentation threshold with the right graphics, images, and structure. Portray your ideas and vision using twelve slides included in this complete deck. This template is suitable for expert discussion meetings presenting your views on the topic. With a variety of slides having the same thematic representation, this template can be regarded as a complete package. It employs some of the best design practices, so everything is well structured. Not only this, it responds to all your needs and requirements by quickly adapting itself to the changes you make. This PPT slideshow is available for immediate download in PNG, JPG, and PDF formats, further enhancing its usability. Grab it by clicking the download button.
-
 Dashboard Reporting Powerpoint Ppt Template Bundles
Engage buyer personas and boost brand awareness by pitching yourself using this prefabricated set. This Dashboard Reporting Powerpoint Ppt Template Bundles is a great tool to connect with your audience as it contains high quality content and graphics. This helps in conveying your thoughts in a well structured manner. It also helps you attain a competitive advantage because of its unique design and aesthetics. In addition to this, you can use this PPT design to portray information and educate your audience on various topics. With twelve slides, this is a great design to use for your upcoming presentations. Not only is it cost effective but also easily pliable depending on your needs and requirements. As such color, font, or any other design component can be altered. It is also available for immediate download in different formats such as PNG, JPG, etc. So, without any further ado, download it now.
-
 Compliance Dashboard Powerpoint Ppt Template Bundles
Deliver a lucid presentation by utilizing this Compliance Dashboard Powerpoint Ppt Template Bundles. Use it to present an overview of the topic with the right visuals, themes, shapes, and graphics. This is an expertly designed complete deck that reinforces positive thoughts and actions. Use it to provide visual cues to your audience and help them make informed decisions. A wide variety of discussion topics can be covered with this creative bundle such as Compliance Management, Project Compliance KPIs, Regulatory Monitoring Indicators, Governance Dashboards, Adherence Reporting. All the twelve slides are available for immediate download and use. They can be edited and modified to add a personal touch to the presentation. This helps in creating a unique presentation every time. Not only that, with a host of editable features, this presentation can be used by any industry or business vertical depending on their needs and requirements. The compatibility with Google Slides is another feature to look out for in the PPT slideshow.
-
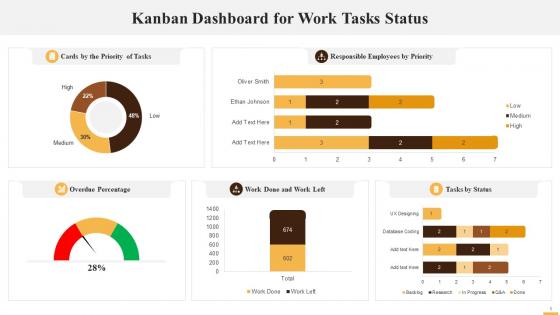 Kanban Dashboard For Work Tasks Status Training Ppt
Presenting Kanban Dashboard for Work Tasks Status. This PPT presentation is meticulously researched and each slide consists of relevant content. Designed by SlideTeams PowerPoint experts, this PPT is fully customizable alter the colors, text, icons, and font size to meet your requirements. Compatible with Google Slides and backed by excellent customer support. Download to present with poise and assurance.
-
 Supply Chain KPI Dashboard Powerpoint Ppt Template Bundles
Deliver a lucid presentation by utilizing this Supply Chain KPI Dashboard Powerpoint Ppt Template Bundles. Use it to present an overview of the topic with the right visuals, themes, shapes, and graphics. This is an expertly designed complete deck that reinforces positive thoughts and actions. Use it to provide visual cues to your audience and help them make informed decisions. A wide variety of discussion topics can be covered with this creative bundle such as Freight Bill KPI, Warehouse Capacity, Average Purchase Value, Supply Chain Metrics, Total Savings. All the twelve slides are available for immediate download and use. They can be edited and modified to add a personal touch to the presentation. This helps in creating a unique presentation every time. Not only that, with a host of editable features, this presentation can be used by any industry or business vertical depending on their needs and requirements. The compatibility with Google Slides is another feature to look out for in the PPT slideshow.
-
 Transportation Dashboard Powerpoint Ppt Template Bundles
Engage buyer personas and boost brand awareness by pitching yourself using this prefabricated set. This Transportation Dashboard Powerpoint Ppt Template Bundles is a great tool to connect with your audience as it contains high-quality content and graphics. This helps in conveying your thoughts in a well-structured manner. It also helps you attain a competitive advantage because of its unique design and aesthetics. In addition to this, you can use this PPT design to portray information and educate your audience on various topics. With fifteen slides, this is a great design to use for your upcoming presentations. Not only is it cost-effective but also easily pliable depending on your needs and requirements. As such color, font, or any other design component can be altered. It is also available for immediate download in different formats such as PNG, JPG, etc. So, without any further ado, download it now.
-
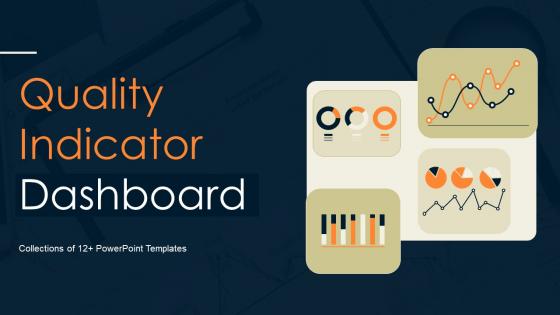 Quality Indicator Dashboard Powerpoint Ppt Template Bundles
If you require a professional template with great design, then this Quality Indicator Dashboard Powerpoint Ppt Template Bundles is an ideal fit for you. Deploy it to enthrall your audience and increase your presentation threshold with the right graphics, images, and structure. Portray your ideas and vision using fifteen slides included in this complete deck. This template is suitable for expert discussion meetings presenting your views on the topic. With a variety of slides having the same thematic representation, this template can be regarded as a complete package. It employs some of the best design practices, so everything is well-structured. Not only this, it responds to all your needs and requirements by quickly adapting itself to the changes you make. This PPT slideshow is available for immediate download in PNG, JPG, and PDF formats, further enhancing its usability. Grab it by clicking the download button.
-
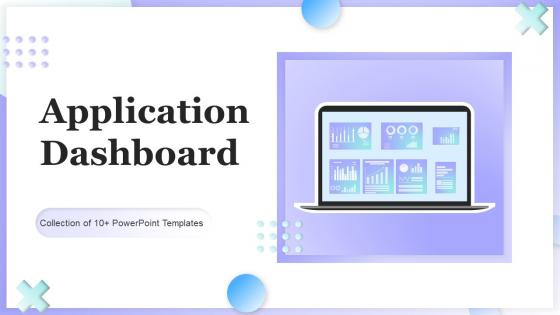 Application Dashboard Powerpoint Ppt Template Bundles
If you require a professional template with great design, then this Application Dashboard Powerpoint Ppt Template Bundles is an ideal fit for you. Deploy it to enthrall your audience and increase your presentation threshold with the right graphics, images, and structure. Portray your ideas and vision using fifteen slides included in this complete deck. This template is suitable for expert discussion meetings presenting your views on the topic. With a variety of slides having the same thematic representation, this template can be regarded as a complete package. It employs some of the best design practices, so everything is well structured. Not only this, it responds to all your needs and requirements by quickly adapting itself to the changes you make. This PPT slideshow is available for immediate download in PNG, JPG, and PDF formats, further enhancing its usability. Grab it by clicking the download button.
-
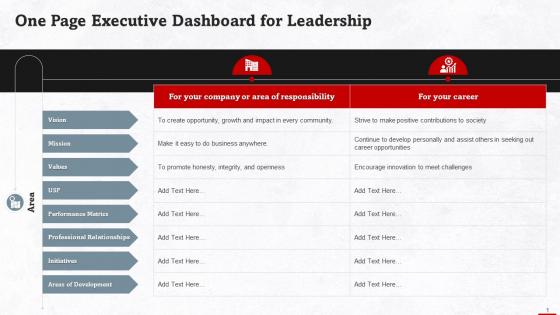 One Page Executive Dashboard For Leaders Training Ppt
Presenting One Page Executive Dashboard for Leaders. This PPT presentation is thoroughly researched and each slide consists of appropriate content. Designed by PowerPoint specialists, this PPT is fully customizable alter the colors, text, icons, and font size to meet your needs. Compatible with Google Slides and backed by superior customer support. Download today to deliver your presentation confidently.
-
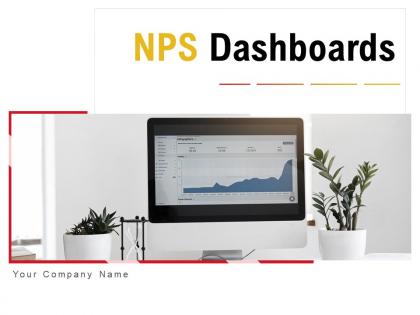 NPS Dashboards Powerpoint Presentation Slides
Deliver an informational PPT on various topics by using this NPS Dashboards Powerpoint Presentation Slides. This deck focuses and implements best industry practices, thus providing a birds eye view of the topic. Encompassed with nineteen slides, designed using high quality visuals and graphics, this deck is a complete package to use and download. All the slides offered in this deck are subjective to innumerable alterations, thus making you a pro at delivering and educating. You can modify the color of the graphics, background, or anything else as per your needs and requirements. It suits every business vertical because of its adaptable layout.
-
 Risk KPI Dashboard Powerpoint Ppt Template Bundles
Deliver a lucid presentation by utilizing this Risk KPI Dashboard Powerpoint Ppt Template Bundles. Use it to present an overview of the topic with the right visuals, themes, shapes, and graphics. This is an expertly designed complete deck that reinforces positive thoughts and actions. Use it to provide visual cues to your audience and help them make informed decisions. A wide variety of discussion topics can be covered with this creative bundle such as fourteen. All the fourteenslides are available for immediate download and use. They can be edited and modified to add a personal touch to the presentation. This helps in creating a unique presentation every time. Not only that, with a host of editable features, this presentation can be used by any industry or business vertical depending on their needs and requirements. The compatibility with Google Slides is another feature to look out for in the PPT slideshow.
-
 Shipping Dashboard Powerpoint Ppt Template Bundles
Introduce your topic and host expert discussion sessions with this Shipping Dashboard Powerpoint Ppt Template Bundles. This template is designed using high-quality visuals, images, graphics, etc, that can be used to showcase your expertise. Different topics can be tackled using the forteen slides included in this template. You can present each topic on a different slide to help your audience interpret the information more effectively. Apart from this, this PPT slideshow is available in two screen sizes, standard and widescreen making its delivery more impactful. This will not only help in presenting a birds-eye view of the topic but also keep your audience engaged. Since this PPT slideshow utilizes well-researched content, it induces strategic thinking and helps you convey your message in the best possible manner. The biggest feature of this design is that it comes with a host of editable features like color, font, background, etc. So, grab it now to deliver a unique presentation every time.
-
 Product Development Dashboard Powerpoint Ppt Template Bundles
If you require a professional template with great design, then this Product Development Dashboard Powerpoint Ppt Template Bundles is an ideal fit for you. Deploy it to enthrall your audience and increase your presentation threshold with the right graphics, images, and structure. Portray your ideas and vision using fourteen slides included in this complete deck. This template is suitable for expert discussion meetings presenting your views on the topic. With a variety of slides having the same thematic representation, this template can be regarded as a complete package. It employs some of the best design practices, so everything is well-structured. Not only this, it responds to all your needs and requirements by quickly adapting itself to the changes you make. This PPT slideshow is available for immediate download in PNG, JPG, and PDF formats, further enhancing its usability. Grab it by clicking the download button.
-
 Capital Project Dashboard Powerpoint Ppt Template Bundles
If you require a professional template with great design, then this Capital Project Dashboard Powerpoint Ppt Template Bundles is an ideal fit for you. Deploy it to enthrall your audience and increase your presentation threshold with the right graphics, images, and structure. Portray your ideas and vision using fourteen slides included in this complete deck. This template is suitable for expert discussion meetings presenting your views on the topic. With a variety of slides having the same thematic representation, this template can be regarded as a complete package. It employs some of the best design practices, so everything is well-structured. Not only this, it responds to all your needs and requirements by quickly adapting itself to the changes you make. This PPT slideshow is available for immediate download in PNG, JPG, and PDF formats, further enhancing its usability. Grab it by clicking the download button.
-
 Telecom Dashboard Powerpoint PPT Template Bundles
If you require a professional template with great design, then this Telecom Dashboard Powerpoint PPT Template Bundles is an ideal fit for you. Deploy it to enthrall your audience and increase your presentation threshold with the right graphics, images, and structure. Portray your ideas and vision using fourteen slides included in this complete deck. This template is suitable for expert discussion meetings presenting your views on the topic. With a variety of slides having the same thematic representation, this template can be regarded as a complete package. It employs some of the best design practices, so everything is well structured. Not only this, it responds to all your needs and requirements by quickly adapting itself to the changes you make. This PPT slideshow is available for immediate download in PNG, JPG, and PDF formats, further enhancing its usability. Grab it by clicking the download button.
-
 Learning And Development Dashboard Powerpoint PPT Template Bundles
If you require a professional template with great design, then this Learning And Development Dashboard Powerpoint PPT Template Bundles is an ideal fit for you. Deploy it to enthrall your audience and increase your presentation threshold with the right graphics, images, and structure. Portray your ideas and vision using fourteen slides included in this complete deck. This template is suitable for expert discussion meetings presenting your views on the topic. With a variety of slides having the same thematic representation, this template can be regarded as a complete package. It employs some of the best design practices, so everything is well-structured. Not only this, it responds to all your needs and requirements by quickly adapting itself to the changes you make. This PPT slideshow is available for immediate download in PNG, JPG, and PDF formats, further enhancing its usability. Grab it by clicking the download button.
-
 Travel Dashboard Powerpoint Ppt Template Bundles
Introduce your topic and host expert discussion sessions with this Travel Dashboard Powerpoint Ppt Template Bundles. This template is designed using high-quality visuals, images, graphics, etc, that can be used to showcase your expertise. Different topics can be tackled using the fourteen slides included in this template. You can present each topic on a different slide to help your audience interpret the information more effectively. Apart from this, this PPT slideshow is available in two screen sizes, standard and widescreen making its delivery more impactful. This will not only help in presenting a birds-eye view of the topic but also keep your audience engaged. Since this PPT slideshow utilizes well-researched content, it induces strategic thinking and helps you convey your message in the best possible manner. The biggest feature of this design is that it comes with a host of editable features like color, font, background, etc. So, grab it now to deliver a unique presentation every time.
-
 Recruitment Dashboard Powerpoint PPT Template Bundles
Introduce your topic and host expert discussion sessions with this Recruitment Dashboard Powerpoint PPT Template Bundles. This template is designed using high-quality visuals, images, graphics, etc, that can be used to showcase your expertise. Different topics can be tackled using the thirteen slides included in this template. You can present each topic on a different slide to help your audience interpret the information more effectively. Apart from this, this PPT slideshow is available in two screen sizes, standard and widescreen making its delivery more impactful. This will not only help in presenting a birds-eye view of the topic but also keep your audience engaged. Since this PPT slideshow utilizes well-researched content, it induces strategic thinking and helps you convey your message in the best possible manner. The biggest feature of this design is that it comes with a host of editable features like color, font, background, etc. So, grab it now to deliver a unique presentation every time.
-
 Recruitment Dashboard Metrics Powerpoint Ppt Template Bundles
If you require a professional template with great design, then this Recruitment Dashboard Metrics Powerpoint Ppt Template Bundles is an ideal fit for you. Deploy it to enthrall your audience and increase your presentation threshold with the right graphics, images, and structure. Portray your ideas and vision using thirteen slides included in this complete deck. This template is suitable for expert discussion meetings presenting your views on the topic. With a variety of slides having the same thematic representation, this template can be regarded as a complete package. It employs some of the best design practices, so everything is well-structured. Not only this, it responds to all your needs and requirements by quickly adapting itself to the changes you make. This PPT slideshow is available for immediate download in PNG, JPG, and PDF formats, further enhancing its usability. Grab it by clicking the download button.
-
 Sales Metrics Dashboard Powerpoint PPT Template Bundles
Deliver a credible and compelling presentation by deploying this Sales Metrics Dashboard Powerpoint PPT Template Bundles. Intensify your message with the right graphics, images, icons, etc. presented in this complete deck. This PPT template is a great starting point to convey your messages and build a good collaboration. The thirteen slides added to this PowerPoint slideshow helps you present a thorough explanation of the topic. You can use it to study and present various kinds of information in the form of stats, figures, data charts, and many more. This Sales Metrics Dashboard Powerpoint PPT Template Bundles PPT slideshow is available for use in standard and widescreen aspects ratios. So, you can use it as per your convenience. Apart from this, it can be downloaded in PNG, JPG, and PDF formats, all completely editable and modifiable. The most profound feature of this PPT design is that it is fully compatible with Google Slides making it suitable for every industry and business domain.
-
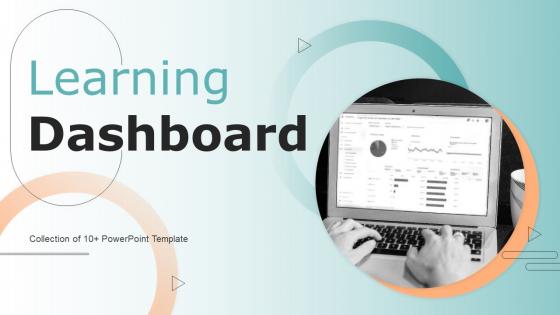 Learning Dashboard Powerpoint Ppt Template Bundles
Deliver a credible and compelling presentation by deploying this Learning Dashboard Powerpoint Ppt Template Bundles. Intensify your message with the right graphics, images, icons, etc. presented in this complete deck. This PPT template is a great starting point to convey your messages and build a good collaboration. The thirteen slides added to this PowerPoint slideshow helps you present a thorough explanation of the topic. You can use it to study and present various kinds of information in the form of stats, figures, data charts, and many more. This Learning Dashboard Powerpoint Ppt Template Bundles PPT slideshow is available for use in standard and widescreen aspects ratios. So, you can use it as per your convenience. Apart from this, it can be downloaded in PNG, JPG, and PDF formats, all completely editable and modifiable. The most profound feature of this PPT design is that it is fully compatible with Google Slides making it suitable for every industry and business domain.
-
 Fraud Dashboard Powerpoint Ppt Template Bundles
Deliver a credible and compelling presentation by deploying this Fraud Dashboard Powerpoint Ppt Template Bundles. Intensify your message with the right graphics, images, icons, etc. presented in this complete deck. This PPT template is a great starting point to convey your messages and build a good collaboration. The thirteen slides added to this PowerPoint slideshow helps you present a thorough explanation of the topic. You can use it to study and present various kinds of information in the form of stats, figures, data charts, and many more. This Fraud Dashboard Powerpoint Ppt Template Bundles PPT slideshow is available for use in standard and widescreen aspects ratios. So, you can use it as per your convenience. Apart from this, it can be downloaded in PNG, JPG, and PDF formats, all completely editable and modifiable. The most profound feature of this PPT design is that it is fully compatible with Google Slides making it suitable for every industry and business domain.
-
 Deposit Dashboard Powerpoint Ppt Template Bundles
Deliver a credible and compelling presentation by deploying this Deposit Dashboard Powerpoint Ppt Template Bundles. Intensify your message with the right graphics, images, icons, etc. presented in this complete deck. This PPT template is a great starting point to convey your messages and build a good collaboration. The thirteen slides added to this PowerPoint slideshow helps you present a thorough explanation of the topic. You can use it to study and present various kinds of information in the form of stats, figures, data charts, and many more. This Deposit Dashboard Powerpoint Ppt Template Bundles PPT slideshow is available for use in standard and widescreen aspects ratios. So, you can use it as per your convenience. Apart from this, it can be downloaded in PNG, JPG, and PDF formats, all completely editable and modifiable. The most profound feature of this PPT design is that it is fully compatible with Google Slides making it suitable for every industry and business domain.
-
 Audit Dashboard Powerpoint Ppt Template Bundles
If you require a professional template with great design, then this Audit Dashboard Powerpoint Ppt Template Bundles is an ideal fit for you. Deploy it to enthrall your audience and increase your presentation threshold with the right graphics, images, and structure. Portray your ideas and vision using nine slides included in this complete deck. This template is suitable for expert discussion meetings presenting your views on the topic. With a variety of slides having the same thematic representation, this template can be regarded as a complete package. It employs some of the best design practices, so everything is well-structured. Not only this, it responds to all your needs and requirements by quickly adapting itself to the changes you make. This PPT slideshow is available for immediate download in PNG, JPG, and PDF formats, further enhancing its usability. Grab it by clicking the download button.
-
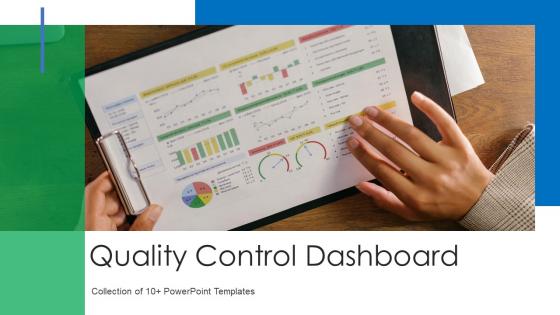 Quality Control Dashboard Powerpoint Ppt Template Bundles
If you require a professional template with great design, then this Quality Control Dashboard Powerpoint Ppt Template Bundles is an ideal fit for you. Deploy it to enthrall your audience and increase your presentation threshold with the right graphics, images, and structure. Portray your ideas and vision using twelve slides included in this complete deck. This template is suitable for expert discussion meetings presenting your views on the topic. With a variety of slides having the same thematic representation, this template can be regarded as a complete package. It employs some of the best design practices, so everything is well-structured. Not only this, it responds to all your needs and requirements by quickly adapting itself to the changes you make. This PPT slideshow is available for immediate download in PNG, JPG, and PDF formats, further enhancing its usability. Grab it by clicking the download button.
-
 Staffing Dashboard Powerpoint PPT Template Bundles
Introduce your topic and host expert discussion sessions with this Staffing Dashboard Powerpoint PPT Template Bundles. This template is designed using high-quality visuals, images, graphics, etc, that can be used to showcase your expertise. Different topics can be tackled using the twelve slides included in this template. You can present each topic on a different slide to help your audience interpret the information more effectively. Apart from this, this PPT slideshow is available in two screen sizes, standard and widescreen making its delivery more impactful. This will not only help in presenting a birds-eye view of the topic but also keep your audience engaged. Since this PPT slideshow utilizes well-researched content, it induces strategic thinking and helps you convey your message in the best possible manner. The biggest feature of this design is that it comes with a host of editable features like color, font, background, etc. So, grab it now to deliver a unique presentation every time.
-
 Risk Assessment Dashboard Powerpoint PPT Template Bundles
If you require a professional template with great design, then this Risk Assessment Dashboard Powerpoint PPT Template Bundles is an ideal fit for you. Deploy it to enthrall your audience and increase your presentation threshold with the right graphics, images, and structure. Portray your ideas and vision using twelve slides included in this complete deck. This template is suitable for expert discussion meetings presenting your views on the topic. With a variety of slides having the same thematic representation, this template can be regarded as a complete package. It employs some of the best design practices, so everything is well-structured. Not only this, it responds to all your needs and requirements by quickly adapting itself to the changes you make. This PPT slideshow is available for immediate download in PNG, JPG, and PDF formats, further enhancing its usability. Grab it by clicking the download button.


