


Hospitality Management KPI And Dashboard Powerpoint Presentation Slides






Try Before you Buy Download Free Sample Product
 Impress Your
 Audience
 100%
100% Editable
 Save Hours
 of Time


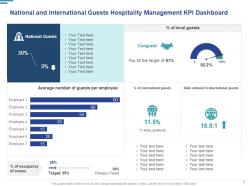
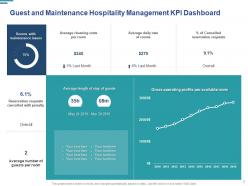
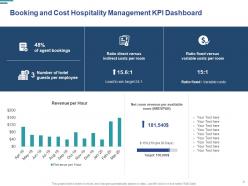
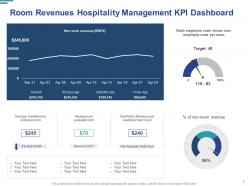
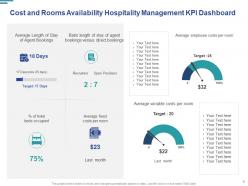
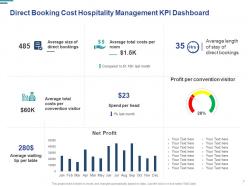
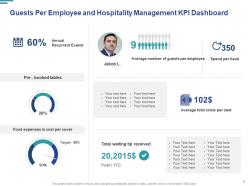
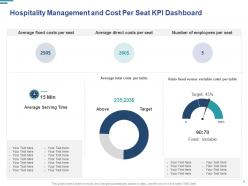
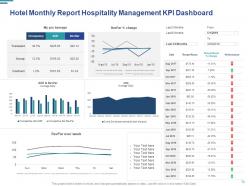
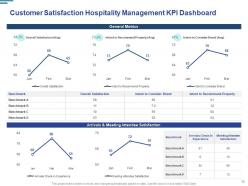
Tracking KPIs in the hospitality industry is really a very challenging task. Our Hospitality Management KPI And Dashboard PowerPoint Presentation Slides can make it much easier. Compare numbers of national and international guests by using this professionally designed hotel industry metrics PPT slideshow. The key performance indicators of the hospitality sector PowerPoint complete deck includes twenty-five content ready PPT slides that allow users to analyze various factors of crucial revenue and performance data. Take advantage of the visually appealing hotel KPIs PPT slides to discuss the guest and maintenance metrics such as average cleaning cost per room, the average number of guests per room and so on. Our well-researched business presentation brings all the KPIs of the hospitality sector at one place where you can measure how your firm is performing. Thus download our informative and eye-catching hospitality sector dashboard PowerPoint presentation templates now and ensure the long-term success of your hotel business. Acknowledge your heritage with our Hospitality Management KPI And Dashboard Powerpoint Presentation Slides. Express appreciation of the gifts of those gone by.
People who downloaded this PowerPoint presentation also viewed the following :
Hospitality Management KPI And Dashboard Powerpoint Presentation Slides with all 25 slides:
Use our Hospitality Management KPI And Dashboard Powerpoint Presentation Slides to effectively help you save your valuable time. They are readymade to fit into any presentation structure.



FAQs for Hospitality Management KPI And Dashboard
So for hospitality KPIs, definitely start with RevPAR, occupancy rates, and ADR - those three are like the holy trinity. Guest satisfaction scores are obviously crucial too. Customer acquisition cost and lifetime value will tell you if you're actually making money or just spinning your wheels. Staff turnover is worth tracking since people in this industry jump ship constantly (learned that the hard way). If you've got restaurants, watch your food cost percentages like a hawk. Oh, and operational stuff like check-in times and how fast housekeeping turns rooms. Start there, then get more specific based on your setup.
Dude, those satisfaction scores are literally everything for your hospitality biz. High scores = more repeat customers, better reviews, and way more referrals coming your way. But when they tank? You're screwed because angry guests blast you everywhere online. I learned this the hard way - unhappy people are like 10x louder than satisfied ones. Plus you'll burn through cash trying to find new customers instead of keeping the ones you have. Honestly, even bumping your scores up just a little bit makes a huge difference profit-wise. Track them obsessively and fix problems fast.
So RevPAR is occupancy rate times your average room price - it's like the best way to see if you're actually making money or just fooling yourself. High occupancy but cheap rates? RevPAR will call you out. Expensive rooms sitting empty? Same thing. I swear it's the one number that doesn't lie about how your hotel's doing. Most managers check it every day because honestly, you can't really know if your pricing strategy works without it. Way better than just looking at occupancy alone - learned that the hard way.
Turnover rate is honestly one of the best ways to see how your hospitality business is really doing. Just divide departures by your average headcount - most people check monthly and yearly. The thing is, when you're constantly training new people, your service gets inconsistent fast. Nobody knows your standards yet, and training costs pile up like crazy. Industry average is around 75% annually, which is pretty insane compared to other jobs. Oh, and definitely break it down by department. If front desk keeps losing people but housekeeping doesn't, you'll know exactly where to focus your efforts.
ADR tracks your average revenue per room sold - super useful for seeing if your pricing actually works. Just divide room revenue by rooms sold. When ADR drops but occupancy stays the same? You're probably pricing too low or competitors are undercutting you. I always tell people to watch it with occupancy and RevPAR together since ADR alone doesn't tell the whole story. Oh, and definitely compare your numbers to competitors monthly - that's where you'll really see how you stack up. It's honestly one of the most telling metrics for revenue decisions.
So here's the thing - loyal customers are literally your business lifeline. They keep coming back instead of jumping ship to competitors, which means steady money in your pocket. Tracking stuff like repeat visits and how much each customer spends over time? That's how you predict your future revenue. Plus, getting new customers costs a fortune compared to keeping the ones you already have happy. Your regulars basically become free advertising too - they tell their friends about you. Honestly, once you nail down guest loyalty, everything else gets easier. Better profits, more predictable income streams.
Honestly, start with RevPAR and direct bookings - those two will show you right away if your marketing's actually working. Track your average daily rate too since higher rates mean better profit margins. Direct booking percentage is clutch because it means you're not bleeding money to OTA fees. Customer acquisition cost vs lifetime value keeps you from overspending (learned that one the hard way). Occupancy during campaign periods and website conversion rates are pretty basic but super telling. Brand awareness surveys are nice if you've got extra budget, though most smaller properties skip those. Focus on RevPAR first though - it's like the ultimate "am I making money" metric.
Dude, your food costs are probably eating up like 28-35% of your revenue - that's insane when you think about it. I'd track both food AND beverage costs weekly, not monthly. You'll catch stuff like over-portioning (seen places lose thousands from that alone), theft, random waste. Plus you can spot when prices spike seasonally and bump your menu accordingly. Honestly, most owners wait too long to check this stuff. Calculate your cost percentage this week and see how it stacks against other restaurants in your category. Short sentences help you stay on top of margins better.
Reviews are honestly such a game-changer for tracking how guests actually feel. Track your average ratings, how fast you respond to complaints, and watch for patterns in what people complain about. I actually look at these more than our internal surveys sometimes - way more honest feedback. Set up alerts for anything under 3 stars so you can jump on problems fast. The response rate to negative reviews matters too, shows you care. Month-over-month review volume tells you if word-of-mouth is working. It's basically free market research that actually reflects real experiences.
Honestly, occupancy rates are pretty clutch because they show you right away if you're actually filling rooms. I track mine weekly and compare to last year - that's where you catch the real patterns. Like if your summer bookings are dropping off earlier than usual, you'll see it immediately. The thing is, high occupancy doesn't always mean you're winning. Could just mean your rates are too low. That's why I always look at it alongside your daily rate average. Makes it way easier to tell if that new marketing push is actually working or if you're just giving rooms away. Staff gets it too since it's not complicated math.
Dude, just automate that stuff! Property management systems will track occupancy and RevPAR without you lifting a finger. I'm obsessed with checking mobile dashboards - probably unhealthy tbh. Business intelligence tools catch crazy patterns too, like how rain affects cancellations (who knew?). The magic happens when everything connects - reservations talking to housekeeping talking to finance. No more manual data entry hell. Start simple with one dashboard. You'll wonder why you waited so long to ditch those monthly reports that were already outdated by the time you got them.
Okay so the big three you gotta watch are RevPAR, ADR, and occupancy rate - they'll tell you if your pricing's on point and rooms are actually filling up. GOP matters too since that's your real profit after expenses. Labor costs and F&B margins are worth tracking if you've got restaurants (though honestly F&B can be a headache). RevPAR's probably the best overall metric though. It combines your pricing and demand into one number. Compare yourself to competitors first, then track monthly trends. Catching problems early beats scrambling when your numbers tank.
Oh totally - there's a huge connection there! Happy employees bump guest satisfaction by like 20-30%, which is pretty wild when you think about it. Your staff naturally gives better service when they feel good about their job. They're more helpful, solve problems better, all that stuff. Hotels with high employee scores almost always see guest ratings go up too. Honestly, whenever guest complaints start spiking, I'd check your employee surveys first - that's usually where the problem starts. It's basically that whole "can't pour from an empty cup" thing but with actual numbers to prove it.
Look, benchmarking competitor KPIs is basically your sanity check for goal-setting. Track their RevPAR, occupancy rates, guest satisfaction - see if you're crushing it or totally off base. Kind of like peeking at everyone else's test scores, which honestly we've all done. Pick 3-5 competitors and check monthly. Their performance gives you realistic target ranges and shows what's actually working in your market. Sometimes you'll discover you're doing better than you thought! Use that data to figure out where to focus your energy and which tactics are worth stealing.
Honestly, KPIs are game-changers for catching issues before guests even mention them. Track stuff like how fast your front desk handles problems or cleanliness scores - you'll see exactly what's broken. I love getting specific with the data though, like timing how long housekeeping takes per room. Way better than just telling your team to "improve" without knowing what that means. Pick maybe 4-5 things that actually matter to guests. Then do quick weekly check-ins with staff to tweak whatever isn't working. Response times are usually a good starting point.
-
Illustrative design with editable content. Exceptional value for money. Highly pleased with the product.
-
Awesome presentation, really professional and easy to edit.
-
Very unique, user-friendly presentation interface.
-
Helpful product design for delivering presentation.