


Project portfolio management kpi and dashboard powerpoint presentation slides





Try Before you Buy Download Free Sample Product
 Impress Your
 Audience
 100%
100% Editable
 Save Hours
 of Time


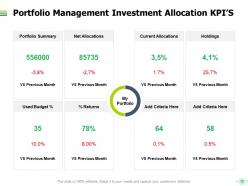
Manage your assets in a professional way using our content ready Portfolio Management KPI And Dashboard PowerPoint Presentation Slides. Take advantage of these asset management PPT templates to illustrate portfolio performance, portfolio risk dashboard, portfolio timeline summary, cost-benefit analysis, etc. Take the assistance of these investment management PowerPoint infographics to depict the on-boarded projects, completed projects, pipeline projects, development projects, etc. Employ this amazing asset PPT layout to showcase the allocation of KPI’s like portfolio summary, net allocations, holdings, used budgets and returns in percentage form. Utilize these amazing asset PowerPoint visuals to reveal the projects of different departments including finance, IT, legal, operations, programs, sales, and marketing. Moreover, you can also show various risks that impact portfolio like IT long haul, product engineering, facilities upgrade, human capital initiatives, etc. Download this amazing asset management PPT slideshow to keep a timely track of various organizational projects.
People who downloaded this PowerPoint presentation also viewed the following :
Content of this Powerpoint Presentation
Slide 1: This slide introduces Project Portfolio Management KPI & Dashboard. State Your Company Name and begin.
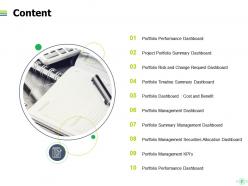
Slide 2: This slide shows Content of the presentation.
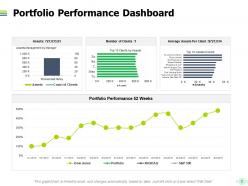
Slide 3: This slide presents Portfolio Performance Dashboard with the help of graphs.
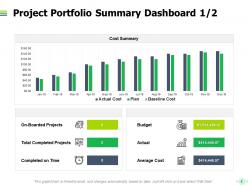
Slide 4: This slide displays Project Portfolio Summary Dashboard.
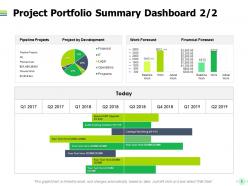
Slide 5: This is another slide showing Project Portfolio Summary Dashboard.
Slide 6: This slide represents Portfolio Risk and Change Request Dashboard.
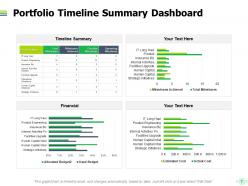
Slide 7: This slide showcases Timeline Summary. You can add or edit data as per requirements.
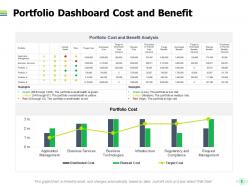
Slide 8: This slide shows Portfolio Dashboard with Cost and Benefit.
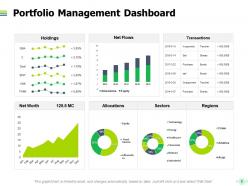
Slide 9: This slide presents Portfolio Management Dashboard describing- Net Worth, Allocations, Sectors, Regions, Holdings, Net Flows.
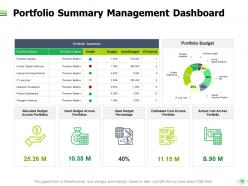
Slide 10: This slide displays Portfolio Summary Management Dashboard.
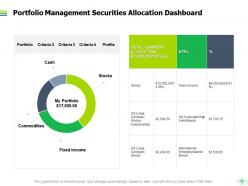
Slide 11: This slide represents Portfolio Management Securities Allocation Dashboard.
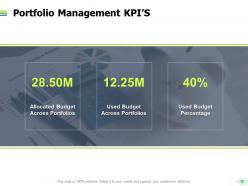
Slide 12: This slide showcases Portfolio Management KPI’S with related imagery.
Slide 13: This slide shows Portfolio Management Investment Allocation KPI’S.
Slide 14: This slide displays Project Portfolio Management KPI & Dashboard Icons.
Slide 15: This slide reminds about 15 minutes coffee break.
Slide 16: This slide is titled as Additional Slides for moving forward.
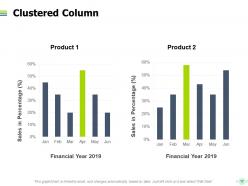
Slide 17: This slide shows Clustered Column chart with two products comparison.
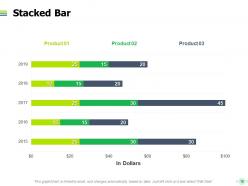
Slide 18: This slide presents Stacked Bar chart with three products comparison.
Slide 19: This is a Timeline slide to show information related with time period.
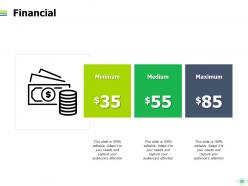
Slide 20: This is a Financial slide. Show your finance related stuff here.
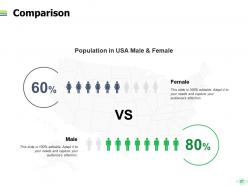
Slide 21: This is a Comparison slide to state comparison between commodities, entities etc.
Slide 22: This slide is titled as Post it Notes. Post your important notes here.
Slide 23: This is a Puzzle slide with text boxes to show information.
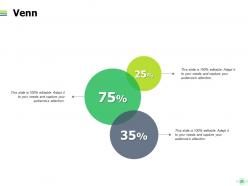
Slide 24: This is a Venn slide with additional text boxes.
Slide 25: This slide shows Mind Map for representing entities.
Slide 26: This is a Thank You slide with address, contact numbers and email address.
Project portfolio management kpi and dashboard powerpoint presentation slides with all 26 slides:
Use our Project Portfolio Management Kpi And Dashboard Powerpoint Presentation Slides to effectively help you save your valuable time. They are readymade to fit into any presentation structure.



FAQs for Project portfolio management kpi and dashboard
Portfolio ROI and strategic alignment percentage are your bread and butter. Resource utilization rates matter too, obviously. I'd throw in project success rates and time-to-market - though honestly, half the companies I know obsess over time-to-market then ignore everything else. Portfolio health score gives you that quick gut check you need. Budget variance is clutch for staying sane. Don't go crazy with like 20 different metrics though. Pick maybe 5-7 that you'll actually use to make real decisions. Way too many teams build these massive dashboards that just sit there collecting digital dust.
Start by connecting each KPI to one of your actual strategic goals - so if innovation's your focus, track stuff like product development speed or R&D returns. The real challenge? Making sure you're measuring things that actually matter, not just what's convenient to count. I've watched teams get obsessed with impressive-looking numbers that don't move anything forward. Review these regularly since your strategy will shift over time (and honestly, it should). Why don't you audit what you're currently tracking against your strategic plan? Do it this week while it's fresh.
Start with utilization rates - they're super easy to track and show you who's swamped vs. sitting around. Resource allocation efficiency tells you if you've got the right people on projects (spoiler: you probably don't half the time). Watch for double-booking conflicts because that's just chaos waiting to happen. Bench time matters too - nobody wants expensive talent twiddling their thumbs between gigs. Oh, and skills gap stuff helps you figure out where to hire next. Honestly though, nail the utilization tracking first since it'll solve your biggest headaches right away.
Start with a risk-return matrix - plot your expected ROI against how likely each project is to tank or blow the budget. Here's the thing though: the highest return isn't always your best bet. I've definitely learned that lesson before! What you want is solid returns without making your whole portfolio a gambling mess. Monte Carlo simulations help if you've got the bandwidth for that. Mix up your project types, timelines, and risk levels. Maybe 70-80% safer bets that'll actually deliver, then throw the rest at those crazy moonshot ideas that could totally change everything.
Honestly, stakeholder satisfaction is huge - probably your most important PPM metric. If sponsors and users aren't happy, nothing else matters. You could nail every deadline and budget, but unhappy stakeholders mean your portfolio's failing. Set up regular feedback loops with key people through surveys or review sessions. Quarterly works well for most places. Track scores across different groups and connect them to specific projects. Oh, and don't forget to actually identify who your key stakeholders are first - sounds obvious but you'd be surprised how many skip that step. The feedback rhythm thing is what really makes the difference.
Track the gap between when you planned to launch vs when you actually did. I measure it in days or weeks, plus the percentage variance - so if you planned 12 months but took 15, that's a 25% overrun. Monthly tracking works best because honestly, delays snowball fast if you're not watching. Compare similar project types so you can spot where things always go sideways. The real trick is building up historical data now - then you'll have something solid to benchmark against later. Makes it way easier to see if you're actually improving or just telling yourself you are.
Honestly, start with ROI and budget variance - those two will tell you the most right off the bat. Then you'll want NPV and portfolio value-at-risk for the bigger picture stuff. Budget variance and cost performance index are clutch for seeing if projects are actually staying on track financially. Oh, and payback period plus internal rate of return really show how your investments are actually performing over time. Earned value metrics are super useful too, though they can get a bit wonky to calculate at first. Once you get the hang of tracking these, you'll have a solid grip on your portfolio's financial health.
Yeah, scope changes are brutal for KPI tracking because they mess with your baseline. Your timeline and budget suddenly look awful even when you're doing fine with the new requirements. It's basically like moving the goalposts mid-game - super annoying. When scope shrinks, the opposite happens and your metrics look weirdly good for no real reason. I'd recalibrate your KPIs after big scope shifts. Oh, and track scope creep itself as a KPI. You'll start seeing patterns across projects that way.
Honestly, I'd go with Microsoft Project Online or Smartsheet - both have solid real-time dashboards. PowerBI makes your charts look super professional in meetings, which stakeholders eat up. Monday.com works too if you want something simpler, just set up custom fields for your metrics. The main thing? Pick whatever actually talks to your existing tools. I made the mistake once of choosing something that looked cool but didn't integrate with anything - ended up manually entering data for months. Total nightmare. Start with what fits your current setup and you'll save yourself a ton of headaches.
Honestly, you've got to review them way more than most people think - quarterly bare minimum, monthly if your industry's crazy volatile. Set up alerts for when stuff starts trending weird. Most companies get way too attached to old metrics that used to work great but don't anymore, which is such a mistake. I'd throw in 2-3 experimental KPIs alongside your main ones so you're not scrambling when things shift. Create some easy way for people to speak up when metrics feel off. It's kinda like car maintenance - skip it and everything falls apart fast.
Automate data collection as much as you can - that's where most screw-ups happen with manual entry. Get your project management tools talking directly to your KPI dashboards so everything flows without human touch. Define what each metric actually means upfront because teams interpret "project completion" wildly differently (learned that the hard way). For stuff you can't automate, create standard templates. Maybe do double-checks on the really important numbers. Oh, and run validation checks regularly. Your whole portfolio strategy depends on getting this right, so make it bulletproof.
Look, you need both types honestly. Quantitative stuff gives you the hard data - ROI, budget variance, timelines. But qualitative KPIs? That's where you capture the fuzzy but critical stuff like stakeholder satisfaction and whether your strategy actually makes sense. I've watched portfolios that crushed their numbers but were complete strategic train wrecks - people hated the products, teams were miserable. Numbers tell you if you're performing financially. The qualitative side shows if you're building something people actually want and keeping your team from burning out. Can't really get the full picture without tracking both.
Honestly, the worst thing you can do is track everything - I've watched teams drown in like 15 different metrics when they should focus on maybe 5 good ones. You end up measuring busy work instead of actual results. Like counting "projects finished" rather than whether those projects actually moved the needle. Another trap? Picking KPIs your team can't control anyway. What's the point of that? Start small - grab 3-5 metrics that your boss actually cares about, run them for a few months, then adjust. Don't overcomplicate the math either or you'll hate updating them.
Track four main things to see how your project's really doing: schedule (hitting deadlines?), budget (overspending yet?), quality stuff like how many bugs you're getting, and whether people are actually happy with the work. Honestly, I've seen way too many projects that looked perfect on spreadsheets but the team was totally burnt out. Weight these differently based on what matters most - research projects can be slow if they're solid, but marketing campaigns? You've gotta hit those dates. Just make a simple dashboard so you'll catch problems before they blow up.
Honestly, just ask each group what they actually want to see first - saves you so much time. Executives love those simple red/yellow/green dashboards, but project managers need the nitty-gritty details they can dig into. Charts and graphs are your friend here because let's be real, nobody's reading those massive spreadsheet dumps you send out. Keep your review meetings short and regular instead of doing those marathon presentations that make everyone's eyes glaze over. Oh, and always explain what the numbers actually mean for the business - context is everything. Stick to the same format each time so people know what to expect.
-
Great product with highly impressive and engaging designs.
-
Easy to edit slides with easy to understand instructions.
-
Informative presentations that are easily editable.
-
Colors used are bright and distinctive.