Inventory Management KPI Dashboard, Excel PowerPoint Templates
-
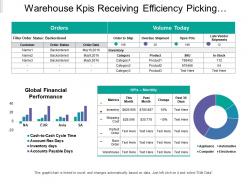 Warehouse kpis receiving efficiency picking accuracy backorder rate inventory
Presenting this set of slides with name - Warehouse Kpis Receiving Efficiency Picking Accuracy Backorder Rate Inventory. This is a four stage process. The stages in this process are Warehouse Kpi, Warehouse Dashboard, Warehouse Metrics.
-
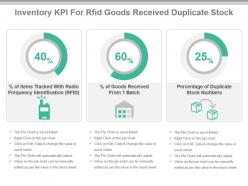 Inventory kpi for rfid goods received duplicate stock ppt slide
Presenting inventory kpi for rfid goods received duplicate stock ppt slide. This presentation slide shows Three Key Performance Indicators or KPIs in a Dashboard style design. The first KPI that can be shown is Percentage of Items Tracked With Radio Frequency Identification or RFID. The second KPI is Percentage of Goods Received From 1 Batch. The third is Percentage of Duplicate Stock Numbers. These KPI Powerpoint graphics are all data driven, and the shape automatically adjusts according to your data. Just right click on the KPI graphic, enter the right value and the shape will adjust automatically. Make a visual impact with our KPI slides.
-
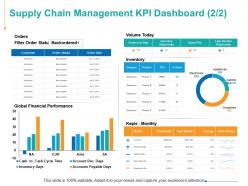 Supply chain management kpi dashboard finance ppt powerpoint presentation files
Presenting this set of slides with name - Supply Chain Management KPI Dashboard Finance Ppt Powerpoint Presentation Files. This is a four stage process. The stages in this process are Customer, Inventory, Marketing, Strategy, Planning.
-
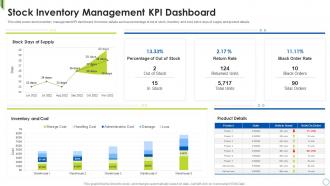 Stock Inventory Management Kpi Dashboard
This slide covers stock inventory management KPI dashboard. It involves details such as percentage of out of stock, inventory and cost, stock days of supply and product details. Introducing our Stock Inventory Management Kpi Dashboard set of slides. The topics discussed in these slides are Inventory And Cost, Product Details, Stock. This is an immediately available PowerPoint presentation that can be conveniently customized. Download it and convince your audience.
-
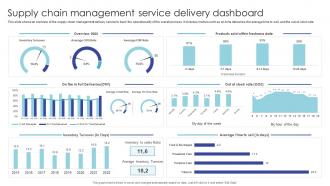 Supply Chain Management Service Delivery Dashboard
This slide shows an overview of the supply chain management delivery service to track the operationality of the overall process. It includes metrics such as on time deliveries, the average time to sell, and the out of stock rate. Presenting our well structured Supply Chain Management Service Delivery Dashboard. The topics discussed in this slide are Inventory Turnover, Products Sold, Freshness Date. This is an instantly available PowerPoint presentation that can be edited conveniently. Download it right away and captivate your audience.
-
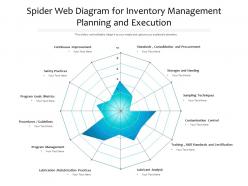 Spider web diagram for inventory management planning and execution
Presenting our well-structured Spider Web Diagram For Inventory Management Planning And Execution. The topics discussed in this slide are Continuous Improvement ,Safety Practices,Program Goals Metrics,Procedures Guidelines,Program Management,Lubrication Relubrication Practices. This is an instantly available PowerPoint presentation that can be edited conveniently. Download it right away and captivate your audience.
-
 Inventory Kpis Powerpoint Ppt Template Bundles
If you require a professional template with great design, then this Inventory Kpis Powerpoint Ppt Template Bundles is an ideal fit for you. Deploy it to enthrall your audience and increase your presentation threshold with the right graphics, images, and structure. Portray your ideas and vision using tweleve slides included in this complete deck. This template is suitable for expert discussion meetings presenting your views on the topic. With a variety of slides having the same thematic representation, this template can be regarded as a complete package. It employs some of the best design practices, so everything is well-structured. Not only this, it responds to all your needs and requirements by quickly adapting itself to the changes you make. This PPT slideshow is available for immediate download in PNG, JPG, and PDF formats, further enhancing its usability. Grab it by clicking the download button.
-
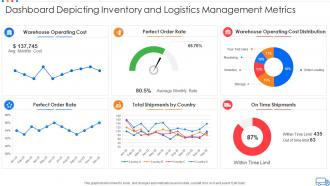 Dashboard depicting inventory and logistics management metrics
Introducing our Dashboard Depicting Inventory And Logistics Management Metrics set of slides. The topics discussed in these slides are Dashboard Depicting Inventory And Logistics Management Metrics. This is an immediately available PowerPoint presentation that can be conveniently customized. Download it and convince your audience.
-
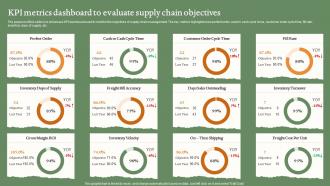 KPI Metrics Dashboard To Evaluate Supply Chain Objectives
The purpose of this slide is to showcase KPI dashboard used to monitor the objectives of supply chain management. The key metrics highlighted are perfect order, cash to cash cycle tome, customer order cycle time, fill rate, inventory days of supply, etc. Introducing our KPI Metrics Dashboard To Evaluate Supply Chain Objectives set of slides. The topics discussed in these slides are KPI Metrics Dashboard, Evaluate, Supply Chain Objectives. This is an immediately available PowerPoint presentation that can be conveniently customized. Download it and convince your audience.
-
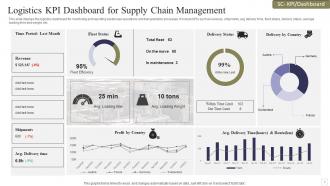 Logistics KPI Dashboard Snapshot For Supply Chain Management
This slide displays the logistics dashboard for monitoring and reporting warehouse operations and transportation processes. It include KPIs such as revenue, shipments, avg delivery time, fleet status, delivery status, average loading time and weight, etc. Presenting our well structured Logistics KPI Dashboard Snapshot For Supply Chain Management. The topics discussed in this slide are Logistics KPI Dashboard, Supply Chain Management, Revenue. This is an instantly available PowerPoint presentation that can be edited conveniently. Download it right away and captivate your audience.
-
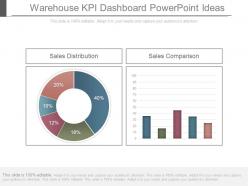 Warehouse kpi dashboard powerpoint ideas
Presenting warehouse kpi dashboard powerpoint ideas. This is a warehouse kpi dashboard powerpoint ideas. This is a two stage process. The stages in this process are sales distribution, sales comparison.
-
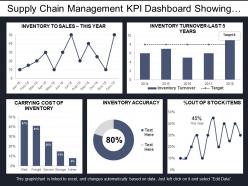 Supply chain management kpi dashboard showing inventory accuracy and turnover
Presenting this set of slides with name - Supply Chain Management Kpi Dashboard Showing Inventory Accuracy And Turnover. This is a five stage process. The stages in this process are Demand Forecasting, Predicting Future Demand, Supply Chain Management.
-
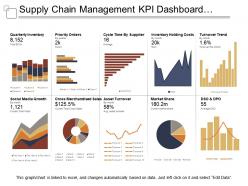 Supply chain management kpi dashboard showing quarterly inventory and asset turnover
Presenting this set of slides with name - Supply Chain Management Kpi Dashboard Showing Quarterly Inventory And Asset Turnover. This is a ten stage process. The stages in this process are Demand Forecasting, Predicting Future Demand, Supply Chain Management.
-
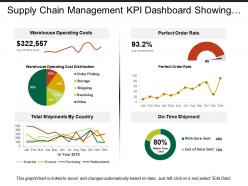 Supply chain management kpi dashboard showing warehouse operating costs
Presenting predesigned Supply Chain Management KPI Dashboard Showing Warehouse Operating Costs PPT slide. Download of the template design is simple. You can modify the layout font type, font size, colors and the background as per needs. Template slide is fully flexible with Google Slides and other online software’s. You can alter the design using the instructional slides provided with the template. You can remove the watermark with your brand name, trademark, signature or logo. You can save the template into PNG or JPEG formats. Supreme quality layouts are used to create this template which is editable in PowerPoint. Sample content can be replaced with your presentation content.
-
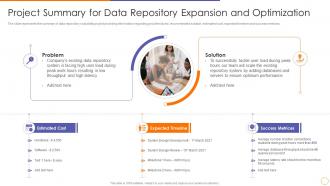 Scale out strategy for data inventory system project summary for data repository expansion and optimization
The slide represents the summary of data repository scalability project providing information regarding problem faced, recommended solution, estimated cost, expected timeline and success metrices. Introducing Scale Out Strategy For Data Inventory System Project Summary For Data Repository Expansion And Optimization to increase your presentation threshold. Encompassed with three stages, this template is a great option to educate and entice your audience. Dispence information on Expansion, Optimization, Performance, using this template. Grab it now to reap its full benefits.
-
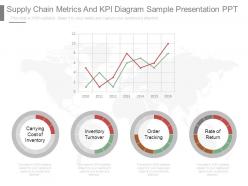 Supply chain metrics and kpi diagram sample presentation ppt
Presenting supply chain metrics and kpi diagram sample presentation ppt. This is a supply chain metrics and kpi diagram sample presentation ppt. This is a four stage process. The stages in this process are carrying cost of inventory, inventory turnover, order tracking, rate of return.
-
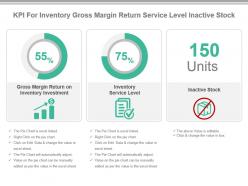 Kpi for inventory gross margin return service level inactive stock presentation slide
Presenting kpi for inventory gross margin return service level inactive stock presentation slide. This presentation slide shows Three Key Performance Indicators or KPIs in a Dashboard style design. The first KPI that can be shown is Gross Margin Return on Inventory Investment. The second KPI is Inventory Service Level. The third is Inactive Stock. These KPI Powerpoint graphics are all data driven, and the shape automatically adjusts according to your data. Just right click on the KPI graphic, enter the right value and the shape will adjust automatically. Make a visual impact with our KPI slides.
-
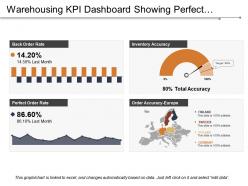 Warehousing kpi dashboard showing perfect order rate and inventory accuracy
PPT design can instantly be downloaded as JPEG and PDF formats. Design template is easily editable, the best advantage of this business oriented PPT design is the use of excel linked charts, where charts in PPT design will automatically get changed when you update storage related figures on linked excel sheet. The PPT design is fully compatible with Google Slides and MS PowerPoint software. Design can be viewed both in standard and full screen view.
-
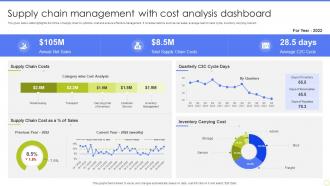 Supply Chain Management With Cost Analysis Dashboard
The given below slide highlights the KPAs of supply chain to optimize cost and ensure effective management. It includes metrics such as net sales, average cash to cash cycle, inventory carrying cost etc. Introducing our Supply Chain Management With Cost Analysis Dashboard set of slides. The topics discussed in these slides are Supply Chain Costs, Inventory Carrying Cost, Average C2C Cycle. This is an immediately available PowerPoint presentation that can be conveniently customized. Download it and convince your audience.
-
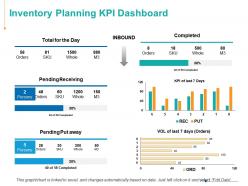 Inventory planning kpi dashboard ppt powerpoint presentation icon
Presenting this set of slides with name - Inventory Planning KPI Dashboard Ppt Powerpoint Presentation Icon. This is a two stage process. The stages in this process are Finance, Analysis, Business, Investment, Marketing.
-
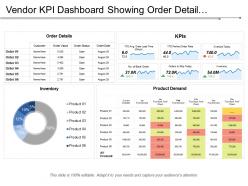 Vendor kpi dashboard showing order detail inventory and orders to ship today
Presenting this set of slides with name - Vendor Kpi Dashboard Showing Order Detail Inventory And Orders To Ship Today. This is a four stage process. The stages in this process are Vendor, Supplier, Retailer.
-
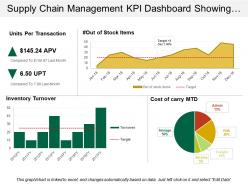 Supply chain management kpi dashboard showing units per transaction
Presenting predesigned Supply Chain Management KPI Dashboard Showing Warehouse Operating Costs PPT slide. Download of the template design is simple. You can modify the layout font type, font size, colors and the background as per needs. Template slide is fully flexible with Google Slides and other online software’s. You can alter the design using the instructional slides provided with the template. You can remove the watermark with your brand name, trademark, signature or logo. You can save the template into PNG or JPEG formats. Supreme quality layouts are used to create this template which is editable in PowerPoint. Sample content can be replaced with your presentation content.
-
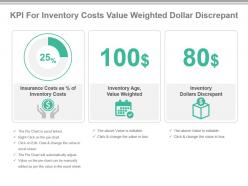 Kpi for inventory costs value weighted dollar discrepant ppt slide
Presenting kpi for inventory costs value weighted dollar discrepant ppt slide. This presentation slide shows Three Key Performance Indicators or KPIs in a Dashboard style design. The first KPI that can be shown is Insurance Costs as Percentage of Inventory Costs. The second KPI is Inventory Age, Value Weighted. The third is Inventory Dollars Discrepant. These KPI Powerpoint graphics are all data driven, and the shape automatically adjusts according to your data. Just right click on the KPI graphic, enter the right value and the shape will adjust automatically. Make a visual impact with our KPI slides.
-
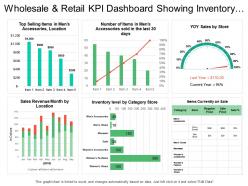 Wholesale and retail kpi dashboard showing inventory level by category sales revenue month
Presenting the retail business slide for PowerPoint. This presentation template is 100% modifiable in PowerPoint and is designed by professionals. You can edit the objects in the slide like font size and font color very easily. This presentation slide is fully compatible with Google Slide and can be saved in JPG or PDF file format without any fuss. Click on the download button to download this template in no time.
-
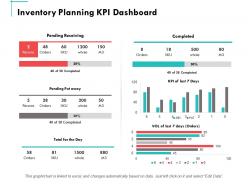 Inventory planning kpi dashboard ppt powerpoint presentation summary graphics
Presenting this set of slides with name - Inventory Planning Kpi Dashboard Ppt Powerpoint Presentation Summary Graphics. This is a four stages process. The stages in this process are Finance, Marketing, Management, Investment, Analysis.
-
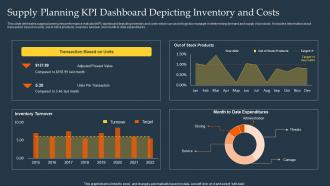 Supply Planning KPI Dashboard Depicting Inventory And Costs
This slide delineates supply planning key performance indicator KPI dashboard depicting inventory and costs which can assist logistics manager in determining demand and supply of products. It includes information about transaction based on units, out of stock products, inventory turnover and month to date expenditures. Presenting our well-structured Supply Planning KPI Dashboard Depicting Inventory And Costs. The topics discussed in this slide are Supply Planning, KPI Dashboard, Depicting Inventory, Costs. This is an instantly available PowerPoint presentation that can be edited conveniently. Download it right away and captivate your audience.
-
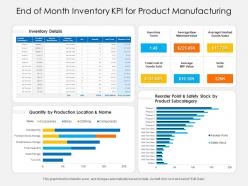 End of month inventory kpi for product manufacturing
Presenting this set of slides with name End Of Month Inventory KPI For Product Manufacturing. The topics discussed in these slides are Inventory, Value, Cost. This is a completely editable PowerPoint presentation and is available for immediate download. Download now and impress your audience.
-
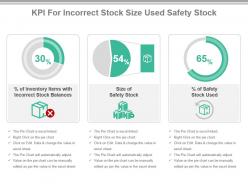 Kpi for incorrect stock size used safety stock presentation slide
Presenting kpi for incorrect stock size used safety stock presentation slide. This presentation slide shows Three Key Performance Indicators or KPIs in a Dashboard style design. The first KPI that can be shown is Percentage of Inventory Items with Incorrect Stock Balances. The second KPI is Size of Safety Stock. The third is Percentage of Safety Stock Used.These KPI Powerpoint graphics are all data driven, and the shape automatically adjusts according to your data. Just right click on the KPI graphic, enter the right value and the shape will adjust automatically. Make a visual impact with our KPI slides.
-
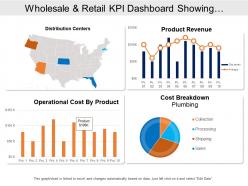 Wholesale and retail kpi dashboard showing distribution centers product revenue
Presenting this set of slides with name - Wholesale And Retail Kpi Dashboard Showing Distribution Centers Product Revenue. This is a four stage process. The stages in this process are Wholesale And Retail, Extensive And Retail, Wholesale And Distribute.
-
 Inventory kpis dashboard snapshot icon with metrics
Presenting our set of slides with Inventory KPIS Dashboard Snapshot Icon With Metrics. This exhibits information on four stages of the process. This is an easy to edit and innovatively designed PowerPoint template. So download immediately and highlight information on Inventory KPIS Dashboard Icon With Metrics.
-
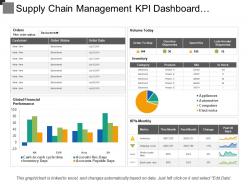 Supply chain management kpi dashboard showing order status volume and inventory
Presenting this set of slides with name - Supply Chain Management Kpi Dashboard Showing Order Status Volume And Inventory. This is a two stage process. The stages in this process are Demand Forecasting, Predicting Future Demand, Supply Chain Management.
-
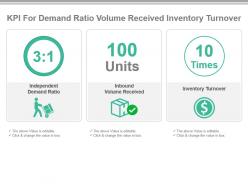 Kpi for demand ratio volume received inventory turnover powerpoint slide
Presenting kpi for demand ratio volume received inventory turnover powerpoint slide. This presentation slide shows Three Key Performance Indicators or KPIs in a Dashboard style design. The first KPI that can be shown is Independent Demand Ratio. The second KPI is Inbound Volume Received. The third is Inventory Turnover. These KPI Powerpoint graphics are all data driven, and the shape automatically adjusts according to your data. Just right click on the KPI graphic, enter the right value and the shape will adjust automatically. Make a visual impact with our KPI slides.
-
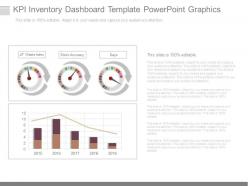 Kpi inventory dashboard template powerpoint graphics
Presenting kpi inventory dashboard template powerpoint graphics. This is a kpi inventory dashboard template powerpoint graphics. This is a three stage process. The stages in this process are jit waste index, stock accuracy, days.
-
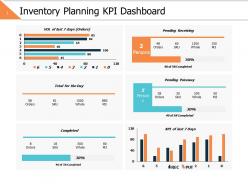 Inventory planning kpi dashboard ppt powerpoint presentation file clipart images
Presenting this set of slides with name - Inventory Planning Kpi Dashboard Ppt Powerpoint Presentation File Clipart Images. This is a six stage process. The stages in this process are Business, Management, Strategy, Analysis, Finance.
-
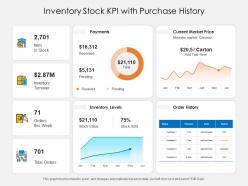 Inventory stock kpi with purchase history
Presenting this set of slides with name Inventory Stock KPI With Purchase History. The topics discussed in these slides are Inventory, Value, Market. This is a completely editable PowerPoint presentation and is available for immediate download. Download now and impress your audience.
-
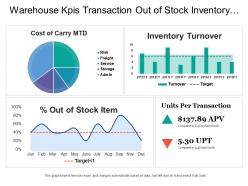 Warehouse kpis transaction out of stock inventory return carry cost
Presenting this set of slides with name - Warehouse Kpis Transaction Out Of Stock Inventory Return Carry Cost. This is a four stage process. The stages in this process are Warehouse Kpi, Warehouse Dashboard, Warehouse Metrics.
-
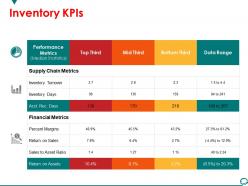 Inventory kpis powerpoint slide design templates
Presenting inventory kpis powerpoint slide design templates. This is a inventory kpis powerpoint slide design templates. This is a three stage process. The stages in this process are supply chain metrics, financial metrics, return on assets, performance metrics, top third.
-
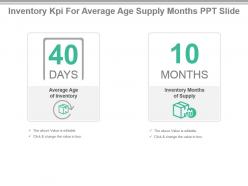 Inventory kpi for average age supply months ppt slide
Presenting inventory kpi for average age supply months ppt slide. This presentation slide shows Two Key Performance Indicators or KPIs. The first KPI that can be show is Average Age of Inventory. The second KPI is Inventory Months of Supply. These KPI Powerpoint graphics are all data driven, and the shape automatically adjusts according to your data. Just right click on the KPI graphic, enter the right value and the shape will adjust automatically. Make a visual impact with our KPI slides.
-
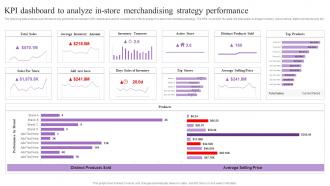 KPI Dashboard To Analyze In Store Merchandising Strategy Performance Increasing Brand Loyalty
The following slide outlines a performance key performance indicator KPI dashboard used to evaluate the effectiveness of in-store merchandising strategy. The KPIs covered in the slide are total sales, average inventory, active stores, distinct products sold, etc. Present the topic in a bit more detail with this KPI Dashboard To Analyze In Store Merchandising Strategy Performance Increasing Brand Loyalty. Use it as a tool for discussion and navigation on Total Sales, Strategy Performance, Inventory Turnover. This template is free to edit as deemed fit for your organization. Therefore download it now.
-
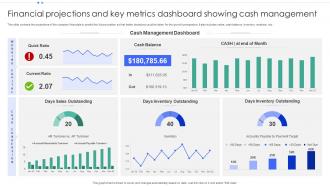 Financial Projections And Key Metrics Dashboard Showing Cash Management
This slide contains the projections of the company financials to predict the future position so that better decisions could be taken for the growth prospective. It also includes ratios, cash balance, inventory analysis , etc. Introducing our Financial Projections And Key Metrics Dashboard Showing Cash Management set of slides. The topics discussed in these slides are Cash Management Dashboard, Days Inventory Outstanding, Days Sales Outstanding. This is an immediately available PowerPoint presentation that can be conveniently customized. Download it and convince your audience.
-
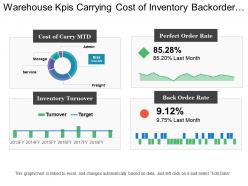 Warehouse kpis carrying cost of inventory backorder rate inventory turnover
Presenting this set of slides with name - Warehouse Kpis Carrying Cost Of Inventory Backorder Rate Inventory Turnover. This is a four stage process. The stages in this process are Warehouse Kpi, Warehouse Dashboard, Warehouse Metrics.
-
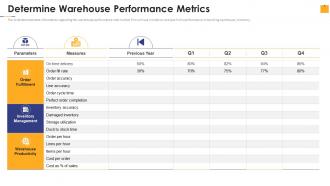 Warehouse Management Inventory Control Determine Warehouse Performance Metrics
The slide demonstrates information regarding the warehouse performance metrics that firm will use in order to analyze firms performance in handling warehouse, inventory. Present the topic in a bit more detail with this Warehouse Management Inventory Control Determine Warehouse Performance Metrics. Use it as a tool for discussion and navigation on Order Fulfillment, Inventory Management, Warehouse Productivity. This template is free to edit as deemed fit for your organization. Therefore download it now.
-
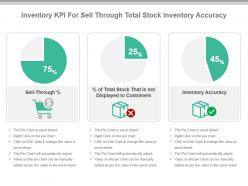 Inventory kpi for sell through total stock inventory accuracy presentation slide
Presenting inventory kpi for sell through total stock inventory accuracy presentation slide. This presentation slide shows Three Key Performance Indicators or KPIs in a Dashboard style design. The first KPI that can be shown is Sell Through Percentage. The second KPI is Percentage of Total Stock That is not Displayed to Customers. The third is Inventory Accuracy. These KPI Powerpoint graphics are all data driven, and the shape automatically adjusts according to your data. Just right click on the KPI graphic, enter the right value and the shape will adjust automatically. Make a visual impact with our KPI slides.
-
 Yearly products inventory turnover kpi
Presenting this set of slides with name Yearly Products Inventory Turnover KPI. The topics discussed in these slides are Transaction, Inventory, Target. This is a completely editable PowerPoint presentation and is available for immediate download. Download now and impress your audience.
-
 Inventory Management Icon With KPI Checklist
Introducing our premium set of slides with Inventory Management Icon With KPI Checklist. Ellicudate the three stages and present information using this PPT slide. This is a completely adaptable PowerPoint template design that can be used to interpret topics like Inventory Management Icon, KPI Checklist. So download instantly and tailor it with your information.
-
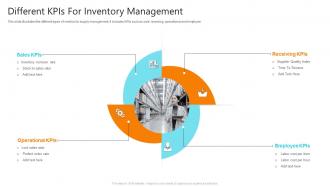 Different kpis For Inventory Management
This slide illustrates the different types of metrics for supply management. It includes KPIs such as sale, receiving, operational and employee. Presenting our set of slides with Different kpis For Inventory Management. This exhibits information on four stages of the process. This is an easy to edit and innovatively designed PowerPoint template. So download immediately and highlight information on Sales Kpis, Operational Kpis, Receiving Kpis, Employee Kpis.
-
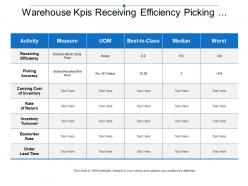 Warehouse kpis receiving efficiency picking accuracy carrying inventory
Presenting this set of slides with name - Warehouse Kpis Receiving Efficiency Picking Accuracy Carrying Inventory. This is a five stage process. The stages in this process are Warehouse Kpi, Warehouse Dashboard, Warehouse Metrics.
-
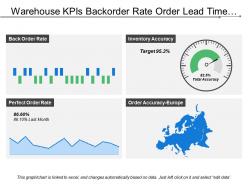 Warehouse kpis backorder rate order lead time inventory accuracy
Presenting this set of slides with name - Warehouse Kpis Backorder Rate Order Lead Time Inventory Accuracy. This is a four stage process. The stages in this process are Warehouse Kpi, Warehouse Dashboard, Warehouse Metrics.
-
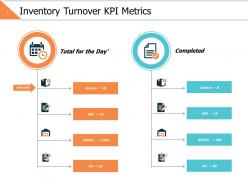 Inventory turnover kpi metrics ppt powerpoint presentation file display
Presenting this set of slides with name - Inventory Turnover Kpi Metrics Ppt Powerpoint Presentation File Display. This is a two stage process. The stages in this process are Business, Management, Strategy, Analysis, Icons.
-
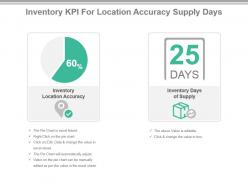 Inventory kpi for location accuracy supply days powerpoint slide
Presenting inventory kpi for location accuracy supply days powerpoint slide. This presentation slide shows Two Key Performance Indicators or KPIs in a Dashboard style design. The first KPI that can be shown is Inventory Location Accuracy. The second KPI is Inventory Days of Supply. These KPI Powerpoint graphics are all data driven, and the shape automatically adjusts according to your data. Just right click on the KPI graphic, enter the right value and the shape will adjust automatically. Make a visual impact with our KPI slides.
-
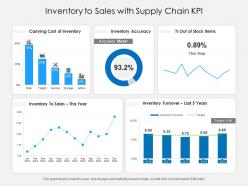 Inventory to sales with supply chain kpi
Presenting this set of slides with name Inventory To Sales With Supply Chain KPI. The topics discussed in these slides are Cost, Inventory, Target. This is a completely editable PowerPoint presentation and is available for immediate download. Download now and impress your audience.
-
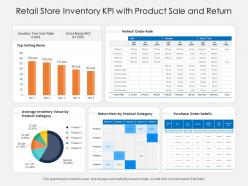 Retail store inventory kpi with product sale and return
Presenting this set of slides with name Retail Store Inventory KPI With Product Sale And Return. The topics discussed in these slides are Inventory, Value, Gross Margin. This is a completely editable PowerPoint presentation and is available for immediate download. Download now and impress your audience.
-
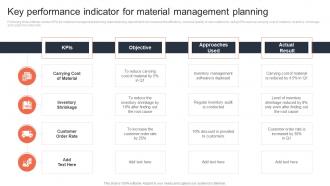 Key Performance Indicator For Material Management Planning
Following slide outlines various KPIs for material management planning. Manufacturing department can measure the efficiency, cost and quality of raw material by using KPIs such as carrying cost of material, inventory shrinkage and customer order rate. Introducing our Key Performance Indicator For Material Management Planning set of slides. The topics discussed in these slides are Carrying Cost Of Material, Customer Order Rate, Inventory Shrinkage. This is an immediately available PowerPoint presentation that can be conveniently customized. Download it and convince your audience.
-
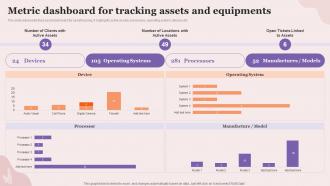 Metric Dashboard For Tracking Assets And Equipments Executing Fixed Asset Tracking System Inventory
This slide represents fixed asset dashboard for asset tracking. It highlights active assets, processors, operating system, devices etc. Deliver an outstanding presentation on the topic using this Metric Dashboard For Tracking Assets And Equipments Executing Fixed Asset Tracking System Inventory. Dispense information and present a thorough explanation of Equipments, Dashboard, Processors using the slides given. This template can be altered and personalized to fit your needs. It is also available for immediate download. So grab it now.
-
 Property and facility kpi dashboard showing sold homes per available inventory ratio
Get a chance to go through, property and facility KPI dashboard showing sold homes per available inventory ratio PowerPoint Presentation Slide. This Presentation has been designed by professionals and is fully editable. You can have access to play with the font size, font type, colors, and even the background. This Template is attainable with Google Slide and can be saved in JPG or PDF format without any hurdles created during the saving process. Fast download at the click of the button.
-
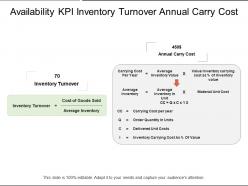 Availability kpi inventory turnover annual carry cost
Presenting this set of slides with name - Availability Kpi Inventory Turnover Annual Carry Cost. This is a two stage process. The stages in this process are Availability Kpi, Availability Dashboard, Availability Metrics.
-
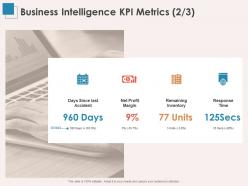 Business intelligence kpi metrics inventory ppt powerpoint presentation layout
Presenting this set of slides with name Business Intelligence KPI Metrics Inventory Ppt Powerpoint Presentation Layout. This is a four stage process. The stages in this process are Days Since Last Accident, Net Profit Margin, Remaining Inventory, Response Time. This is a completely editable PowerPoint presentation and is available for immediate download. Download now and impress your audience.
-
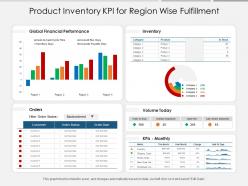 Product inventory kpi for region wise fulfillment
Presenting this set of slides with name Product Inventory KPI For Region Wise Fulfillment. The topics discussed in these slides are Global, Financial, Performance. This is a completely editable PowerPoint presentation and is available for immediate download. Download now and impress your audience.
-
 KPI Dashboard To Analyze In Store Developing Retail Merchandising Strategies Ppt Diagrams
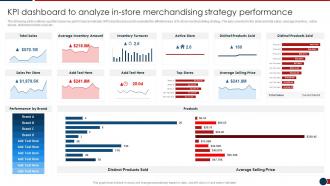
The following slide outlines a performance key performance indicator KPI dashboard used to evaluate the effectiveness of in store merchandising strategy. The kpis covered in the slide are total sales, average inventory, active stores, distinct products sold, etc. Present the topic in a bit more detail with this KPI Dashboard To Analyze In Store Developing Retail Merchandising Strategies Ppt Diagrams. Use it as a tool for discussion and navigation on KPI Dashboard To Analyze In Store Merchandising Strategy Performance. This template is free to edit as deemed fit for your organization. Therefore download it now.
-
 Kpi for inactive inventory value inventory shrinkage ppt slide
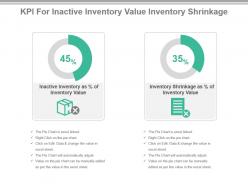
Presenting kpi for inactive inventory value inventory shrinkage ppt slide. This presentation slide shows Two Key Performance Indicators or KPIs in a Dashboard style design. The first KPI that can be shown is Inactive Inventory as Percentage of Inventory Value. The second KPI is Inventory Shrinkage as Percentage of Inventory Value. These KPI Powerpoint graphics are all data driven, and the shape automatically adjusts according to your data. Just right click on the KPI graphic, enter the right value and the shape will adjust automatically. Make a visual impact with our KPI slides.


