KPI Dashboard For Corporate Managers, Executives, HR, Risk Management PowerPoint Templates
-
 Financial Performance KPI Powerpoint Ppt Template Bundles
Deliver a credible and compelling presentation by deploying this Financial Performance KPI Powerpoint Ppt Template Bundles. Intensify your message with the right graphics, images, icons, etc. presented in this complete deck. This PPT template is a great starting point to convey your messages and build a good collaboration. The twelve slides added to this PowerPoint slideshow helps you present a thorough explanation of the topic. You can use it to study and present various kinds of information in the form of stats, figures, data charts, and many more. This Financial Performance KPI Powerpoint Ppt Template Bundles PPT slideshow is available for use in standard and widescreen aspects ratios. So, you can use it as per your convenience. Apart from this, it can be downloaded in PNG, JPG, and PDF formats, all completely editable and modifiable. The most profound feature of this PPT design is that it is fully compatible with Google Slides making it suitable for every industry and business domain.
-
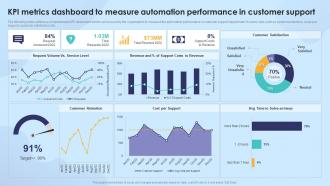 Strengthening Process Improvement KPI Metrics Dashboard To Measure Automation Performance
The following slide outlines a comprehensive KPI dashboard which can be used by the organization to measure the automation performance in customer support department. It covers kpis such as customer retention, costs per support, customer satisfaction, etc. Present the topic in a bit more detail with this Strengthening Process Improvement KPI Metrics Dashboard To Measure Automation Performance. Use it as a tool for discussion and navigation on Request Volume Vs Service Level, Customer Satisfaction, Cost Per Support, Customer Retention. This template is free to edit as deemed fit for your organization. Therefore download it now.
-
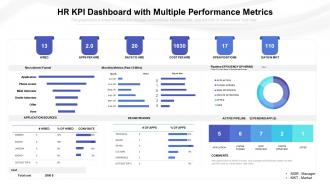 Hr kpi dashboard with multiple performance metrics
Presenting HR KPI Dashboard With Multiple Performance Metrics PPT template. This is a customized slide and can be edited as per your requirements. You can add texts, images, graphics, and infographics. The template supports Google Slides as well. Perfectly ideal for all types of screen, be it small or big.
-
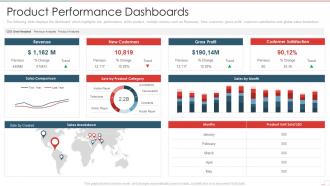 New product performance evaluation product performance dashboards
The following slide displays the dashboard which highlights the performance of the product, multiple metrics such as Revenues, New customer, gross profit, customer satisfaction and global sales breakdown Present the topic in a bit more detail with this New Product Performance Evaluation Product Performance Dashboards. Use it as a tool for discussion and navigation on Product Performance Dashboards. This template is free to edit as deemed fit for your organization. Therefore download it now.
-
 Organizational Performance Management KPI Balanced Scorecard
Introducing our Organizational Performance Management KPI Balanced Scorecard set of slides. The topics discussed in these slides are Financial, Customer, Internal, Learning, Growth. This is an immediately available PowerPoint presentation that can be conveniently customized. Download it and convince your audience.
-
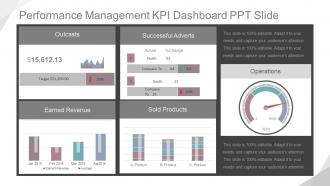 Performance Management Kpi Dashboard Snapshot Ppt Slide
Presenting performance management kpi dashboard snapshot ppt slide. This is a performance management kpi dashboard ppt slide. This is a five stage process. The stages in this process are product, sold products, compare to, south, north, actual, change, successful adverts, jan, feb, mar, apr, earned revenue, average, target, outcasts, operations.
-
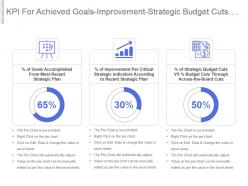 Kpi for achieved goals improvement strategic budget cuts vs across the board cuts powerpoint slide
Presenting kpi for achieved goals improvement strategic budget cuts vs across the board cuts powerpoint slide. This presentation slide shows three Key Performance Indicators or KPIs in a Dashboard style design. The first KPI that can be shown is percentage of Goals Accomplished From Most Recent Strategic Plan. The second KPI is percentage of Improvement Per Critical Strategic Indicators According to Recent Strategic Plan and the third is percentage of Strategic Budget Cuts VS percentage Budget Cuts Through Across the Board Cuts. These KPI Powerpoint graphics are all data driven, and the shape automatically adjusts according to your data. Just right click on the KPI graphic, enter the right value and the shape will adjust automatically. Make a visual impact with our KPI slides.
-
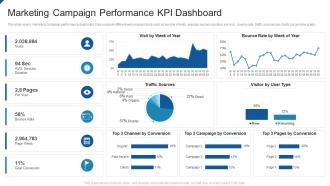 Marketing campaign performance kpi dashboard
Presenting our well structured Marketing Campaign Performance KPI Dashboard. The topics discussed in this slide are Marketing Campaign Performance Kpi Dashboard. This is an instantly available PowerPoint presentation that can be edited conveniently. Download it right away and captivate your audience.
-
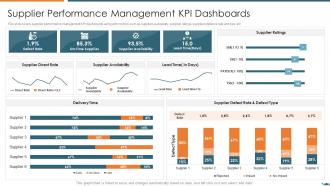 Supplier performance management kpi vendor relationship management strategies
This slide covers supplier performance management KPI dashboards along with metrics such as suppliers availability, supplier ratings, suppliers defence rate and type etc. Deliver an outstanding presentation on the topic using this Supplier Performance Management KPI Vendor Relationship Management Strategies. Dispense information and present a thorough explanation of Supplier Direct Rate, Supplier Availability, Lead Time using the slides given. This template can be altered and personalized to fit your needs. It is also available for immediate download. So grab it now
-
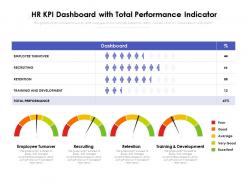 Hr kpi dashboard with total performance indicator
Presenting HR KPI Dashboard With Total Performance Indicator PPT template. The slide is completely modifiable with so many features available. The slide can be viewed on different screen sizes. The presentation can be saved in various formats like PDF, JPG, and PNG. Add relevant text, graphics, and icons to your presentation.
-
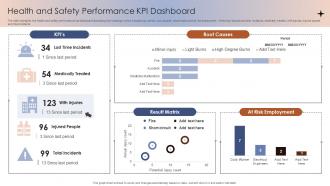 Health And Safety Performance KPI Dashboard
The slide highlights the health and safety performance kpi dashboard illustrating key headings which includes kpi, period, root causes, result matrix and at risk employment. Where kpi depicts lost time incidents, medically treated, with injuries, injured people and total incidents Presenting our well-structured Health And Safety Performance KPI Dashboard. The topics discussed in this slide are Root Causes, Result Matrix, At Risk Employment. This is an instantly available PowerPoint presentation that can be edited conveniently. Download it right away and captivate your audience.
-
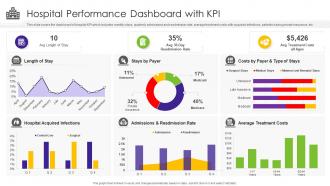 Hospital Performance Dashboard With KPI
This slide covers the dashboard of hospital KPI which includes monthly stays, quarterly admissions and readmission rate, average treatment costs with acquired infections, patients having private insurance, etc. Presenting our well structured Hospital Performance Dashboard With KPI. The topics discussed in this slide are Avg Length Of Stay, Avg Treatment Costs All Ages, Stays By Payer, Average Treatment Costs, Admissions And Readmission Rate, Hospital Acquired Infections, Length Of Stay. This is an instantly available PowerPoint presentation that can be edited conveniently. Download it right away and captivate your audience.
-
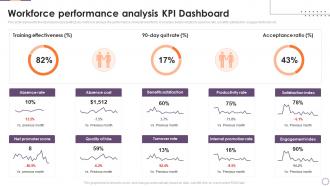 Implementing Business Enhancing Hr Operation Workforce Performance Analysis Kpi Dashboard
This slide represents the dashboard representing key metrics to analyze the performance of overall workforce. It includes details related to absence rate, benefits satisfaction, engagement index etc. Deliver an outstanding presentation on the topic using this Implementing Business Enhancing Hr Operation Workforce Performance Analysis Kpi Dashboard. Dispense information and present a thorough explanation of Workforce, Performance, Analysis using the slides given. This template can be altered and personalized to fit your needs. It is also available for immediate download. So grab it now.
-
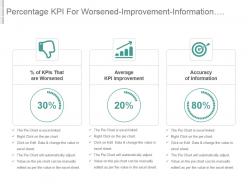 Percentage kpi for worsened improvement information accuracy presentation slide
We proudly present to you our percentage KPI for bass and improvement information accuracy presentation slides. This deck of slide can be viewed in standard size display ratio of 4:3 or white screen display ratio of 16:9. You can save this PPT slideshow in either JPG or PDF format. Since the template is fully editable you can make as many changes as you want to as per your requirements. This presentation is also compatible with Google slides, which makes it easier to operate.
-
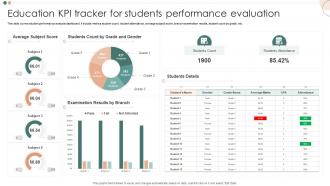 Education KPI Tracker For Students Performance Evaluation
This slide covers student performance analysis dashboard. It include metrics student count, student attendance, average subject score, branch examination results, student count by grade, etc. Introducing our Education KPI Tracker For Students Performance Evaluation set of slides. The topics discussed in these slides are Education KPI Tracker, Performance Evaluation. This is an immediately available PowerPoint presentation that can be conveniently customized. Download it and convince your audience.
-
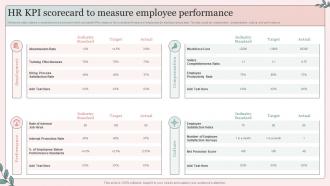 HR KPI Scorecard To Measure Employee Performance
Mentioned slide outlines a comprehensive scorecard which can assist HR to measure the overall performance of employees by tracking various kpis. The kpis could be employment compensation culture and performance. Introducing our HR KPI Scorecard To Measure Employee Performance set of slides. The topics discussed in these slides are Employment, Performance, Culture, Compensation. This is an immediately available PowerPoint presentation that can be conveniently customized. Download it and convince your audience.
-
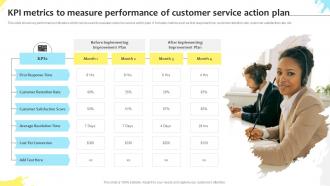 KPI Metrics To Measure Performance Of Customer Service Action Plan
This slide shows key performance indicators which can be used to evaluate customer service action plan. It includes metrics such as first response time, customer retention rate, customer satisfaction rate, etc. Introducing our premium set of slides with KPI Metrics To Measure Performance Of Customer Service Action Plan. Elucidate the one stages and present information using this PPT slide. This is a completely adaptable PowerPoint template design that can be used to interpret topics like First Response Time, Customer Retention Rate, Customer Satisfaction Score, Average Resolution Time . So download instantly and tailor it with your information.
-
 Performance Management KPIS And Dashboard Kpi Metrics Ppt Powerpoint
Presenting this set of slides with name Performance Management KPIS And Dashboard Kpi Metrics Ppt Powerpoint Presentation. This is a three stage process. The stages in this process are Performance Management Program, Planning, Action, Result, Business. This is a completely editable PowerPoint presentation and is available for immediate download. Download now and impress your audience.
-
 Performance Kpi Dashboard Highlighting Marketing Campaign Results
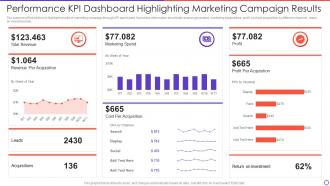
The purpose of this slide is to highlight results of marketing campaign through KPI dashboard. It provides information about total revenue generated, marketing expenditure, profit, cost per acquisition by different channels, return on investment etc. Presenting our well-structured Performance Kpi Dashboard Highlighting Marketing Campaign Results. The topics discussed in this slide are Performance, Dashboard, Highlighting, Marketing. This is an instantly available PowerPoint presentation that can be edited conveniently. Download it right away and captivate your audience.
-
 Supplier Performance Management KPI Dashboards Ppt Powerpoint Presentation Layouts
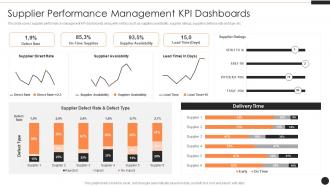
This slide covers supplier performance management KPI dashboards along with metrics such as suppliers availability, supplier ratings, suppliers defence rate and type etc. Present the topic in a bit more detail with this Supplier Performance Management KPI Dashboards Ppt Powerpoint Presentation Layouts. Use it as a tool for discussion and navigation on Supplier Ratings, Supplier Availability, Supplier Direct Rate. This template is free to edit as deemed fit for your organization. Therefore download it now.
-
 KPI Dashboard To Measure Product Expansion Strategy Performance
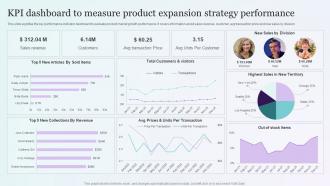
This slide signifies the key performance indicator dashboard to evaluate product market growth performance. It covers information about sales revenue, customer, avg transaction price and new sales by division Introducing our KPI Dashboard To Measure Product Expansion Strategy Performance set of slides. The topics discussed in these slides are Sales Revenue, Customers, Avg Transaction Price, Units Per Customer. This is an immediately available PowerPoint presentation that can be conveniently customized. Download it and convince your audience.
-
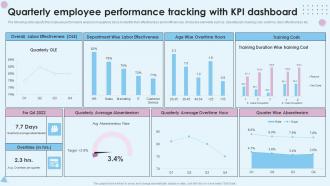 Quarterly Employee Performance Tracking With KPI Dashboard
The following slide depicts the employee performance analysis on quarterly basis to identify their effectiveness and inefficiencies. It includes elements such as absenteeism, training cost, overtime, labor effectiveness etc. Presenting our well-structured Quarterly Employee Performance Tracking With KPI Dashboard. The topics discussed in this slide are Quarterly, Employee Performance Tracking, KPI Dashboard. This is an instantly available PowerPoint presentation that can be edited conveniently. Download it right away and captivate your audience.
-
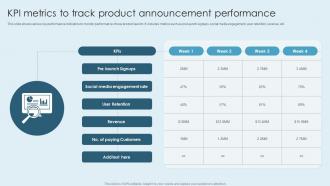 KPI Metrics To Track Product Announcement Performance
This slide shows various key performance indicators to monitor performance of new product launch. It includes metrics such as pre launch signups, social media engagement, user retention, revenue, etc. Presenting our well-structured KPI Metrics To Track Product Announcement Performance. The topics discussed in this slide are Revenue, Social Media, Engagement Rate, User Retention. This is an instantly available PowerPoint presentation that can be edited conveniently. Download it right away and captivate your audience.
-
 Communication Change Management Kpi Dashboard Performance Management
Presenting this set of slides with name - Communication Change Management Kpi Dashboard Performance Management. This is an editable four graphic that deals with topics like Communication Change Management, Kpi Dashboard, Performance Management to help convey your message better graphically. This product is a premium product available for immediate download, and is 100 percent editable in Powerpoint. Download this now and use it in your presentations to impress your audience.
-
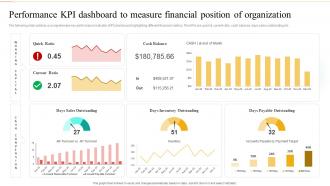 Performance KPI Dashboard To Measure Financial Position Of Organization Ultimate Guide To Financial Planning
The following slide outlines a comprehensive key performance indicator KPI dashboard highlighting different financial metrics. The KPIs are quick and current ratio, cash balance, days sales outstanding etc.Deliver an outstanding presentation on the topic using this Performance KPI Dashboard To Measure Financial Position Of Organization Ultimate Guide To Financial Planning. Dispense information and present a thorough explanation of Sales Outstanding, Inventory Outstanding, Payable Outstanding using the slides given. This template can be altered and personalized to fit your needs. It is also available for immediate download. So grab it now.
-
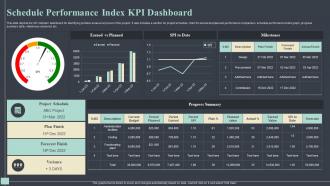 Schedule Performance Index KPI Dashboard
This slide depicts the SPI indicator dashboard for identifying problem areas at any level of the project. It also includes a section for project schedule, chart for earned and planned performance comparison, schedule performance index graph, progress summary table, milestones achieved, etc. Introducing our Schedule Performance Index KPI Dashboard set of slides. The topics discussed in these slides are Schedule Performance, Project Schedule, Forecast Finish. This is an immediately available PowerPoint presentation that can be conveniently customized. Download it and convince your audience.
-
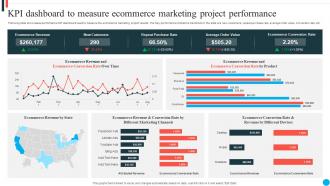 KPI Dashboard To Measure Ecommerce Marketing Project Performance
Following slide showcases performance KPI dashboard used to measure the ecommerce marketing project results. The Key performance indicators mentioned in the slide are new customers, repeat purchase rate, average order value, conversion rate, etc. Presenting our well-structured KPI Dashboard To Measure Ecommerce Marketing Project Performance. The topics discussed in this slide are KPI Dashboard, Measure, Ecommerce Marketing, Project Performance. This is an instantly available PowerPoint presentation that can be edited conveniently. Download it right away and captivate your audience.
-
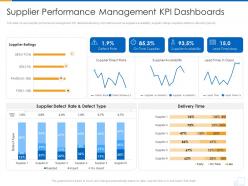 Supplier performance management kpi dashboards supplier strategy ppt styles
This slide covers supplier performance management KPI dashboards along with metrics such as suppliers availability, supplier ratings, suppliers defence rate and type etc. Present the topic in a bit more detail with this Supplier Performance Management Kpi Dashboards Supplier Strategy Ppt Styles. Use it as a tool for discussion and navigation on Rate, Supplier. This template is free to edit as deemed fit for your organization. Therefore download it now.
-
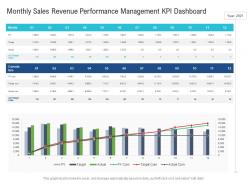 Monthly sales revenue performance management kpi dashboard
Presenting our well-structured Monthly Sales Revenue Performance Management KPI Dashboard. The topics discussed in this slide are Monthly Sales Revenue Performance Management KPI Dashboard. This is an instantly available PowerPoint presentation that can be edited conveniently. Download it right away and captivate your audience.
-
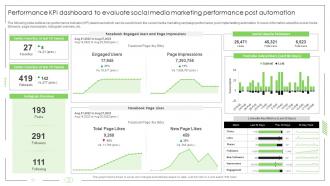 Performance KPI Dashboard To Evaluate Social Media Marketing Performance Post Automation
The following slide outlines key performance indicator KPI dashboard which can be used to track the social media marketing campaign performance, post implementing automation. It covers information about the social media followers, page impressions, instagram overview, etc.Deliver an outstanding presentation on the topic using this Performance KPI Dashboard To Evaluate Social Media Marketing Performance Post Automation. Dispense information and present a thorough explanation of Twitter Favorites, Instagram Overview, Media Followers using the slides given. This template can be altered and personalized to fit your needs. It is also available for immediate download. So grab it now.
-
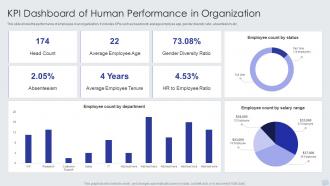 KPI Dashboard Of Human Performance In Organization
This slide shows the performance of employees in an organization. It includes KPIs such as headcount, average employee age, gender diversity ratio, absenteeism, etc. Introducing our KPI Dashboard Of Human Performance In Organization set of slides. The topics discussed in these slides are Head Count, Average Employee Age, Gender Diversity Ratio. This is an immediately available PowerPoint presentation that can be conveniently customized. Download it and convince your audience.
-
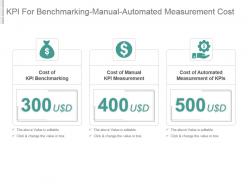 Kpi for benchmarking manual automated measurement cost presentation slide
Presenting kpi for benchmarking manual automated measurement cost presentation slide. This presentation slide shows three Key Performance Indicators or KPIs in a Dashboard style design. The first KPI that can be shown is Cost of KPI Benchmarking. The second KPI is Cost of Manual KPI Measurement and the third is Cost of Automated Measurement of KPIs. These KPI Powerpoint graphics are all data driven, and the shape automatically adjusts according to your data. Just right click on the KPI graphic, enter the right value and the shape will adjust automatically. Make a visual impact with our KPI slides.
-
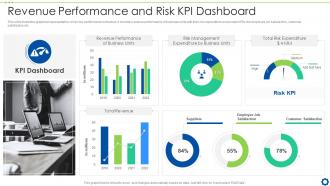 Revenue Performance And Risk KPI Dashboard Snapshot
This slide illustrates graphical representation of risk key performance indicators. It includes revenue performance of business units with their risk expenditure and people KRIs like employee job satisfaction, customer satisfaction etc. Introducing our Revenue Performance And Risk KPI Dashboard set of slides. The topics discussed in these slides are KPI Dashboard, Revenue Performance of Business Units, Risk Management Expenditure by Business Units. This is an immediately available PowerPoint presentation that can be conveniently customized. Download it and convince your audience.
-
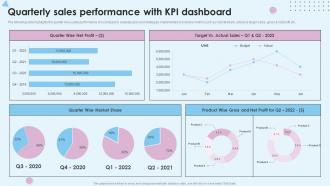 Quarterly Sales Performance With KPI Dashboard
The following slide highlights the quarter wise sales performance of a company to evaluate plan and strategies implemented. It includes metrics such as market share, actual vs target sales, gross and net profit etc. Introducing our Quarterly Sales Performance With KPI Dashboard set of slides. The topics discussed in these slides are Quarterly Sales Performance, KPI Dashboard. This is an immediately available PowerPoint presentation that can be conveniently customized. Download it and convince your audience.
-
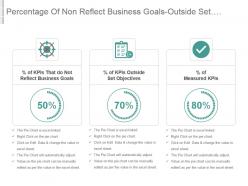 Percentage of non reflect business goals outside set objectives measured kpis ppt slide
Presenting percentage of non reflect business goals outside set objectives measured kpis ppt slide. This presentation slide shows three Key Performance Indicators or KPIs in a Dashboard style design. The first KPI that can be shown is percentage of KPIs That do Not Reflect Business Goals. The second KPI is percentage of KPIs Outside Set Objectives and the third is percentage of Measured KPIs. These KPI Powerpoint graphics are all data driven, and the shape automatically adjusts according to your data. Just right click on the KPI graphic, enter the right value and the shape will adjust automatically. Make a visual impact with our KPI slides.
-
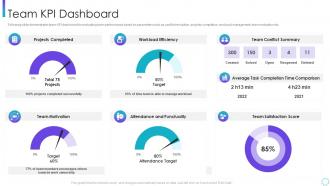 Team kpi dashboard corporate program improving work team productivity
Following slide demonstrates team KPI dashboard for evaluating team performance based on parameters such as conflict resolution, projects completion, workload management, team motivation etc. Deliver an outstanding presentation on the topic using this Team Kpi Dashboard Corporate Program Improving Work Team Productivity. Dispense information and present a thorough explanation of Team KPI Dashboard using the slides given. This template can be altered and personalized to fit your needs. It is also available for immediate download. So grab it now.
-
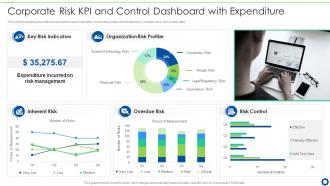 Corporate Risk KPI And Control Dashboard Snapshot With Expenditure
This slide illustrates corporate risk key performance indicators. It includes graphs of inherent risks, overdue risks, risk control data. Introducing our Corporate Risk KPI And Control Dashboard Snapshot With Expenditure set of slides. The topics discussed in these slides are Key Risk Indicators, Organization Risk Profiler, Overdue Risk, Risk Control, Inherent Risk. This is an immediately available PowerPoint presentation that can be conveniently customized. Download it and convince your audience.
-
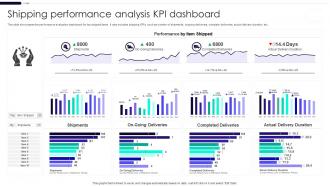 Shipping Performance Analysis KPI Dashboard
This slide showcases the performance evaluation dashboard for top shipped items. It also includes shipping KPIs such as number of shipments, ongoing deliveries, complete deliveries, actual delivery duration, etc. Introducing our Shipping Performance Analysis KPI Dashboard set of slides. The topics discussed in these slides are Completed Deliveries, Actual Delivery Duration, On Going Deliveries, Shipments. This is an immediately available PowerPoint presentation that can be conveniently customized. Download it and convince your audience.
-
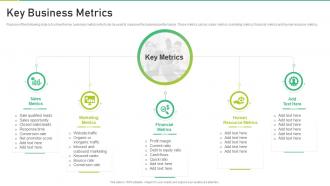 Key Business Metrics Corporate Business Playbook
Purpose of the following slide is to show the key business metrics which can be used to measure the business performance. These metrics can be sales metrics, marketing metrics, financial metrics and human resource metrics. Introducing Key Business Metrics Corporate Business Playbook to increase your presentation threshold. Encompassed with five stages, this template is a great option to educate and entice your audience. Dispence information on Marketing Metrics, Sales Metrics, Financial Metrics, Resource Metrics, using this template. Grab it now to reap its full benefits.
-
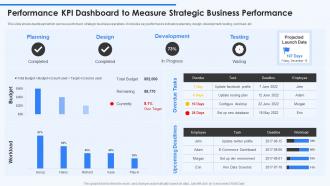 Performance KPI Dashboard To Measure Strategic Business Performance
This slide shows dashboard which can be used to track strategic business operations. It includes key performance indicators planning, design, development, testing, workload, etc. Presenting our well structured Performance KPI Dashboard To Measure Strategic Business Performance. The topics discussed in this slide are Planning, Development, Testing. This is an instantly available PowerPoint presentation that can be edited conveniently. Download it right away and captivate your audience.
-
 Financial Performance KPI Cash Balance Icon
Presenting our set of slides with name Financial Performance KPI Cash Balance Icon. This exhibits information on three stages of the process. This is an easy-to-edit and innovatively designed PowerPoint template. So download immediately and highlight information on Financial Performance KPI, Cash Balance Icon.
-
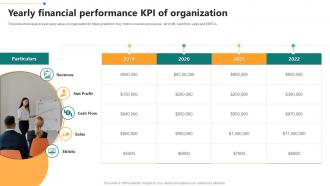 Yearly Financial Performance KPI Of Organization
This slide showcases to past years values of organization for future prediction. Key metrics covered are revenue, net profit, cash flow, sales and EBITDA. Presenting our set of slides with name Yearly Financial Performance KPI Of Organization. This exhibits information on five stages of the process. This is an easy-to-edit and innovatively designed PowerPoint template. So download immediately and highlight information on Revenue, Net Profit, Cash Flow, Sales.
-
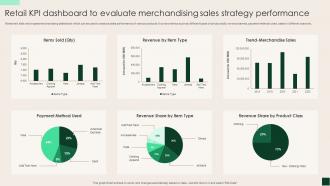 Retail KPI Dashboard To Evaluate Merchandising Sales Strategy Performance
Mentioned slide showcases merchandising dashboard which can be used to analyze sales performance of various products. It covers metrics such as different types of product sold, revenue earned, payment methods used, sales in different years etc. Introducing our Retail KPI Dashboard To Evaluate Merchandising Sales Strategy Performance set of slides. The topics discussed in these slides are Retail KPI, Dashboard, Merchandising, Sales Strategy, Performance. This is an immediately available PowerPoint presentation that can be conveniently customized. Download it and convince your audience.
-
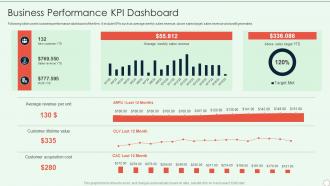 Brand Development Guide Business Performance KPI Dashboard
Following slide covers business performance dashboard of the firm. It include KPIs such as average weekly sales revenue, above sales target, sales revenue and profit generated. Present the topic in a bit more detail with this Brand Development Guide Business Performance KPI Dashboard. Use it as a tool for discussion and navigation on Average Revenue Per Unit, Customer Lifetime Value, Customer Acquisition Cost. This template is free to edit as deemed fit for your organization. Therefore download it now.
-
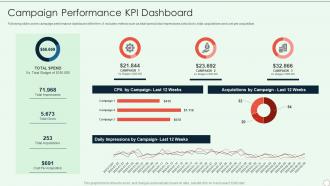 Brand Development Guide Campaign Performance KPI Dashboard
Following slide covers campaign performance dashboard of the firm. It includes metrics such as total spend, total impressions, total clicks, total acquisitions and cost per acquisition. Deliver an outstanding presentation on the topic using this Brand Development Guide Campaign Performance KPI Dashboard. Dispense information and present a thorough explanation of Acquisitions By Campaign, CPA By Campaign, Impressions, Daily Impressions By Campaign, Acquisitions using the slides given. This template can be altered and personalized to fit your needs. It is also available for immediate download. So grab it now.
-
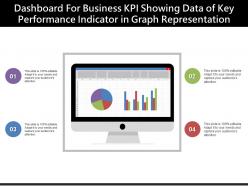 Dashboard for business kpi showing data of key performance indicator in graph representation
Presenting this set of slides with name - Dashboard For Business Kpi Showing Data Of Key Performance Indicator In Graph Representation. This is a four stage process. The stages in this process are Business Kpi, Business Dashboard, Business Metrics.
-
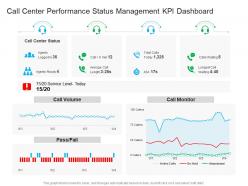 Call center performance status management kpi dashboard
Introducing our Call Center Performance Status Management KPI Dashboard set of slides. The topics discussed in these slides are Call Center Performance Status Management KPI Dashboard. This is an immediately available PowerPoint presentation that can be conveniently customized. Download it and convince your audience.
-
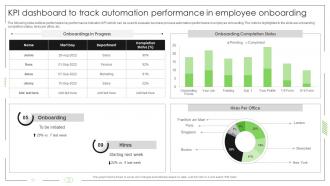 Business Process Automation KPI Dashboard To Track Automation Performance In Employee Onboarding
The following slide outlines performance key performance indicator KPI which can be used to evaluate business process automation performance in employee onboarding. The metrics highlighted in the slide are onboarding completion status, hires per office, etc.Present the topic in a bit more detail with this Business Process Automation KPI Dashboard To Track Automation Performance In Employee Onboarding. Use it as a tool for discussion and navigation on Onboarding, Completion Status, Hires Office. This template is free to edit as deemed fit for your organization. Therefore download it now.
-
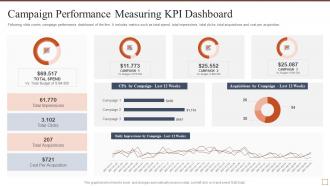 Campaign performance measuring kpi dashboard effective brand building strategy
Present the topic in a bit more detail with this Campaign Performance Measuring KPI Dashboard Effective Brand Building Strategy. Use it as a tool for discussion and navigation on Campaign Performance Measuring KPI DashboardFollowing slide covers campaign performance dashboard of the firm. It includes metrics such as total spend, total impressions, total clicks, total acquisitions and cost per acquisition. . This template is free to edit as deemed fit for your organization. Therefore download it now.
-
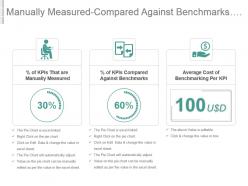 Manually measured compared against benchmarks benchmarking cost per kpi ppt slide
Presenting manually measured compared against benchmarks benchmarking cost per kpi ppt slide. This presentation slide shows three Key Performance Indicators or KPIs in a Dashboard style design. The first KPI that can be shown is percentage of KPIs That are Manually Measured. The second KPI is percentage of KPIs Compared Against Benchmarks and the third is Average Cost of Benchmarking Per KPI. These KPI Powerpoint graphics are all data driven, and the shape automatically adjusts according to your data. Just right click on the KPI graphic, enter the right value and the shape will adjust automatically. Make a visual impact with our KPI slides.
-
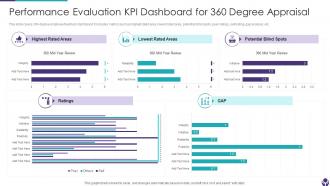 Performance Evaluation KPI Dashboard For 360 Degree Appraisal
This slide covers 360 degree employee feedback dashboard. It includes metrics such as highest rated area, lowest rated area, potential blind spots, peer ratings, self rating, gap analysis, etc. Introducing our Performance Evaluation KPI Dashboard For 360 Degree Appraisal set of slides. The topics discussed in these slides are Potential Blind Spots, Peer Ratings, Self Rating, Gap Analysis. This is an immediately available PowerPoint presentation that can be conveniently customized. Download it and convince your audience.
-
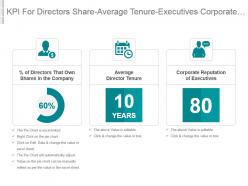 Kpi for directors share average tenure executives corporate reputation powerpoint slide
Presenting kpi for directors share average tenure executives corporate reputation powerpoint slide. This presentation slide shows three Key Performance Indicators or KPIs in a Dashboard style design. The first KPI that can be shown is percentage of Directors That Own Shares in the Company. The second KPI is Average Director Tenure and the third is Corporate Reputation of Executives. These KPI Powerpoint graphics are all data driven, and the shape automatically adjusts according to your data. Just right click on the KPI graphic, enter the right value and the shape will adjust automatically. Make a visual impact with our KPI slides.
-
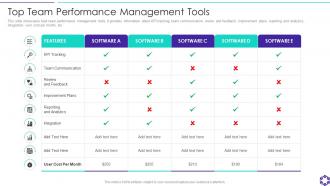 Top Team Performance Management Tools
This slide showcases best team performance management tools. It provides information about KPI tracking, team communication, review and feedback, improvement plans, reporting and analytics, integration, user cost per month, etc. Presenting our well structured Top Team Performance Management Tools. The topics discussed in this slide are Top Team Performance Management Tools. This is an instantly available PowerPoint presentation that can be edited conveniently. Download it right away and captivate your audience.
-
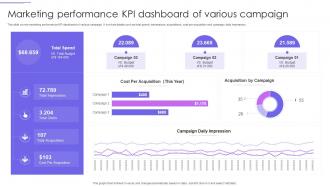 Marketing Performance KPI Dashboard Of Various Campaign
This slide covers marketing performance KPI dashboard of various campaign. It involves details such as total spend, impressions, acquisitions, cost per acquisition and campaign daily impression. Presenting our well structured Marketing Performance KPI Dashboard Of Various Campaign. The topics discussed in this slide are Total Spend, Total Impressions, Total Clicks, Total Acquisitions. This is an instantly available PowerPoint presentation that can be edited conveniently. Download it right away and captivate your audience.
-
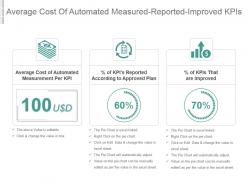 Average cost of automated measured reported improved kpis ppt slide
Presenting average cost of automated measured reported improved kpis ppt slide. This presentation slide shows three Key Performance Indicators or KPIs in a Dashboard style design. The first KPI that can be shown is Average Cost of Automated Measurement Per KPI. The second KPI is percentage of KPIs Reported According to Approved Plan and the third is percentage of KPIs That are Improved. These KPI Powerpoint graphics are all data driven, and the shape automatically adjusts according to your data. Just right click on the KPI graphic, enter the right value and the shape will adjust automatically. Make a visual impact with our KPI slides.
-
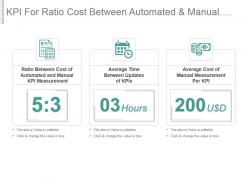 Kpi for ratio cost between automated and manual measurement updates time presentation slide
Presenting kpi for ratio cost between automated and manual measurement updates time presentation slide. This presentation slide shows three Key Performance Indicators or KPIs in a Dashboard style design. The first KPI that can be shown is Ratio Between Cost of Automated and Manual KPI Measurement. The second KPI is Average Time Between Updates of KPIs and the third is Average Cost of Manual Measurement Per KPI. These KPI Powerpoint graphics are all data driven, and the shape automatically adjusts according to your data. Just right click on the KPI graphic, enter the right value and the shape will adjust automatically. Make a visual impact with our KPI slides.
-
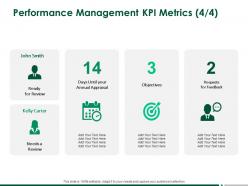 Performance management kpi metrics objectives planning ppt powerpoint presentation pictures
Presenting this set of slides with name Performance Management KPI Metrics Objectives Planning Ppt Powerpoint Presentation Pictures. The topics discussed in these slides are Business, Planning, Strategy, Marketing, Management. This is a completely editable PowerPoint presentation and is available for immediate download. Download now and impress your audience.
-
 Business kpi showing key performance indicator of company through target point and line graph
Presenting this set of slides with name - Business Kpi Showing Key Performance Indicator Of Company Through Target Point And Line Graph. This is a three stage process. The stages in this process are Business Kpi, Business Dashboard, Business Metrics.
-
 Insurance company performance kpi dashboard analysis
Presenting this set of slides with name Insurance Company Performance KPI Dashboard Analysis. The topics discussed in these slides are Insurance Company Performance KPI Dashboard Analysis. This is a completely editable PowerPoint presentation and is available for immediate download. Download now and impress your audience.
-
 Kpi for enterprise performance management system
Introducing our premium set of slides with KPI For Enterprise Performance Management System. Elucidate the three stages and present information using this PPT slide. This is a completely adaptable PowerPoint template design that can be used to interpret topics like KPI For Enterprise Performance Management System. So download instantly and tailor it with your information.


