


Education KPI Tracker For Students Performance Evaluation




Try Before you Buy Download Free Sample Product
 Impress Your
 Audience
 100%
100% Editable
 Save Hours
 of Time


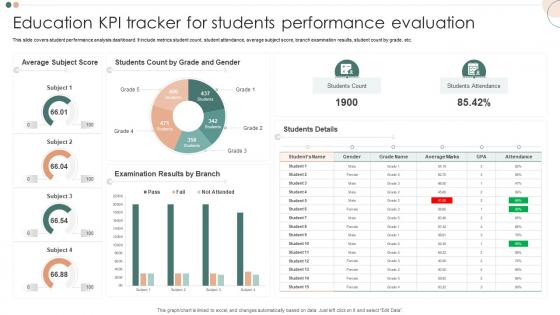
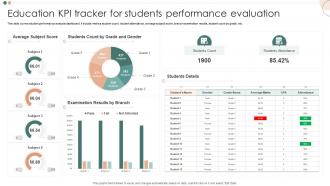
This slide covers student performance analysis dashboard. It include metrics student count, student attendance, average subject score, branch examination results, student count by grade, etc.
People who downloaded this PowerPoint presentation also viewed the following :
Education KPI Tracker For Students Performance Evaluation with all 7 slides:
Use our Education KPI Tracker For Students Performance Evaluation to effectively help you save your valuable time. They are readymade to fit into any presentation structure.
-
Education KPI Tracker For Students Performance Evaluation
-
Education KPI Tracker For Students Performance Evaluation
-

Education KPI Tracker For Students Performance Evaluation
-

Education KPI Tracker For Students Performance Evaluation
-

Education KPI Tracker For Students Performance Evaluation
-

Education KPI Tracker For Students Performance Evaluation
-

Education KPI Tracker For Students Performance Evaluation
FAQs for Education KPI Tracker For
For your education KPI tracker, I'd focus on the big ones first - student achievement scores, graduation rates, and attendance. Teacher retention is huge too, honestly probably more important than people realize. Enrollment numbers and student-to-teacher ratios are boring but your admin will definitely ask about them. Budget per student always comes up in those budget meetings. Oh, and don't skip the softer stuff like extracurricular participation and parent satisfaction - they actually tell you a lot about how things are really going. Start with maybe 6-8 metrics so you don't go crazy, then build from there.
Honestly, KPI trackers are game-changers for catching stuff early. Instead of guessing what's wrong, you'll actually see which students need help and what teaching methods bomb (or work great). Real-time progress tracking is clutch too. I'd start with maybe 3-4 simple metrics - assignment completion rates, topic-specific scores, engagement levels. Nothing crazy complicated at first. The satisfying part? Watching those numbers actually improve over time. My colleague swears by this approach and her class performance shot up last semester. Focus on metrics that directly tie to student success, not just random data points.
So your KPI tracker is just a fancy spreadsheet without analysis, right? Look for patterns you'd miss otherwise - like when engagement usually tanks or which teaching methods actually work. Surface metrics lie all the time (learned that the hard way). You'll spot root causes and catch problems early. Honestly, the predictive stuff is where it gets interesting. Don't analyze everything at once though - pick 2-3 key relationships first. That's how you turn numbers into decisions that actually matter for your students.
Honestly, start with what actually matters to your department - don't just use whatever generic template they give you. Like if you're in student services, track retention and satisfaction scores instead of test scores. Most tools these days are pretty flexible, you can add custom fields and set different targets. Build separate dashboards for different people too - your boss probably wants different data than your team does. Oh and definitely adjust how often you get reports, daily updates can be super annoying. Just list your top 3-5 priorities first, then build everything around those. Way better than starting backwards.
Figure out what you actually want to fix first, then work backwards from there. Like instead of "better reading," go for something concrete - "boost comprehension scores 15% by January." I'd stick to maybe 3-4 metrics tops because otherwise you'll go crazy tracking everything. Look at last year's numbers to set targets that aren't completely unrealistic. Monthly check-ins work better than waiting till the end of the year when it's too late to adjust. Oh, and pick stuff teachers can actually control in their classrooms - that's what moves the needle.
Look, having one KPI tracker basically stops everyone from arguing about different numbers. Teachers, parents, admin - they're all looking at the same data instead of having those weird meetings where nobody's on the same page. You can actually show progress over time, which honestly makes such a huge difference for building trust. No more scattered "how are we doing" conversations that go nowhere. The dashboard becomes something everyone understands, not just the data nerds. Just make sure you set up regular sessions where people can dig into the numbers together and actually talk about what they mean.
Honestly? Start with whatever your team already knows - Excel or Google Sheets are way more powerful than people think once you get into pivot tables and stuff. Tableau's pretty slick for visualizations if you want something that looks more professional. Power BI works well too, especially if you're already using Microsoft everything. There are simpler options like Klipfolio or Airtable that don't require a learning curve. My take? Don't overthink it initially. You can always upgrade later when you figure out what features you actually need versus what sounds cool.
So I'd say check them monthly if you can swing it - quarterly at the bare minimum. Student stuff changes fast and I've literally watched schools get blindsided because they waited too long to look at the data. The actual KPIs themselves? Update those yearly or when you make big program changes. Your metrics have to grow with what you're actually trying to achieve. Oh, and definitely set those calendar reminders or you'll forget (speaking from experience here). Monthly feels like a lot at first but it's worth it. Just start with whatever your team can realistically handle.
So for tracking teacher performance, I'd focus on student test scores and engagement rates first - those tell you the most. Lesson completion is solid too. Oh, and definitely track how often teachers do professional development because the good ones never stop learning, you know? Parent communication frequency matters more than people think. Student feedback scores are clutch. Don't try tracking everything though - pick like 3-4 metrics that actually match what your school cares about. Mix the hard data with actual classroom observations. Way less overwhelming that way.
Honestly, these trackers are game-changers for budget decisions. Instead of guessing where to spend money, you'll actually see which programs work and which ones are total duds. Think of it like a dashboard showing exactly where your dollars make the biggest difference. Spot problems early too - maybe some schools desperately need more staff while others are doing fine. When you need to argue for more funding, you've got solid numbers backing you up. Plus you can finally move money away from stuff that's clearly not working. Way better than the old "cross your fingers and hope" approach most districts still use.
Honestly, pulse surveys work great for this - just quick weekly check-ins or anonymous suggestion boxes. Course evaluations are obvious but try focus groups too. Exit interviews can be goldmines if you actually dig into why students left. Map all that feedback directly to your KPIs like retention rates or how well support services are doing. I'd set up some automated loops so you're not panicking when it's time to report (been there). Real-time feedback tools are clutch. Start with maybe one method and expand from there - don't overwhelm yourself trying to do everything at once.
Yeah, socio-economic stuff totally messes with your KPI data. Kids from low-income families usually have lower test scores and miss more school - and that's not really about teaching quality, you know? Technology access is another big one that throws off your metrics. What I'd do is break down your data by demographics first. That way you can actually see what's a school issue versus what's just... life being unfair, honestly. Then you're not setting impossible targets or wasting time fixing the wrong problems. It's frustrating but you gotta work with reality.
Don't track everything at once - seriously, you'll go insane trying to make sense of it all. Stick to maybe 3-5 metrics that actually matter. Skip the vanity stuff like total views and focus on completion rates instead. I've watched teams waste forever building these fancy dashboards that just sit there unused because they're way too complicated. Make sure whatever you're measuring is something teachers can actually do something about. Oh, and start basic - you can always add more tracking later once everyone's used to checking the data regularly.
Honestly, just map those accreditation standards straight to your KPIs and track them year-round. Way better than that last-minute panic we all know too well. Focus on the stuff they actually care about - retention rates, faculty creds, graduation numbers, assessment data. The tracker catches problems early and shows trends, which makes those self-study reports way less painful. Set up alerts when anything drops below thresholds so you can fix it before it's actually broken. Oh, and the automated compliance reports are kind of a lifesaver too.
Think of educational KPIs like a GPS for your curriculum - they'll show you what's working and what's totally bombing. You can catch patterns early, like kids consistently struggling with fractions or reading scores tanking after switching textbooks. Honestly, the data can be pretty surprising sometimes. Instead of just winging it, you get to make targeted fixes based on actual evidence. Oh, and definitely set up regular reviews with your curriculum team - way better than crossing your fingers and hoping things improve on their own.
-
Extensive range of templates! Highly impressed with the quality of the designs.
-
The best and engaging collection of PPTs I’ve seen so far. Great work!