Finnish company Nokia losing ground in the mobile phone manufacturing space in the first decade of this century is a prime example of ignoring Key Performance Indicators (KPIs), leading to a complete business collapse. Decades before Nokia, we had camera filmmaker Kodak living in a self-imposed silo of not monitoring KPIs at all, and it came out only to see itself disintegrate in a wave of digital photography, which required no film at all.
The ignored KPIs should have been obvious: increasing market demand for no buttons or physical pads on phones. In the case of Kodak, one KPI was customer churn rate, and another was dropping sales. For Nokia, the KPI could also have been a decline in shipments. There are other examples of companies missing KPIs to their peril, but good businesses tend to devise KPIs of their own to understand the drift of their trade use opportunities and avoid threats.
Find the best top 40 KPIs needed for all businesses here.
For instance, where are news media corporations headed with social media, TV, and internet-based content coming to dominate the discourse? What KPIs will work for employee turnover for a content company like Netflix, a new-age wonder? Can you guess? Well, we have the answer below in one of our templates.
KPIs are critical to the success of a business, and these need to be documented well to ensure the signs are caught early (and damage control or preventive action taken). Businesses, however, face the pain point of rarely knowing how to represent these KPIs for their company and then deciding a range for each performance indicator. Good businesses seek a content-ready template where they can input their performance figures and get clear decision points with color-coded graphs. The top brass is not interested in analysis but wants to take action to take the business forward and improve all KPIs.
Warehouses are important to all businesses that involve shipments, physical storage, and trade. Get best-in-class KPIs for this business with a click here.
SlideTeam has the easiest and most innovative solution to such a problem statement as the abovementioned businesses. Our 100% editable and customizable PPT Templates are ready to use for companies, as they aim to benchmark their efforts in all fields, such as operations, finance, customer service, HR, and technology. We are the choice of businesses worldwide because we efficiently organize information for clients and help them make decisions.
Take a tour of these world-class templates now and have your pick.
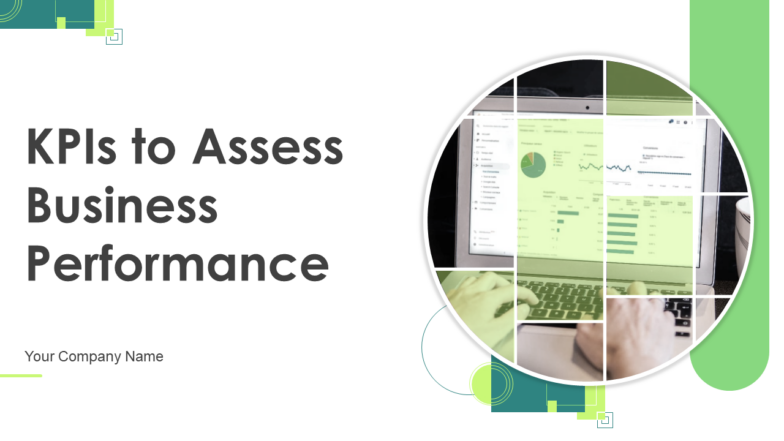
Template 1: KPIs to Assess Business Performance PPT Template
Business performance mainly includes financial profitability, employee performance, and customer satisfaction. A six-stage foundation must be laid to measure these precisely and derive meaning from taking business results. It starts with a business overview and competitive analysis, with long-term and short-term business goals appearing. The company should reduce customer churn by 20% in a quarter in the short term. In the long term, it could acquire 50% of the market share in North America. The PPT Template also provides strategies that could be used and finally answers how to measure business performance. Net profit, net sales, profit margin cash flows, and effective rate metrics are ways to measure financial performance. Use this slide to also understand employee performance measurement, with dashboards on revenue and billable cost, employee billable hours, and real-time use of employees. The complete deck now showcases customer satisfaction measurement through churn rate, customer service, customer satisfaction, and customer lifetime value. Get it now!
Download this PPT Template Now!
Template 2: Key Performance Indicator Framework
The heart of this PPT Template is the four-step process outlined to create a KPI framework for business variables or segments. The complete deck lists this process starting with awareness, engagement, conversion, and loyalty. The same four steps feed into the consumer journey, employee growth, retail business, healthcare, manufacturing, banking, IT, etc. Over 15 industries are accorded their KPI framework in this brilliant PPT Template, including a sales KPI framework. It is all quality and years of painstaking research distilled into this PPT for an industry. For instance, the retail business KPI metrics are sales, inventory, and customer. The framework then says that introducing loyalty programs for customers is an option, as is deciding on a pre-decided inventory turnover ratio. The complete deck includes this kind of analysis for all industries. Grab it now.
Download this PPT Template Now!
Template 3: Production and Manufacturing Dashboards KPI
Use this slide to ensure that there is enough ammunition and knowledge within the business to handle manufacturing bottlenecks, which have a habit of coming when least expected. The downtime-by-cause is one pie chart of significant interest as a KPI, which needs better human supervision and maintenance. The PPT Template includes a production dashboard for measuring KPIs, where the numbers to watch out for are units produced, units lost, overall plant productivity, and productivity by machine. The production rate KPI is also essential and includes defect density, rate of production, and rate of return as the numbers to watch out for in this complete deck, with valuable additional slides. Get it now.
Download this PPT Template Now!
Template 4: Cyber Security Key Performance Indicators Metrics Dashboard
Use this PPT Template to design and analyze a cyber security health status dashboard for KPI division monitoring. It includes audit and compliance, controls health, project status, incident response process, vulnerability patching schedule, investigation process, and training compliance. Identifying a cyber threat is necessary for cyber security divisions and tracking that well using the assigned table. The trend over time that the slide depicts adds to the practical utility of the PPT Template. Make it yours today.
Download this PPT Template Now!
Template 5: Staff Turnover Key Performance Indicators Dashboard
Which position sees the maximum turnover in your business? Knowing the answer to the question and many others is critical to understanding the master key to retaining staff. This PPT Template gives you KPIs for measuring how well you retain talent. It includes employee turnover (the absolute number), the turnover rate, average tenure, turnover per quarter, turnover per department, turnover type, turnover timeframe, turnover per position, and turnover reasons. The idea is to work to minimize these KPIs and save on resources, as new hiring is always an expensive proposition. Download this template.
Download this PPT Template Now!
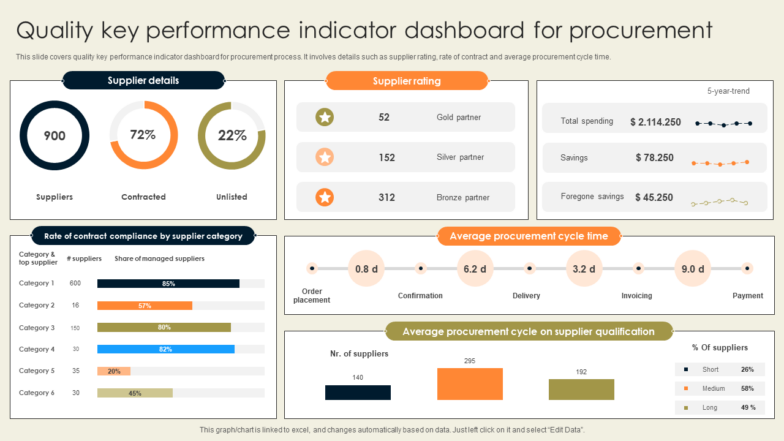
Template 6: Quality key performance indicator dashboard for procurement
You can optimize every procurement process procedure within your company with the help of this PPT Template. This template depicts a dashboard for the procurement process, where the quality of the procured material is of utmost importance. It involves details such as supplier rating, rate of contract compliance by the contractor, and the average procurement cycle time. This dashboard ensures quality, as the company categorizes buyers by quality. Get it now!
Download this PPT Template Now!
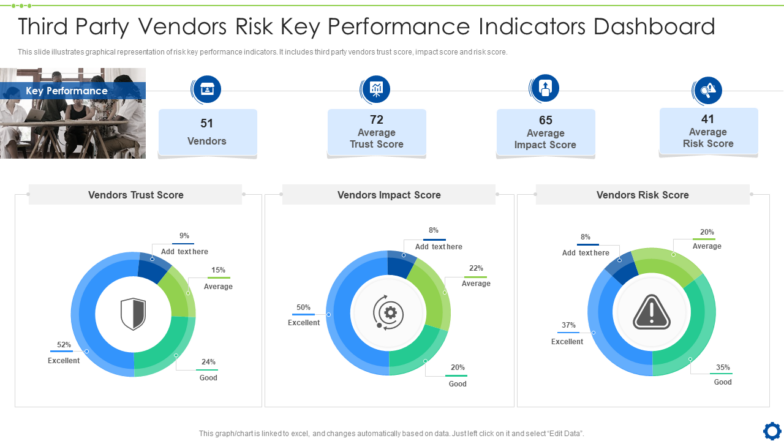
Template 7: Third-Party Vendors’ Risk Key Performance Indicators Dashboard
There will always be third parties that vendors will be dealing with for their procurement needs. This PPT Template provides a framework for assessing these vendors on KPIs such as vendors’ trust, impact, and risk scores. The method is to assign an average score based on peer review and your own experience and then create bunches of vendors on each variable. The categorization is done as average, excellent, sound, and poor and do so, download this template!
Download this PPT Template Now!
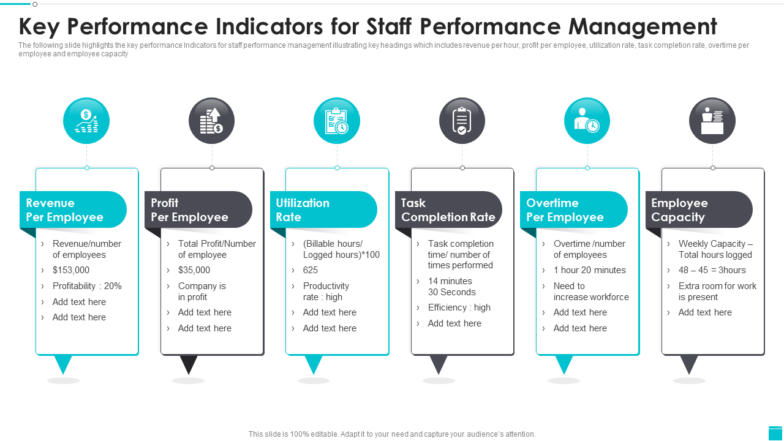
Template 8: Key Performance Indicators for Staff Performance Management
This important PPT Template that is a must-have for all businesses includes six KPIs that staff performance measurement uses. These are illustrated as key headings on the slide: revenue per hour, profit per employee, utilization rate, task completion rate, overtime per employee, and employee capacity. Each of these is also linked to hands-on actual indicators. For example, in terms of task completion rate, an efficient employee could be deemed to finish a task in 30 minutes. Hence, a minimum bar is set, with something for employees to stay motivated. Grab this template now!
Download this PPT Template Now!
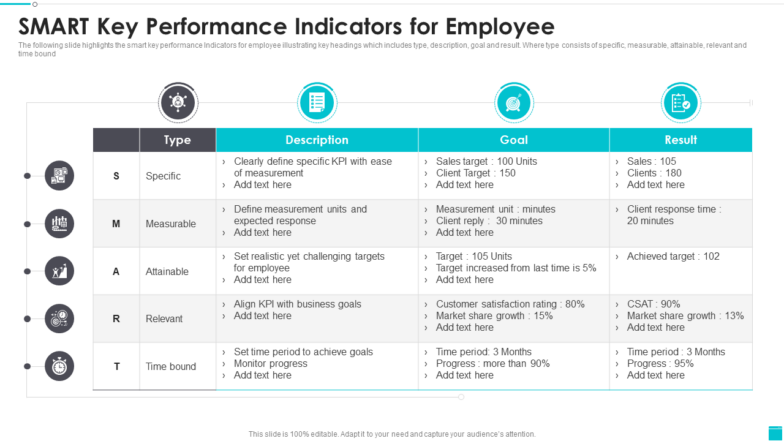
Template 9: SMART Key Performance Indicators for Employees
An effective technique such as this SMART KPIs are necessary to streamline an organization’s capability to assess the performance of its employees. This one-of-a-kind PPT Template will help you get better business results and efficiency from staff. With smart standing for specific, measurable, attainable, relevant, and time-bound, each goal and its description are matched together for specific, optimum results. Use KPIs enumerated in this presentation template to evaluate your employees on exact parameters, such as sales target and customer satisfaction rating.
Download this PPT Template Now!
Template 10: Sales Onboarding Key Performance Indicators PPT Template
KPIs are essential and can be refined for optimum use when you know the deviations from them and the cause of these. This PPT Template fully does that in the critical domain of sales onboarding, where the bucks lie. The template depicts sales discovery meetings, meetings set, and coaching and mentoring sessions. The impact or the result of such KPIs is reflected in sales onboarding in terms of providing accurate time and cost estimates, making reps comfortable, and speeding up the sales drive. The target and actual columns reflect the importance of sales to any business. The deviation is tracked and is considered a clear indication of performance. Get this template from the link below.
Download this PPT Template Now!
BUSINESS PERFORMANCE IS RELATIVE
Somebody’s baseball shot that crosses the field can be performance, while another player’s home run might fall short of standards. What Apple may consider ordinary could be a dream quality for another phone maker. Hence, business performance is relative, but the variables used are standard to all playing the game. For instance, sales is a KPI for all businesses, whether in thousands of dollars or billions. Customer retention is another KPI, as is customer lifetime value. Both, though, have varying absolute values and standards compared to percentages. Download SlideTeam Templates always to be suitable for your KPI strategy and understand the rationale of it as well.
PS KPIs in the HR department are what make everybody aware and willing to engage. Get a sense of what HR KPIs will ensure your business performs a cut above the rest.


 Customer Reviews

