There are numbers that represent your performance, from the execution of a given project to the entire business. These figures show the direction you are taking and help you stay on track. Welcome to the world of Key Performance Indicators (KPIs). For example, a hiring manager always has to be mindful of the acceptance ratio, which is a reflection of how hard or easy it is to get into his/her organization. Along similar lines, SlideTeam has created the 10 best KPI Templates to help you gauge and represent your progress.
Let us delve deeper into the recruitment process to illustrate KPIs. An overwhelming amount of data must be recorded to compete with the best in the industry. These include the number of applicants, diversity hiring metrics, source of hire, acceptance ratio, and more. With each additional KPI, you can paint a more comprehensive picture of the hiring process to your management and showcase your expertise in recruitment. Each number also provides insight into areas for improvement that could optimize the process further, whether to reduce cost-per-hire or to increase the offer acceptance rate.
Do you wish to measure and deliver a detailed report on how your social media is doing? Then, click here to access our blog, replete with PPT Templates.
It can be any goal you wish to reach, be it starting a new business, improving customer satisfaction, controlling the budget, meeting deadlines, etc. These objectives can be achieved with a download of the slides presented in this blog.
KPI PowerPoint Layouts to Track Performance
SlideTeam’s powerpoint templates are unique as they are all content-ready and 100% editable. This means you get readymade designs that act as a starting point, provide you with a solid framework, and save you a lot of time and energy spent researching the topic. They also provide complete flexibility to alter the slides to your needs.
Turning the company brand into a household name is a tough task. Take the help of our readymade templates to do this, available in this blog here!
These templates contain the visual elements that make a presentation hold the audience's attention. These are graphs, charts, tables, and more on dashboard frameworks, which makes it easier for stakeholders to follow and understand what the numbers mean.
Let us look at our curated collection of KPI Templates to help you measure what matters!
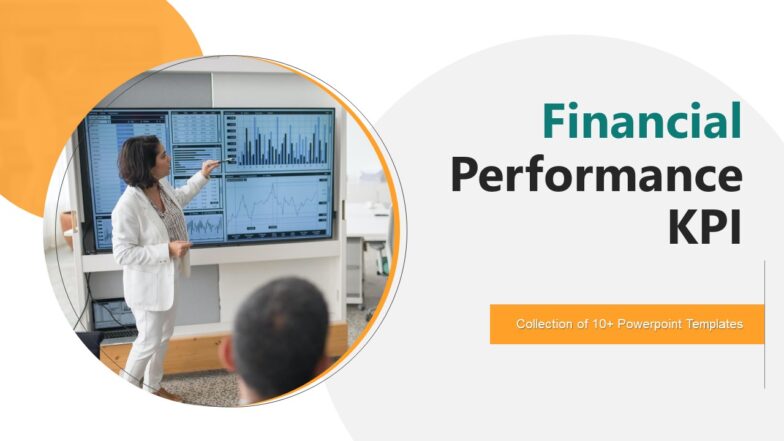
Template 1: Financial Performance KPI Powerpoint Template Bundles
This PPT Deck delivers everything we promised. This 17-slide set showcases data on yearly financial performance, liquidity and turnover ratios, comparative analysis of two firms, accounting, and more. Learn how stable the company is with the liquidity, with its current and quick ratio, and the efficacy of resource allocation with the turnover ratio. Download this template bundle from the link below to walk your audience through the financial health of the company.
Template 2: Project Issue Tracking KPI Dashboard
Keeping an accurate and precise record of the troubles the project faces is not only the path to solving them immediately, but it also prevents these errors from arising in the future. Showcase a detailed analysis of the project issues with this dashboard template. Present data on KPIs such as issues by assignee and status, issue status (under review, closed, etc.), issues created and closed, issues by priority, etc. Grab this slide to implement continuous improvement to optimize your business operations with each project.
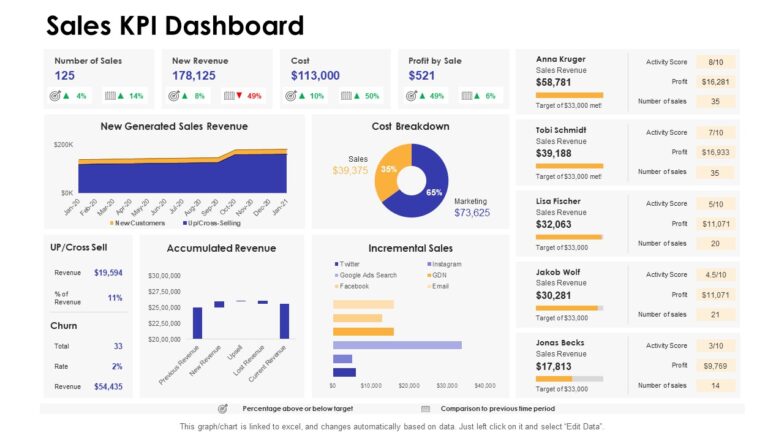
Template 3: Sales KPI Dashboard by Function
For the company, it is all about the sales numbers, and this PPT Slide ensures you present a proper presentation. This PPT Layout enables you to present data on critical KPIs such as number of sales, net revenue, cost breakdown, profit by sale, incremental sales, etc. Details on the churn rate and cross-selling are also available within the dashboard. Get this PPT Theme now to focus on areas that need improvement to increase sales and, thereby, revenue and profit.
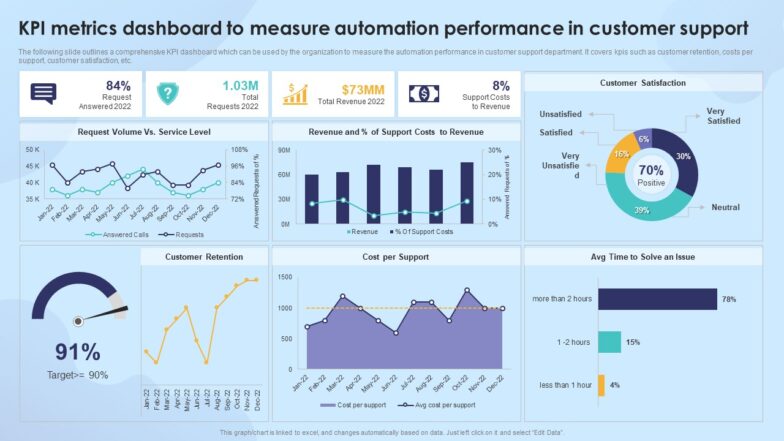
Template 4: Strengthening Process Improvement KPI Metrics Dashboard To Measure Automation Performance
Process automation is the future, but it still needs a manual check-in to ensure that the process is moving in the right direction and operations are producing the desired. Expected results. This PPT Set assumes an example of customer support and provides data to the audience on parameters such as customer satisfaction, requests received, and answered, and the service level provided, etc. This template will aid you in reducing support costs as a percentage of revenue. Download this template now to present the operational and financial aspects of automation in any process.
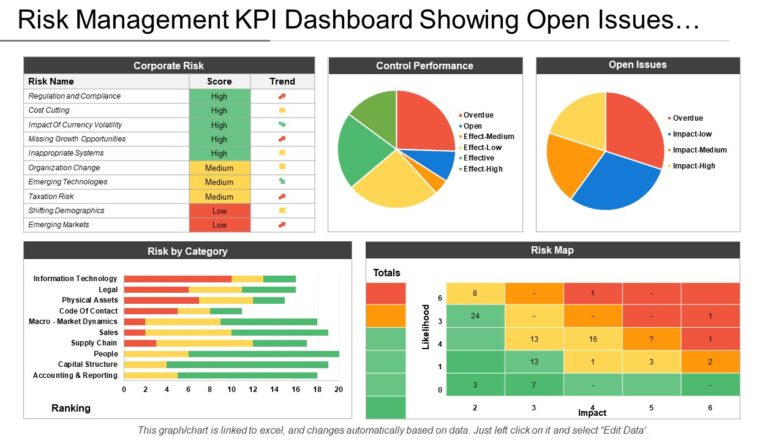
Template 5: Risk Management KPI Dashboard Showing Open Issues And Control Performance
Controlled risks are what make a company grow, and this template presents the details of the risks worth taking. Deliver KPIs on risk management such as corporate risks (cost cutting, taxation risk, emerging markets, etc.) and the associated score (low, medium, and high risk). Showcase how effective your risk management is through the control performance, along with the open issues. A risk map presents a gradient to the likelihood and impact of a given risk to the company. Download this template now to take measured risks to move the business forward.
Template 6: Project Status KPI Dashboard Snapshot Showing Delivery Roadmap and Resource Allocation
This PPT Slide delivers a status report on the project. Present important details such as the project delivery roadmap and the project health card to keep track of the risks, schedule, budget, etc. Also added are the funding, portfolio risks, and resource allocation for each task within the project. The tasks are intuitively color-coded for ease of reference. Download this PPT Template to present a quick overview of how far along the project is.
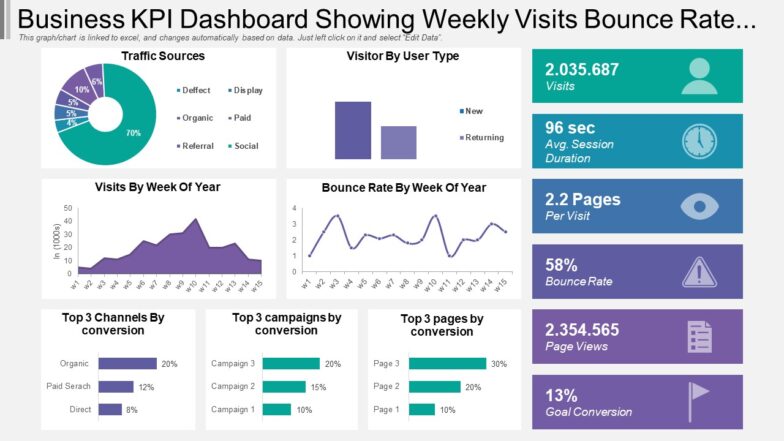
Template 7: Business KPI Dashboard Snapshot Showing Weekly Visits Bounce Rate And Traffic Source
Your sales through online/e-commerce platforms are dependent on the traffic your website gets. Ensure that you make all the right decisions to boost visitors to your site with this dashboard. Measure and deliver KPIs such as traffic sources, user types, visits by week of the year, top channels based on conversion (organic, paid search, and direct), average session duration, and more. Grab this layout to understand the changes you must make to boost the parameters you are unhappy with.
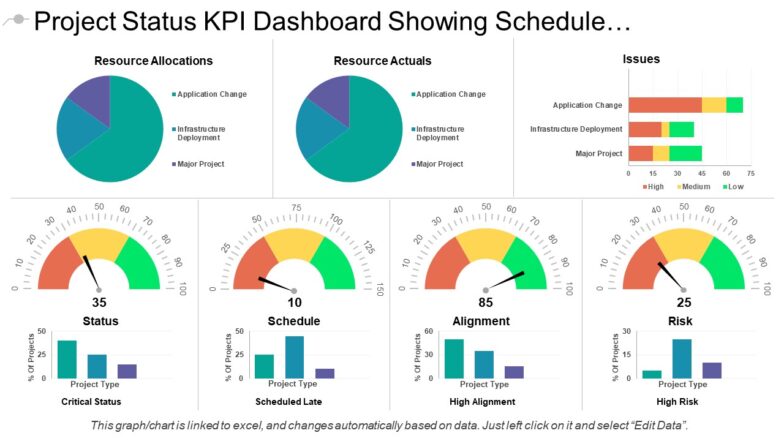
Template 8: Project Status KPI Dashboard Showing Schedule And Alignment
Pie charts and histograms are the co-stars in this informative PPT Dashboard. This slide presents information on the task schedule and resource allocation status for the project. This includes resource allocations vs actuals, the issues noted, etc. It also notes the degree of alignment with desired results and the associated risks. Download this template from the link below.
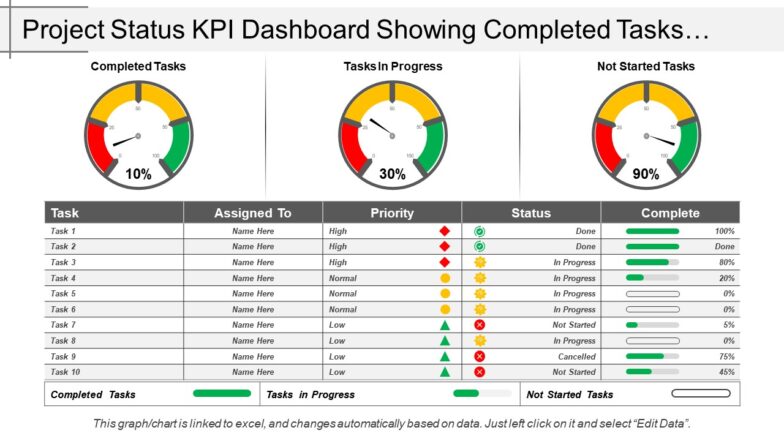
Template 9: Project Status KPI Dashboard Snapshot Showing Completed Tasks And Task In Progress
One of our more simpler designs, this PPT Layout presents a table to keep a list of the tasks within a project and their status as ‘completed,” “in progress.’ and “not yet started.” The table helps you deliver other KPIs, such as the priority, person assigned to it, status, and percentage completed. Download this template to present an easy reference for the tasks underway at a given moment.
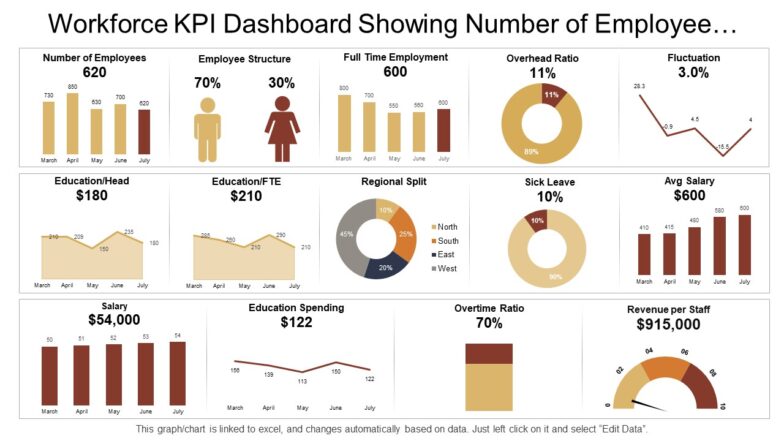
Template 10: Workforce KPI Dashboard Showing Number of Employee Overhead Ratio and Salary
This PPT Dashboard acts as an excellent reference to showcase an internal “about us” for the company. It presents KPIs related to the business, such as the number of employees, gender division in the workforce, full-time vs part-time employees, salary, revenue per staff, and more. This slide is an excellent tool to make data-driven decisions regarding the recruitment and finances of the enterprise. Download it now.
KPI Templates: Your Blueprint for Measuring Success
KPIs present an undeniable insight into each business benchmark that announces whether it is a success or a failure. With the right KPIs in the templates presented in this blog, you can keep the work on track and meet and achieve all the deadlines, constraints, and milestones the management expects to reach. Our templates are just a click away, so go ahead!
Access these slides with a single click and streamline your onboarding process more. You can choose one of our subscription services: monthly, semi-annual, annual, annual+ with a click here.
P.S. The templates in this blog are not ranked in any particular order. Pick the one(s) you like and download it!


 Customer Reviews

