


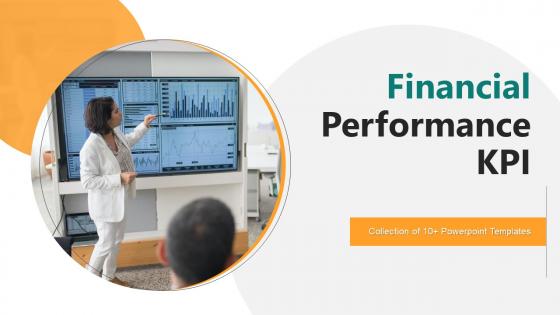
Financial Performance KPI Powerpoint Ppt Template Bundles




Try Before you Buy Download Free Sample Product
 Impress Your
 Audience
 100%
100% Editable
 Save Hours
 of Time


Our Financial Performance KPI Powerpoint Ppt Template Bundles are topically designed to provide an attractive backdrop to any subject. Use them to look like a presentation pro.
People who downloaded this PowerPoint presentation also viewed the following :
Financial Performance KPI Powerpoint Ppt Template Bundles with all 17 slides:
Use our Financial Performance KPI Powerpoint Ppt Template Bundles to effectively help you save your valuable time. They are readymade to fit into any presentation structure.
-

Financial Performance KPI
-
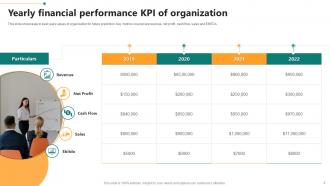
Yearly financial performance KPI of organization
-
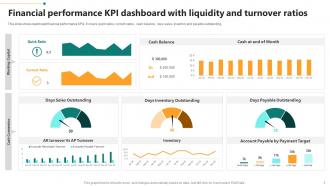
Financial performance KPI dashboard with liquidity and turnover ratios
-
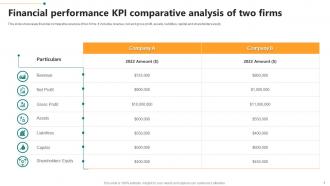
Financial performance KPI comparative analysis of two firms
-
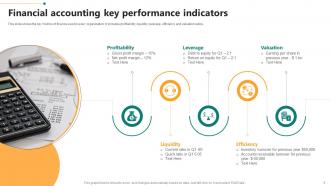
Financial accounting key performance indicators
-
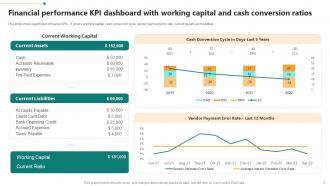
Financial performance KPI dashboard with working capital and cash conversion ratios
-
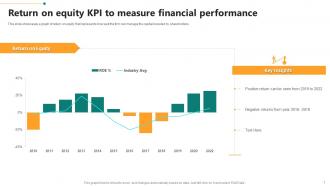
Return on equity KPI to measure financial performance
-
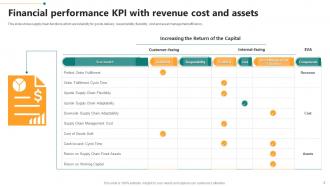
Financial performance KPI with revenue cost and assets
-
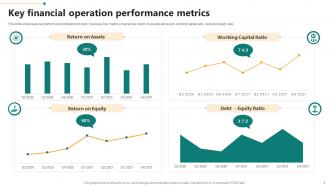
Key financial operation performance metrics
-
Financial performance KPI icon with arrow and dollar sign
-
Financial performance KPI cash balance icon
-

Thank You
-

-

-

-

-

FAQs for Financial Performance KPI Powerpoint
Okay so definitely track cash flow first - that's the killer right there. I've watched businesses that were actually making money still crash because they couldn't pay bills. Gross profit margin tells you if you're pricing things right, and customer acquisition cost shows whether your marketing's actually working or just burning cash. Oh and current ratio too (current assets divided by current liabilities) - boring but useful for knowing you can cover expenses. Track these monthly and you'll catch issues early instead of scrambling later.
Okay so you need both liquidity and profitability ratios to actually understand what's going on with your finances. Profitability tells you if you're making money, but liquidity shows whether you can pay your bills right now. I've seen companies that looked super profitable on paper but couldn't cover their short-term debts - that's how businesses go under even when they're "successful." Your current ratio and quick ratio will show if you've got enough cash-like assets for immediate stuff. ROI and profit margins are great for the big picture. But honestly? Cash flow issues kill more businesses than lack of profit does. Always check both when you're doing any financial review.
Net profit margin is basically how much money a company actually keeps after paying for everything - divide net income by total revenue and boom, you've got it. Higher numbers mean they're better at controlling costs and can charge good prices. I always look at trends over several quarters instead of getting hung up on one bad month (companies have off periods, whatever). You can also compare it to competitors to see who's actually crushing it in their industry. It's honestly one of the best ways to tell if management knows what they're doing with turning sales into real profit.
Start with IBISWorld or Bloomberg - they've got the best benchmark data for your industry. Trade associations are solid too. Grab the basics: gross margin, EBITDA, working capital ratios from similar-sized companies. Here's the thing though - getting true apples-to-apples is harder than you'd think since everyone does their accounting differently. Don't go crazy trying to benchmark everything. Pick 3-5 key metrics and actually stick with them. Trends matter way more than one-time snapshots. I'd set up quarterly check-ins to see if you're gaining ground or getting left behind.
So basically, lagging KPIs are backwards-looking stuff - revenue, profit margins, last quarter's ROI. Leading KPIs predict what's about to happen, like your sales pipeline or customer acquisition costs. Here's the thing though - most teams get obsessed with the backwards stuff because it's concrete and easy to track. But honestly? That's kinda like driving by staring at your rearview mirror the whole time. Leading indicators are where the real magic happens. They give you time to actually fix things before your numbers tank. You need both on your dashboard, but don't sleep on the forward-looking ones.
So cash flow forecasts are basically your financial crystal ball - you can see exactly when money's flowing in and out over the next few months. Super helpful for catching cash crunches before they wreck you. I'd start with a simple 13-week rolling forecast (honestly changed my whole approach to planning). You'll spot when you can actually afford that big purchase instead of just hoping. Plus no more scrambling to pay vendors late - so awkward. The best part? You can set realistic targets for other metrics since you know what you're actually working with. Total game changer.
ROI is your financial reality check - shows how much profit you're making per dollar invested. Just divide net profit by total investment cost, then multiply by 100. Super simple but honestly one of the best metrics out there. The cool thing? You can compare totally different investments on equal ground, whether it's a $500 software tool or a $50k project. I use it all the time to figure out budget priorities and - this part's key - it makes justifying expenses to your boss way easier. Learned that one the hard way lol.
Oh totally - KPIs are super industry-specific. Like SaaS companies are obsessed with monthly recurring revenue and churn rates, but if you're in retail? You're tracking inventory turnover and same-store sales instead. Manufacturing is all about asset utilization and cost per unit. Healthcare's completely different - they care about patient volume and reimbursement rates. Honestly, I think most companies just copy what others are doing without thinking it through. You really need to figure out what actually drives profit in your space, then pick maybe 3-5 KPIs that matter for your specific business model.
Honestly, keep it super simple - stick to like 6-8 KPIs max or people just zone out. Put your biggest numbers (revenue, profit margins) right at the top where they can't miss them. Those little trend arrows are clutch, and definitely compare stuff to last month or your targets. Color coding helps but don't go nuts - green good, red bad, done. I always think about whether someone could walk by and instantly get what's happening. Your executives are probably looking at this during their coffee Monday morning, so it's gotta be dead obvious what needs attention and what doesn't.
Pick 3-5 financial KPIs that actually matter for your business - revenue growth, profit margins, cash flow, that stuff. Monthly reviews help you catch problems early instead of scrambling later. ROI and customer acquisition costs are gold for figuring out what's working vs what's just burning money. Honestly, I've watched way too many businesses get obsessed with metrics that look impressive but don't actually drive growth. The trick is making sure your KPI targets line up with where you want to be in like 2-3 years. Then you can adjust course before things get messy.
Honestly, there's a bunch of ways to do this. Power BI and Tableau are solid if you want dashboards that pull data automatically - saves you tons of time. Excel still works great too, though I feel like people overcomplicate things with it sometimes. QuickBooks or Xero can spit out real-time KPI reports if you're already using them for accounting. Google Analytics handles the web metrics side pretty well. The main thing is don't pick something that'll have you typing in numbers manually all day. That gets old fast. Just start with whatever system you've got now and add on from there.
Yeah, external stuff totally changes how you should read your KPIs. Like during a recession, your revenue might tank even if you're crushing it compared to competitors - the whole market's just screwed. Inflation messes with profit margins too, obviously. What I'd do is track industry benchmarks next to your own numbers. That way you can tell if you're actually sucking or if everyone's dealing with the same economic garbage. Makes way more sense than staring at your metrics in a vacuum and panicking, you know?
Think of operating margin as your best early warning system for spotting financial trouble. It tells you how well you're turning revenue into actual profit after paying for operations. When it goes up? You're getting better at controlling costs or your pricing is on point. When it drops, that's usually a red flag that bigger problems are coming. Honestly, I've seen too many businesses ignore this metric until it's too late. A steady or growing margin almost always means your company's doing well overall. Just track it monthly with your other important numbers.
Honestly, just start sharing your financial numbers regularly - but make them actually readable, not some crazy spreadsheet dump. Build simple dashboards showing revenue growth, profit margins, cash flow stuff. Monthly updates work great. Here's the thing though - different people care about different metrics. Investors obsess over growth, employees just want to know the company's not dying, customers need that stability vibe. Oh and don't just blast numbers at them. Explain what it all means! Make it conversational too. Ask what they'd actually find useful to see.
Focus on three things: data quality, standardized processes, and regular checks. Automate data collection when you can - cuts down on human error big time. Make sure everyone defines KPIs the same way (we had like three different ways to calculate customer acquisition cost and it was a mess). Monthly reconciliation catches problems early. Document everything so new people aren't totally lost. Oh, and actually compare your KPIs to real business results regularly. Sometimes the numbers look great but revenue's still tanking, you know?
-
They had the topic I was looking for in a readymade presentation…helped me meet my deadline.
-
“I've always gotten excellent slides from them and the customer service is up to the mark.”