All efforts businesses make are geared towards creating customer conversions, and getting them to pay for your product or service. It is, thus, important for enterprises to have a mechanism to track what actually brings in that action, and second to be able to track the variables that govern conversions.
It is actually a science to do this, which is made much easier by the use of conversion metrics. These are indicators that tell us which of the work of the business has actually delivered towards creating that valuable conversion for the organization.
The success of any business depends on tracking and measuring progress. As a marketer or business manager, tracking the right metrics helps you diagnose problems faster and make decisions that will lead to increased profitability and growth. Click here to access top-class templates on business metrics.
We, at SlideTeam, have curated some of the best conversion metrics in use and provided you readymade templates to help you analyze your business. From traffic to average revenue order in e-commerce, we it all covered in these professionally-done presentation templates of the highest order.
The 100% customizable nature of the templates provides you with the flexibility to edit your presentations. The content-ready slides give you the much-needed structure.
Let's explore these templates now.
Template 1: Social Media KPI Dashboard Showing Conversions by Social Network and Metrics
This PPT Layout color codes the five major social media platforms and then provides you clearly articulated data points to assess your business performance over the 30 days. Get figures on conversions through Twitter, Facebook, Google+, Blogs and YouTube in a bar graph for easy comparison. For each of these mediums, display conversion rates, amplification, and applause rates as well. Facebook gets special treatment in this template, but the customization feature means you can highlight the one social media network that means the most to you.
Template 2: Funnel-based Conversion Metrics PPT Icon Graphics
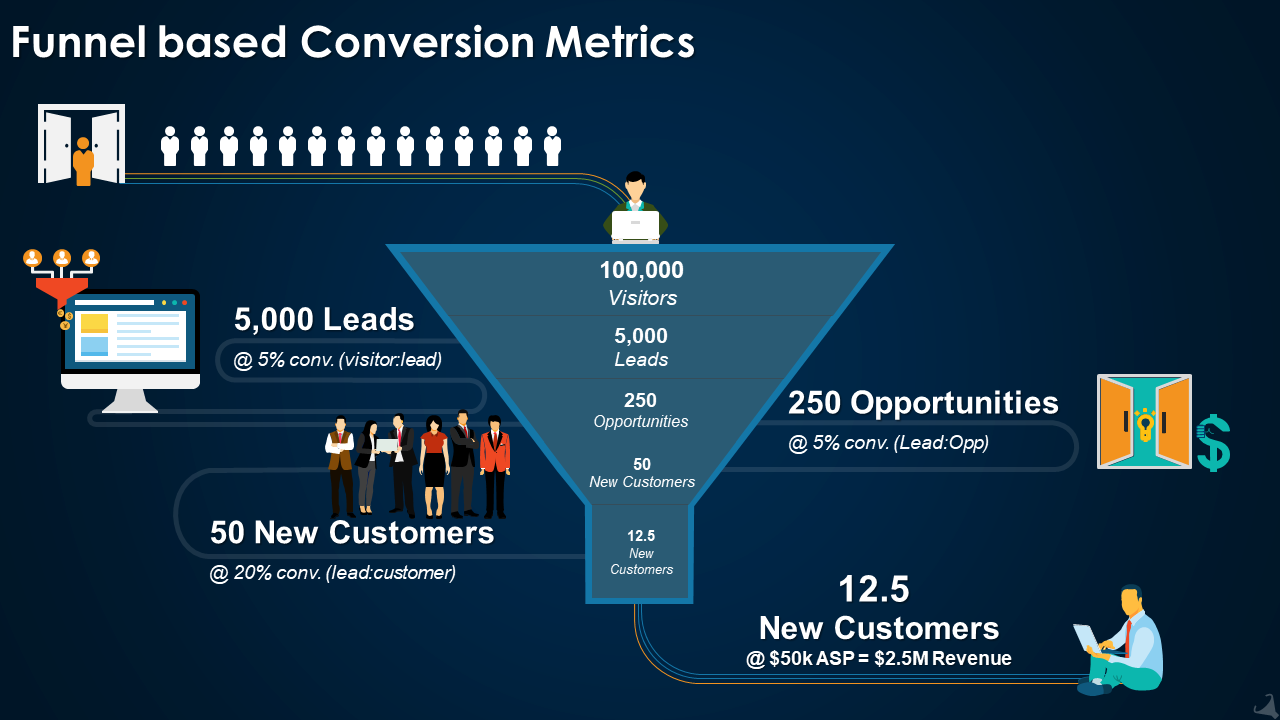
Use this design and the logic of online conversions to depict this ideal PPT Template on showcasing your expertise in generating and measuring conversion metrics that result from a customer's journey with your products and services. The example, as illustrated below, showcases how 100,000 visitors, if converted into 5,000 Leads, gives you a 5% conversion rate of visitors to leads, which is extraordinary. Then, another 5% conversion here means 250 opportunities. Then, a 20% conversion rate metrics here means 50 new customers. Then, if 25% of these customers opt for your best plans, products or services. You have revenue coming in at 12.5 times your base price for the most profitable business value offering.
Template 3: Digital Marketing Summary Dashboard Conversion Metrics PPT PowerPoint Slides
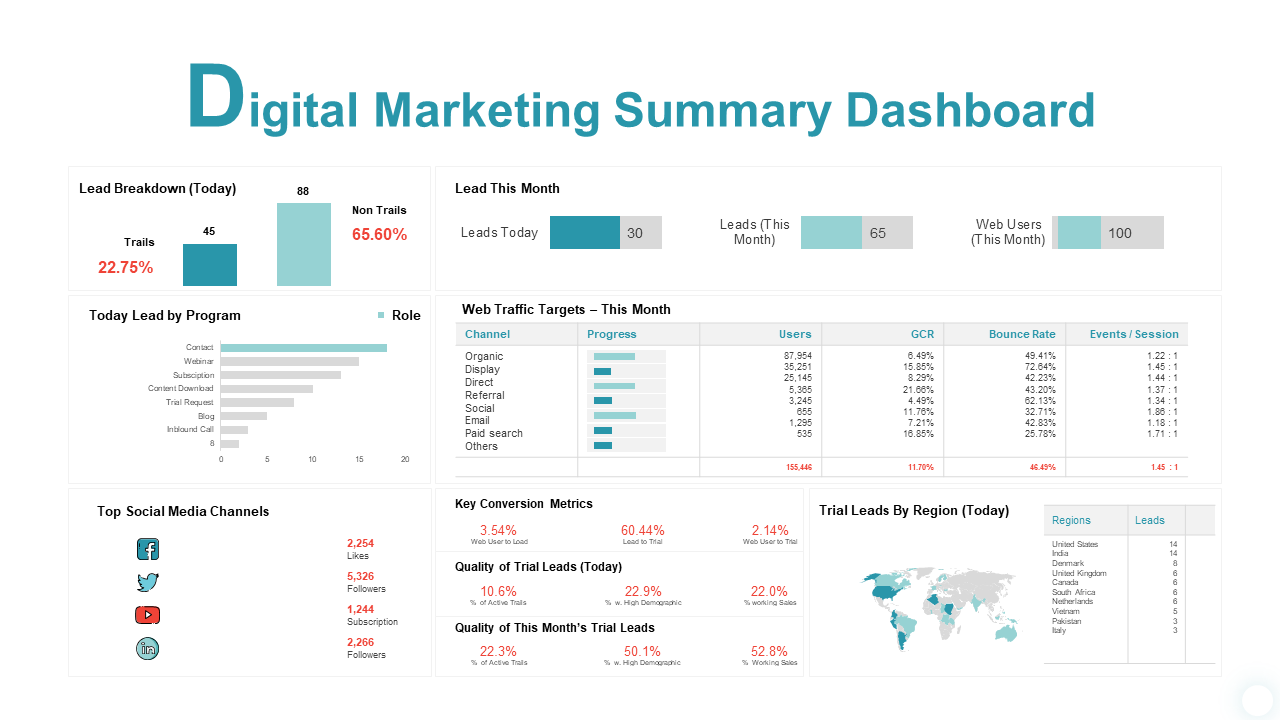
Get your lead breakdown figures in real-time (Today), the leads this month, the web users this month in this presentation template that also goes into top social media channels for conversion metrics. In the really valuable metric, the total lead by program visual gives you clear indication of what are your strength areas in selling. The trial leads by region (with the map included) really gives you the world at your fingertips. Have it as part of your personal business library to win clients with plan.
Template 4: Metrics for Conducting Marketing Audit, including Conversions and Leads
Audit is a business necessity and a critical component of ensuring order prevails. Use this presentation template to impress upon your clients the importance of a marketing Audit and how it helps improve your conversions and leads. The five major canons that guide an audit are also given. These are brand reputation, marketing potential, conversions and leads, lead nurturing and customer engagement. The end valuable question this slide answers for your clients is how engaged are customers with your brand? Download now to create that impact and recall value.
Template 5: Ecommerce Management KPI Metrics for Businesses
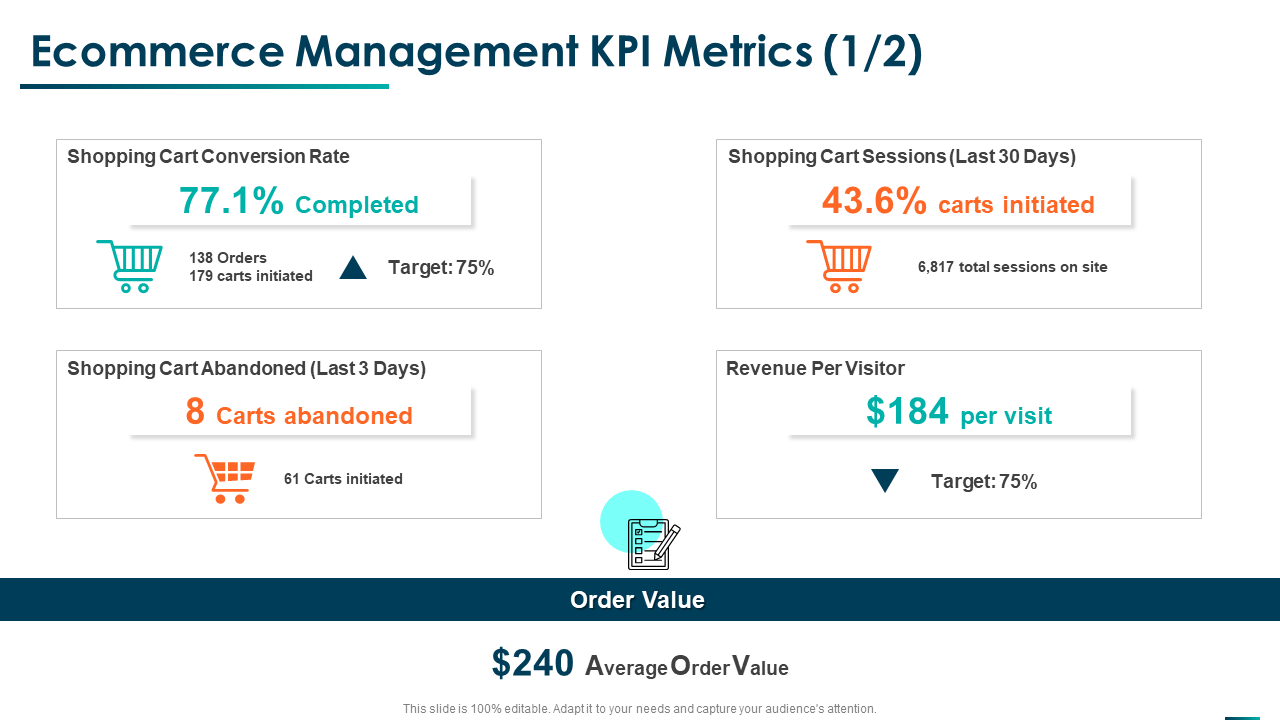
With five critically important KPI Metrics highlighted for e-commerce businesses, this presentation template is the go-to-solution for all your needs related to the KPI Metrics of your trade. Starting with order value, the PPT Template gives you shopping cart conversion rate, the shopping cart abandoned etc. The key Metrics of revenue per visitor is also highlighted, as is the figure on what percentage of value is it.
Template 6: SaaS Metrics Dashboard Illustrating Conversion and Churn Rate
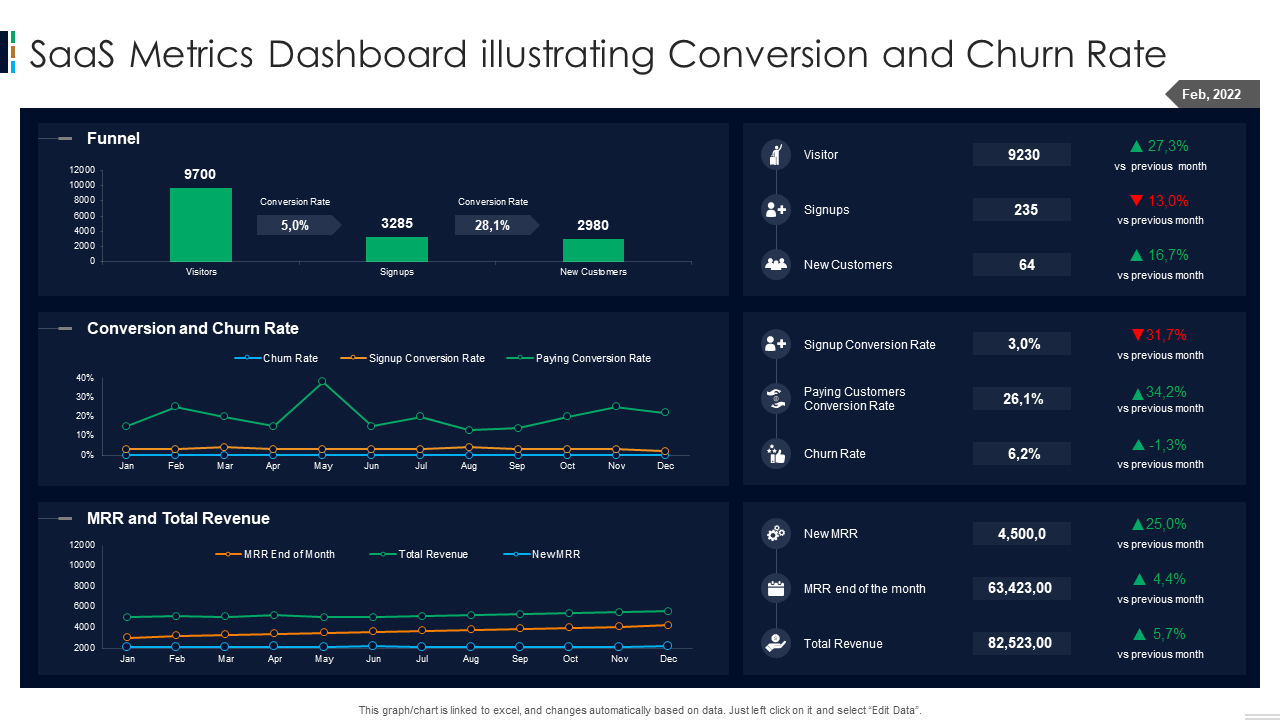
This comprehensive Dashboard on conversions and churn rate illustrates how customer metrics and revenue are directly linked. On the left side of the thoughtfully-designed template, you get three major indices of funnel conversions metrics, the conversion and churn rates and MRR and total revenue displayed through color-coded line graphs. To the right are the associated customer numbers with each. Paying customers' conversion rate matters most, as is the churn and both are given adequate respect in the template.
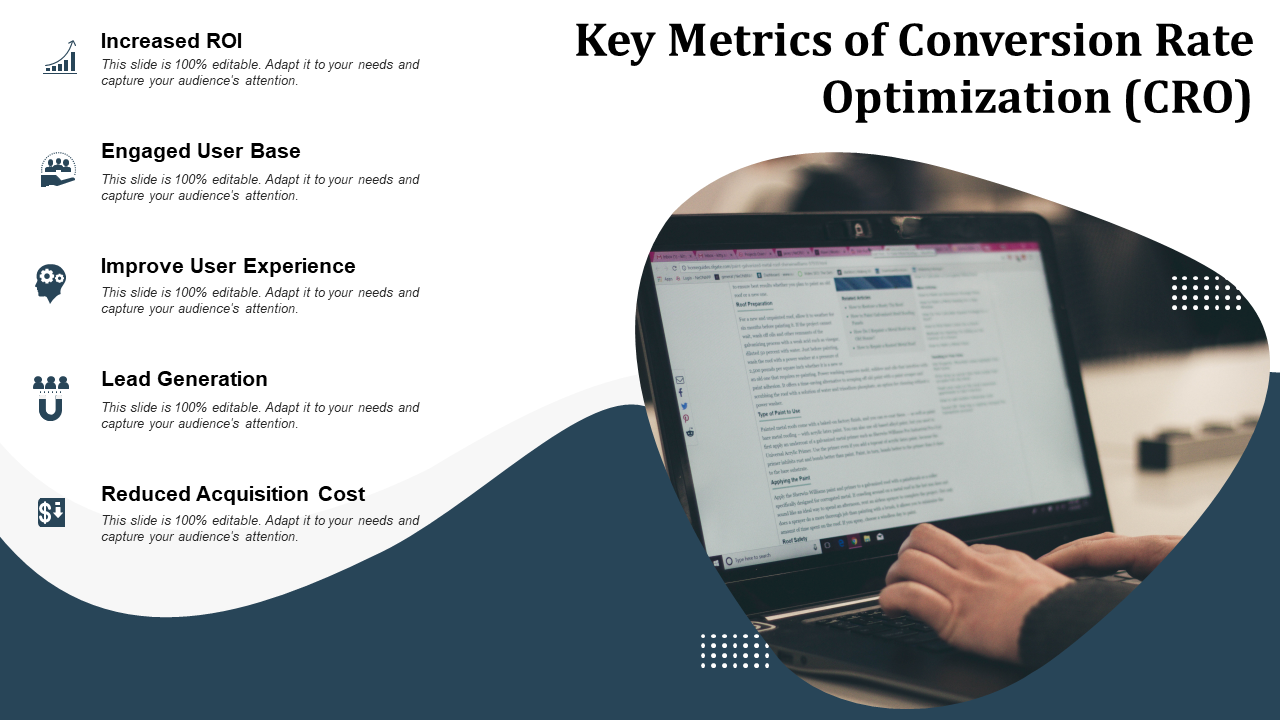
Template 7: Key Metrics of Conversion Rate Optimization
This PPT Presentation on Conversion Rate Optimization is meant to let creative juices in an organization flow toward improved conversion rates, as this are the ones directly tagged to the cash register. The increased conversion rate, is in fact, manifested in five key indicators as listed on the slide. These are increased ROI, an engaged user base, improved user experience, lead generation and reduction in acquisition cost. Once you have these metrics trending in the right direction, your job in tracking conversions metrics is broadly done. Download now to understand how key conversion metrics needs powerful presentations like this to create an impact.
THE DESTINATION IS CONVERSION
Conversion metrics is an exact science and businesses are well-advised to have it stay that way. Once there is a way to track which activity has the most chances of having the cash ring, why not do more of it, is the premise. Our best-in-class templates are the best way to operationalize the idea for businesses.
FAQs on Conversion Metrics
What are good conversion metrics?
Good conversion metrics mean that between 2% and 5% of your target audience at each stage of the marketing funnel moves on to the next step. This 5% is a significant achievement for businesses that can do it. Yet, in absolute numbers, it still represents a considerable lag in the number of customers that can be moved to the converted column for business accounting. In simple terms, if 5% of your email newsletters are getting a good response, you are in the top percentile, but in absolute numbers, there may be a sizeable number of customers that you may be missing.
What is a conversion rate KPI?
This is the one key number that indicates how you track the number of visitors to a site on social media and then use it to predict revenue (if not do this, at least be able to have a stable traffic figure). Its simple formula is conversions divided by the number of visitors, and the final answer is expressed as a percentage. It allows marketers to compare campaigns, the way one can change or tweak these around to generate a much greater number of conversions from the same kind of resource input into a marketing effort.
How do you track conversion metrics?
In mathematical terms, track conversion rates with the simple enough process of dividing the number of instances of the goal being achieved by the number of total visitors. Again, this percentage number helps you understand the ratio of revenue-generating customers to just plain visitors who don’t buy or interact financially with your businesses. The time frame you take for analyzing the conversion rate is also essential. Improving conversions means your success rate in getting the same customers to pay for your goods and services increases dramatically.




 Customer Reviews


