


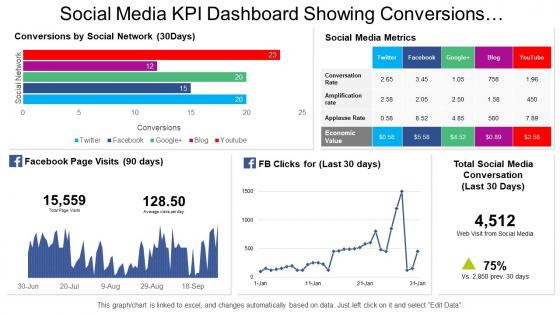
Social media kpi dashboard showing conversions by social network and metrics





Try Before you Buy Download Free Sample Product
 Impress Your
 Audience
 100%
100% Editable
 Save Hours
 of Time


Direct journalists to adhere to the code you have instituted with our Social Media Kpi Dashboard Showing Conversions By Social Network And Metrics. Instruct them on how to conform.
People who downloaded this PowerPoint presentation also viewed the following :
Social media kpi dashboard showing conversions by social network and metrics with all 6 slides:
Live your dream with Our Social Media Kpi Dashboard Showing Conversions By Social Network And Metrics. They make sure your plans come off.
FAQs for Social media kpi dashboard showing conversions by social
Honestly, start with the basics - likes, comments, shares, and how many people you're actually reaching. Those tell you if people give a damn about your content. Follower growth matters too, plus click-through rates if you're trying to drive traffic somewhere. Oh, and conversion metrics are clutch if you're selling anything. Brand mentions are cool to track but can be a pain to measure properly. Don't sleep on response times either - people expect quick replies these days. Really though, it depends what you're after. Building awareness? Driving sales? Pick like 5-7 metrics that actually matter for your goals and stick with those first.
You want to tell a story with your data, not just throw numbers around. Put your biggest wins up top - engagement, reach, conversions. Color coding helps tons (green for good stuff, red for "oh crap we need to fix this"). Show trends over time instead of boring static numbers - everyone loves a good growth curve. Group similar metrics together or it gets chaotic fast. Add quick explanations when something looks off, especially after algorithm changes mess things up. Oh, and create different views for different people - your boss cares about totally different stuff than your team does.
Honestly, Google Data Studio's probably your best bet to start - it's free and connects to most platforms pretty easily. Tableau and Power BI are more powerful if you're doing crazy data analysis stuff. Hootsuite and Sprout Social both have decent built-in dashboards too, which is nice since you're already posting from there anyway. I'd go with Data Studio first though - why pay for something when you don't have to? You can always switch later if it's not cutting it. Just pick whatever your team will actually look at regularly.
Oh man, each platform is so different! Instagram's all about those likes and saves since everything's visual. Twitter? Totally different game - retweets and replies matter way more, probably because of that annoying character limit. LinkedIn users actually want real discussions, so comments and shares beat likes there. TikTok's weird though - completion rates are huge, plus how much people share compared to views. Facebook's kind of the middle child with reactions and comment stuff. Honestly, don't even try comparing across platforms - you'll drive yourself crazy. Just set separate benchmarks for each one.
Honestly, conversion rates are what separate real results from just looking popular online. Sure, you might have tons of followers, but are they actually buying anything? Our Instagram looked great last quarter but sales were trash - total wake-up call. Focus on tracking which platforms actually make you money. Set up conversion tracking in your analytics (whatever tool you're using) and figure out what actions matter for your business. Then you'll know where to spend your time instead of guessing. Way better than chasing likes that don't pay the bills.
Dude, sentiment analysis is SO much better than just tracking mention counts. Like, seeing "500 mentions" tells you nothing - but knowing if they're good or bad? That's where it gets useful. You can catch PR disasters early, figure out which campaigns people actually like, and see if your brand reputation is getting better or worse. Oh and definitely track your competitors too because benchmarking is clutch. I learned this the hard way when we missed a crisis brewing for like three days straight. Set it up for your main keywords and you're golden.
Honestly, I'd say weekly at minimum, but daily is way better if you can manage it. Algorithm changes happen constantly and your engagement can tank without warning - I totally missed a campaign failing for like 3 weeks once because I wasn't checking often enough. Fresh data lets you spot trends early and fix things fast. Maybe set up some automated pulls so you're not manually updating everything? That gets old quick. Start weekly and bump it up if your strategy moves fast or if you're running active campaigns.
So basically, you gotta check if you're actually reaching the people who'd buy your stuff. Like, what's the point of getting tons of likes from 18-year-olds if you're selling life insurance, you know? I'd look at your analytics monthly and see if the age groups, locations, and interests match your target customers. Your engagement data should line up with your buyer personas. If it doesn't? Time to switch up your content strategy or maybe try different posting times. Oh, and some platforms just attract different crowds naturally - might need to pivot there too.
Set up time-based views in your dashboard - track engagement rates, follower growth, all that stuff across weeks and months. Look for patterns because there's usually some weird trends hiding in there. Maybe your audience goes crazy on Tuesdays or video posts just crush it compared to images. Segment everything by time periods and demographics so you can catch seasonal shifts. Oh, and automate your reports! Way better than obsessing over daily vanity metrics. I learned that one the hard way - spent way too much time refreshing follower counts instead of actually analyzing what worked.
Honestly, the worst thing you can do is cram like 15 different metrics on one screen. Total information overload. Stick to maybe 5-7 KPIs that actually matter for your goals. And please don't fall into the vanity metrics trap - I cringe every time I see someone obsessing over follower counts. Focus on engagement rates and conversions instead, that's where the real value is. Make sure it updates daily (real-time is even better). Oh, and always throw in some context like month-over-month comparisons so the numbers actually mean something. Start basic, then build from there once everyone gets comfortable.
You've gotta stop caring about likes and start tracking what actually makes money. Map your social stuff to real business results - leads, website visits, actual customers. Use UTM codes to follow people from your posts all the way through to purchase. Most people waste forever on vanity metrics that mean nothing to your bottom line (guilty of this myself tbh). Calculate cost per lead and lifetime value for each platform instead. That's how you'll prove ROI to your boss and figure out where to spend your budget. Way more useful than celebrating retweets.
Focus on CTR, CPC, conversion rate, and ROAS - those are your big four. Anything above 1% CTR is pretty solid, though it depends on which platform you're using. CPC shows what you're paying per click, conversion rate tells you how many clicks actually buy something. ROAS is honestly the most important one since it shows if you're actually making money or just burning cash. I'd check these weekly and compare to your previous numbers so you can catch problems before they get expensive. Trust me on this one.
So first, grab your baseline metrics from the past 3 months - engagement stuff like likes, comments, shares on your regular posts. Then compare that to how your UGC performs. Hashtag tracking is huge too when people use your branded tags. Honestly, the reach can get crazy when UGC really hits. Set up UTM codes if you're sending traffic from those posts to your site - you'll want conversion data. Month-over-month comparisons in your dashboard will show you the actual lift. Oh, and saves are becoming a big metric now too, don't forget those.
Pick 3-5 direct competitors and stalk them monthly (in a professional way, obviously). I use Sprout Social to track their follower growth and engagement rates - way easier than doing it manually. Posting frequency matters too. Honestly? I probably spend too much time scrolling through their feeds looking at what content performs best, but whatever works. Set up Google Alerts for their brand mentions. The hashtag thing is huge - see what they're using that you're not. Just throw everything in a basic spreadsheet so you can actually see trends over time instead of guessing.
Data storytelling basically turns your social media dashboard into something people actually want to look at. Like, instead of just throwing "engagement up 15%" at someone, you explain what caused it and why they should care. Numbers alone are boring as hell. Add annotations for big events, context around campaign launches - stuff that connects the dots between metrics. Oh, and guide people through it like you're walking them through what happened. Otherwise they're just staring at charts wondering what any of it means for next week.
-
Unique and attractive product design.
-
Unique and attractive product design.