


Social Media Key Statistics Powerpoint Presentation Slides


Try Before you Buy Download Free Sample Product
 Impress Your
 Audience
Editable
of Time


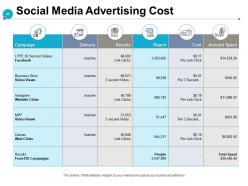
Fuel your online business strategy with the Social Media Key Statistics Powerpoint Presentation Slides. Present the various mediums undertaken for the marketing campaign such as print ads, online advertising, telemarketing, referrals, etc by utilizing content-driven social media management PPT presentation. Mention the best channels for marketing research and showcase the key statistics of social media with the help of the graph present in this PowerPoint complete deck. Display with the help of a social media roadmap slide how efficient each medium of marketing has been in the last few months. Also, develop a strategy for your social media marketing to link social media to your business goals and objectives. Discuss the steps of social media management like research and writing, publish content, social broadcast, etc. Mention the social media advertising cost using the social media key trends PPT graphics. So download our content ready social media strategy PPT Presentation to analyze online conversations.
People who downloaded this PowerPoint presentation also viewed the following :
Content of this Powerpoint Presentation
Slide 1: This slide introduces Social Media Key Statistics. State Your Company Name and begin.
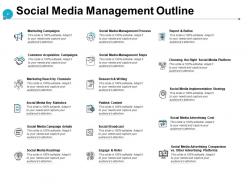
Slide 2: This slide shows Social Media Management Outline.
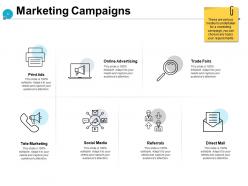
Slide 3: This slide shows Marketing Campaign mediums as- Social Media, Online Advertising, Print Ads, Direct Mail, Referrals, Trade Fairs, Tele Marketing.
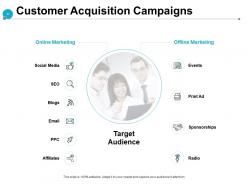
Slide 4: This slide presents Customer Acquisition Campaigns for both online and offline marketing.
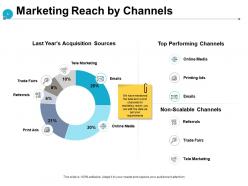
Slide 5: This slide displays Marketing Reach by Channels such as- Online Media, Emails, Printing Ads, Referrals, Trade Fairs, Tele Marketing.
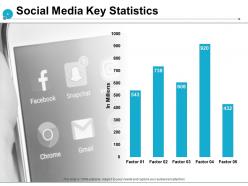
Slide 6: This slide represents Social Media Key Statistics with the help of bar graph.
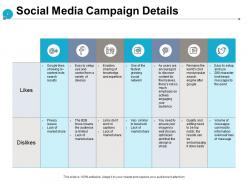
Slide 7: This slide showcases Social Media Campaign Details.
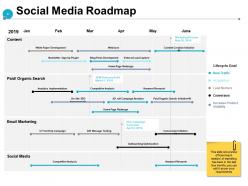
Slide 8: This slide shows Social Media Roadmap describing how each medium of marketing has been in the last few months.
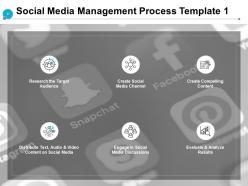
Slide 9: This slide presents Social Media Management Process Template describing- Create Social Media Channel, Create Compelling Content, Engage in Social Media Discussions, Research the Target Audience, Evaluate and Analyze Results, Distribute Text, Audio and Video Content on Social Media.
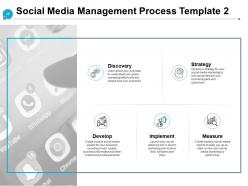
Slide 10: This is another template for Social Media Management Process describing- Discovery, Implement, Strategy, Measure, Develop.
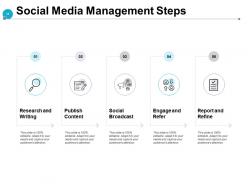
Slide 11: This slide displays Social Media Management Steps as- Research and Writing, Publish Content, Engage and Refer, Report and Refine, Social Broadcast.
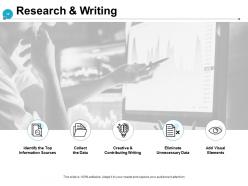
Slide 12: This slide represents Research & Writing describing- Identify the Top Information Sources, Collect the Data, Creative & Contributing Writing, Eliminate Unnecessary Data, Add Visual Elements.
Slide 13: This slide showcases Publish Content with related imagery.
Slide 14: This slide shows Social Broadcast.
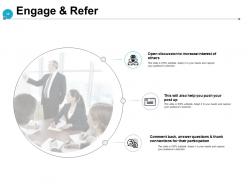
Slide 15: This slide presents Engage & Refer with related icons and imagery.
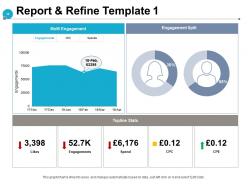
Slide 16: This slide displays Report & Refine Template 1 with the help of graphs.
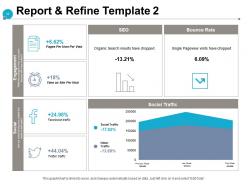
Slide 17: This slide represents Report & Refine Template 2 with SEO, bounce rate and social traffic.
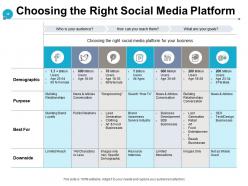
Slide 18: This slide showcases How to Choose the Right Social Media Platform.
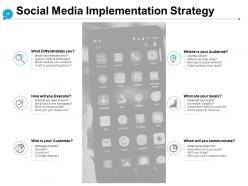
Slide 19: This slide shows Social Media Implementation Strategy.
Slide 20: This slide presents Social Media Advertising Cost in tabular form.
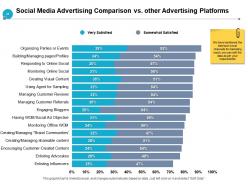
Slide 21: This slide displays Social Media Advertising Comparison vs. Other Advertising Platforms.
Slide 22: This slide reminds about 15 minutes coffee break.
Slide 23: This slide displays Social Media Key Statistics Icons.
Slide 24: This slide is titled as Additional Slides for moving forward.
Slide 25: This is a Dashboard slide with text boxes.
Slide 26: This is Our Team slide with names and designation.
Slide 27: This is a Financial slide. Show your finance related stuff here.
Slide 28: This is a Quotes slide to convey message, beliefs etc.
Slide 29: This is a Puzzle slide with text boxes to show information.
Slide 30: This is a Target slide. State your targets here.
Slide 31: This is a Silhouettes slide to show people specific information etc.
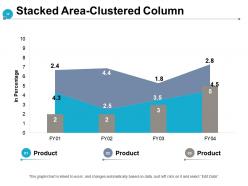
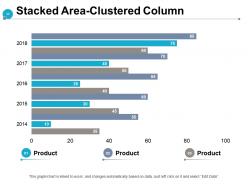
Slide 32: This slide shows Stacked Area-Clustered Column chart with three products comparison.
Slide 33: This is another slide with Stacked Area-Clustered Column chart.
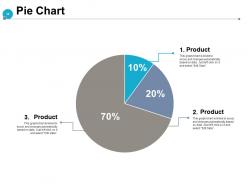
Slide 34: This slide displays Pie Chart with data in percentage.
Slide 35: This is a Thank You slide with address, contact numbers and email address.
Social Media Key Statistics Powerpoint Presentation Slides with all 35 slides:
Use our Social Media Key Statistics Powerpoint Presentation Slides to effectively help you save your valuable time. They are readymade to fit into any presentation structure.


FAQs for Social Media Key Statistics
So about 62% of people worldwide are on social media now - we're talking like 5 billion users in 2024. That number's honestly pretty mind-blowing when you think about it. Asia and Africa are driving most of the growth since more people there are getting mobile internet access. The thing is, it keeps growing by 3-4% each year, which is huge for anyone doing marketing stuff. You should probably check these numbers every few months though because everything changes so fast in this space. Makes me wonder what it'll look like in another five years.
From what I've seen, Instagram usually crushes it with engagement - like 1-3% compared to Facebook's sad 0.09%. Twitter's even worse at 0.045%. TikTok can actually beat Instagram sometimes, especially for younger crowds, but honestly the data's all over the place since it's still pretty new. Here's the thing though - your follower count matters way more than these overall stats. Smaller accounts get crazy higher engagement rates. Plus different industries see totally different numbers. I'd worry less about which platform "wins" and just figure out where your people actually hang out and interact with stuff.
Dude, COVID absolutely wrecked everyone's screen time habits. Daily usage jumped 13% and people were scrolling 70% longer per session - honestly felt like half my day sometimes. TikTok and Instagram Reels basically took over the world during lockdowns, plus Facebook groups became huge for neighborhood stuff. Live streaming blew up too. Oh and video content in general just dominates now. If you're doing any campaigns, definitely go heavy on video and community features since people are still hooked on that format. Those habits aren't going anywhere.
Dude, it's actually seniors! Like 65+ adults are joining social media faster than any other group right now. COVID basically forced a ton of older people online and they just... stayed. Facebook, Instagram, even TikTok (which honestly still surprises me). Yeah, younger people are still the biggest chunk overall, but the growth rate in that older demographic is insane. They're super engaged too and have way more disposable income than most people realize. Don't ignore them if you're doing any marketing stuff - could be missing out on a goldmine.
Most people are on social media like 2.5 hours a day, but it really depends. Gen Z and millennials? They're easily doing 3-4 hours daily. Older folks stick closer to 1-2 hours. TikTok and Instagram are the worst offenders - those apps literally suck you in for hours without realizing it. Facebook and Twitter users don't spend as long per session but they're constantly checking throughout the day. Oh, and if you're doing any marketing stuff, evenings and weekends are when everyone's just mindlessly scrolling.
Yeah so TikTok and Instagram are where all the Gen Z kids live, plus younger millennials too. Older millennials still scroll Facebook but they're moving to Insta more. Gen X people are big on Facebook and LinkedIn - makes sense for work stuff I guess. Boomers surprised me though, they're not just on Facebook anymore. Tons of them watch YouTube religiously. Honestly if you want to hit different age groups, you can't just pick one platform and call it a day. Figure out where your people actually spend their time first, then go from there.
Think of influencers like having a friend vouch for you at a party. They've already got people's trust, so when they mention your stuff, it doesn't feel like another annoying ad. The ROI is actually insane - like 11x better than regular advertising. You get access to followers who genuinely listen to what they say (trust me, that's rare these days). Don't get caught up in follower counts though. Find someone whose audience matches who you're trying to reach. Honestly? Start with micro-influencers. Their engagement rates are usually way better anyway, and they won't blow your budget.
Honestly, social media usage is all over the place depending on where you're looking. Facebook's huge in the Philippines and Mexico, but good luck with that in China where everyone's on WeChat. Brazil and India? WhatsApp for days. Europe's tricky though - they're super privacy-focused (GDPR and all that), so don't expect crazy engagement rates there. The biggest mistake people make is thinking their home market represents everyone else. It doesn't, like at all. Always check your analytics by region first and research what platforms actually work in each area before you waste money on campaigns.
Honestly, most people hit unfollow when brands spam their feed or just push sales constantly. Nothing kills engagement like posting irrelevant stuff that doesn't match what your followers actually care about. Getting into politics is usually a bad move too - I've seen brands tank their following over that. Low-quality photos and ignoring customer complaints will also make people bounce quick. You don't want to be that annoying brand everyone rolls their eyes at. Post good content regularly but don't overdo it. Just think about whether you're actually adding value before you hit share.
So social media ad revenue was around $230 billion last year – crazy number, right? It's growing about 20% annually too. Meta and Google still own most of it, but TikTok's been eating into their market share pretty aggressively. Honestly, scrolling habits explain why the growth won't slow down anytime soon. Just heads up though – ad costs keep getting more expensive as everyone fights for the same eyeballs. Might want to peek at what your competitors are throwing at ads these days so you don't get priced out.
Dude, visuals are everything. Posts with images get like 2-3x more engagement than text-only stuff, and they're shared 40x more often - which honestly blows my mind every time I see those stats. Videos are even crazier though. The algorithm just eats that stuff up. Makes sense when you think about it - our brains process images way faster than reading text, so people actually stop scrolling. I learned this the hard way after posting boring text updates for months. Now I throw at least one good image on everything, even if it's just text on a colored background. Game changer.
So about 76% of people actually research stuff on social media before buying - crazy right? Most studies show around 3 out of 4 people scroll through reviews and check out brand profiles first. Gen Z and millennials do this way more than older folks too. Honestly, if you're trying to market anything these days, you can't ignore having a decent social presence. People want to see real reviews and content that actually helps them decide. I learned this the hard way when I was looking for a new skincare routine last month - spent like an hour on Instagram checking different brands!
Dude, LinkedIn is where it's at for B2B stuff. I know everyone says that, but seriously - the engagement rates crush Facebook and Twitter when you're going after business people. We're talking 2-3x better performance. Focus on thought leadership and industry insights instead of pushy sales content. Nobody wants that. Get your whole team posting company updates regularly - that organic reach actually beats most paid ads at first, which is kinda wild. Oh, and all those executives you're trying to reach? They're definitely doom-scrolling LinkedIn during lunch anyway.
Dude, short videos are crushing it right now - engagement is up like 1200% compared to regular posts. TikTok's hitting almost 6% engagement while Instagram's stuck at 0.6% (ouch). People are spending 52% more time on apps that have this quick-hit content, which makes sense because our attention spans are basically non-existent now. The crazy part? These platforms are literally boosting video content in their algorithms. If you haven't tried Reels or TikTok yet, honestly just post one thing this week and see what happens. Even a terrible first attempt will teach you something.
Dude, teens are basically living on BeReal and Snapchat stories now - they're over the whole polished Instagram feed thing. Multiple accounts are huge too, like they'll have different ones for different friend groups which is honestly pretty smart. TikTok's still their main thing but they're literally using it instead of Google to search for everything. Instagram's more for DMs and stories now. Oh and they're way more paranoid about privacy than I thought they'd be. If you're trying to reach them, go for that messy authentic vibe and target their specific little communities instead of doing those broad campaigns.
-
Appreciate the research and its presentable format.
-
Enough space for editing and adding your own content.
-
The content is very helpful from business point of view.