Social Media KPI Dashboard, Excel, Metrics PowerPoint Templates
-
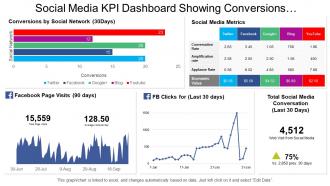 Social media kpi dashboard showing conversions by social network and metrics
Presenting this set of slides with name - Social Media Kpi Dashboard Showing Conversions By Social Network And Metrics. This is a five stage process. The stages in this process are Social Media, Digital Marketing, Social Marketing.
-
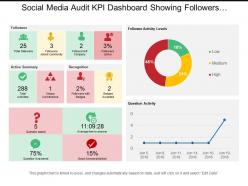 Social media audit kpi dashboard showing followers activity summary and activity leads
This PPT template is very useful for your business PowerPoint presentation. It is fully editable and has editable features like editable font, font size, font color, etc. There are many shapes to choose from like squares, triangles, circles, rectangles, pentagon and many more shapes in order to edit this presentation in PowerPoint. All the images in this PPT are 100% editable. The excel-linked charts in this PPT template can also be edited with ease. It can be viewed and saved in JPG or PDF format. It is fully compatible with Google slides as well.
-
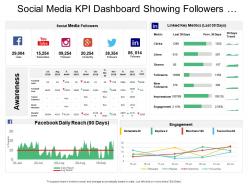 Social media kpi dashboard showing followers facebook daily reach
SlideTeam presents the Social media KPI dashboard showing followers Facebook daily reach This slideshow is modifiable according to your needs as you can make all the required changes to it whenever you feel like. You can edit the font size and font style. These slides are fully compatible with Google Slides. You can view the presentation on both 16:9 widescreen side as well as the 4:3 standard screen size. You can save them in either JPG or PDF format.
-
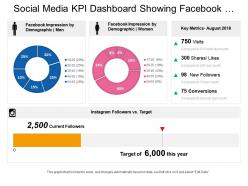 Social media kpi dashboard showing facebook impression by demographic instagram key metrics
Presenting this set of slides with name - Social Media Kpi Dashboard Showing Facebook Impression By Demographic Instagram Key Metrics. This is a four stage process. The stages in this process are Social Media, Digital Marketing, Social Marketing.
-
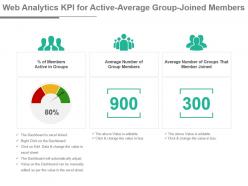 Web analytics kpi for active average group joined members powerpoint slide
Presenting, web analytics kpi for active average group joined members PowerPoint slide. Performance indication bar editable for your personalization. Simply convertible in JPEG/PDF format. Promote it through projectors for widescreen visions in meetings. Alter visuals, icons, colors and text. High quality images and the graphics. Insertion of logo and trademarks for more personalization. Quick to download and save. Simple to edit and customize as per your needs. Useful for industry professionals, technologists, managers, executives, researchers, sales people, etc.
-
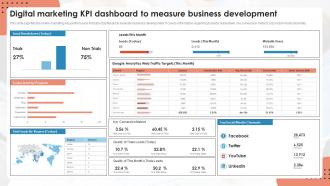 Digital Marketing KPI Dashboard To Measure Business Development
This slide signifies the online marketing key performance indicator dashboard to evaluate business development. It covers information regarding to leads breakdown, key conversion metrics, top social media channels. Introducing our Digital Marketing KPI Dashboard To Measure Business Development set of slides. The topics discussed in these slides are Digital Marketing, KPI Dashboard, Measure Business Development. This is an immediately available PowerPoint presentation that can be conveniently customized. Download it and convince your audience.
-
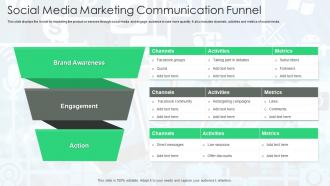 Social Media Marketing Communication Funnel
This slide displays the funnel for marketing the product or services through social media and engage audience to sale more quantity. It also includes channels, activities and metrics of social media. Presenting our set of slides with Social Media Marketing Communication Funnel. This exhibits information on three stages of the process. This is an easy to edit and innovatively designed PowerPoint template. So download immediately and highlight information on Brand Awareness, Engagement, Action.
-
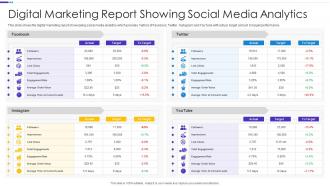 Digital Marketing Report Showing Social Media Analytics
This slide shows the digital marketing report showcasing social media analytics which provides metrics of Facebook, Twitter, Instagram and YouTube with actual, target and yet to target performance. Introducing our Digital Marketing Report Showing Social Media Analytics set of slides. The topics discussed in these slides are Impressions, Average Order Value, Engagement Rate. This is an immediately available PowerPoint presentation that can be conveniently customized. Download it and convince your audience.
-
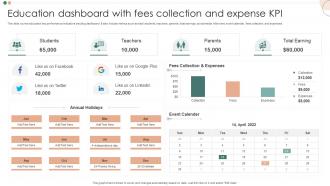 Education Dashboard With Fees Collection And Expense KPI
This slide covers education key performance indicators tracking dashboard. It also include metrics such as total students, teachers, parents, total earrings, social media followers, event calendar, fees collection, and expenses. Presenting our well structured Education Dashboard With Fees Collection And Expense KPI. The topics discussed in this slide are Education Dashboard, Fees Collection, Expense KPI. This is an instantly available PowerPoint presentation that can be edited conveniently. Download it right away and captivate your audience.
-
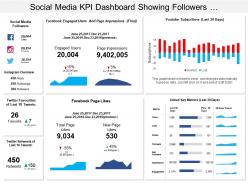 Social media kpi dashboard showing followers youtube subscribers facebook page likes
Presenting social media KPI dashboard PPT template. Makes the information clear in the mind of the audience. Editable and excel linked visuals, colors and text. Easy to edit and customize as per your needs. Beneficial for industry professionals, technologists, managers, executives, researchers, sales people, etc. Flexible presentation designs can be presented in standard and widescreen view. Has a futuristic and realistic approach. Privilege of insertion of logo and trademarks for more personalization. Easy to download and save. Highly beneficial PowerPoint Slide for highlighting pie charts.
-
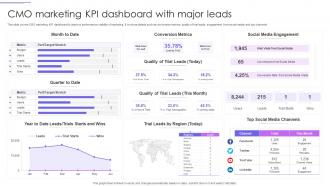 CMO Marketing KPI Dashboard With Major Leads
This slide covers CMO marketing KPI dashboard to improve performance visibility of marketing. It involves details such as conversion metrics, quality of trial leads, engagement from social media and top channels. Introducing our CMO Marketing KPI Dashboard With Major Leads set of slides. The topics discussed in these slides are Conversion Metrics, Social Media Engagement, Trial Leads. This is an immediately available PowerPoint presentation that can be conveniently customized. Download it and convince your audience.
-
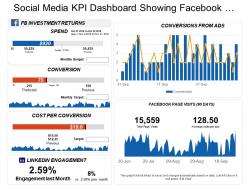 Social media kpi dashboard showing facebook investment returns conversion from ads
Presenting this set of slides with name - Social Media Kpi Dashboard Showing Facebook Investment Returns Conversion From Ads. This is a five stage process. The stages in this process are Social Media, Digital Marketing, Social Marketing.
-
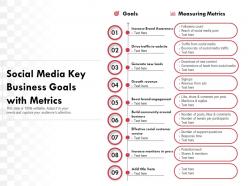 Social media key business goals with metrics
Presenting this set of slides with name Social Media Key Business Goals With Metrics. This is a nine stage process. The stages in this process are Measuring Metrics, Goals, Social Customer, Business, Growth Revenue. This is a completely editable PowerPoint presentation and is available for immediate download. Download now and impress your audience.
-
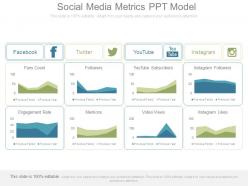 Social media metrics ppt model
Presenting social media metrics ppt model. This is a social media metrics ppt model. This is a eight stage process. The stages in this process are facebook, twitter, youtube, instagram, fans count, followers, youtube subscribers, instagram followers, engagement rate, mentions, video views, instagram likes.
-
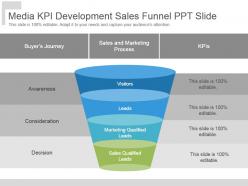 Media kpi development sales funnel ppt slide
Presenting media kpi development sales funnel ppt slide. This is a media kpi development sales funnel ppt slide. This is a four stage process. The stages in this process are visitors, leads, marketing qualified leads, sales qualified leads, decision, consideration, awareness.
-
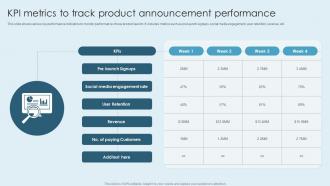 KPI Metrics To Track Product Announcement Performance
This slide shows various key performance indicators to monitor performance of new product launch. It includes metrics such as pre launch signups, social media engagement, user retention, revenue, etc. Presenting our well-structured KPI Metrics To Track Product Announcement Performance. The topics discussed in this slide are Revenue, Social Media, Engagement Rate, User Retention. This is an instantly available PowerPoint presentation that can be edited conveniently. Download it right away and captivate your audience.
-
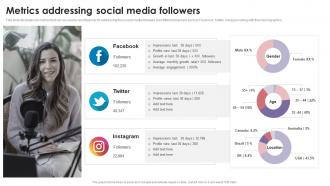 Metrics Addressing Social Media Followers
This slide illustrates key metrics that can be used by an influencer for addressing their social media followers over different channels such as Facebook, Twitter, Instagram along with their demographics. Deliver an outstanding presentation on the topic using this Metrics Addressing Social Media Followers. Dispense information and present a thorough explanation of Metrics Addressing, Social Media Followers using the slides given. This template can be altered and personalized to fit your needs. It is also available for immediate download. So grab it now.
-
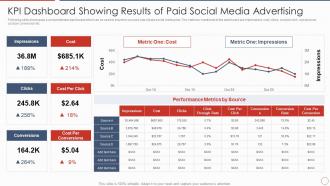 KPI Dashboard Showing Results Of Paid Social Media Advertising
Following slide showcases a comprehensive dashboard which can be used to examine success rate of paid social media plan. The metrices mentioned in the dashboard are impressions, cost, clicks, cost per click, conversions, cost per conversion etc. Presenting our well structured KPI Dashboard Showing Results Of Paid Social Media Advertising. The topics discussed in this slide are KPI Dashboard Showing Results Of Paid Social Media Advertising. This is an instantly available PowerPoint presentation that can be edited conveniently. Download it right away and captivate your audience.
-
 Social media kpi dashboard showing traffic social events referral traffic
Presenting this set of slides with name - Social Media Kpi Dashboard Showing Traffic Social Events Referral Traffic. This is a four stage process. The stages in this process are Social Media, Digital Marketing, Social Marketing.
-
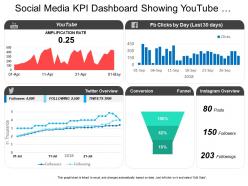 Social media kpi dashboard showing youtube amplification rate conversion
We introduces to you its new Social media KPI dashboard showing YouTube amplification rate conversion PowerPoint template. You can download the business template, edit the data in the excel sheet and the graph changes dynamically. You can add backgrounds to all of the slides. This presentation is available for free download in JPG and PDF format. All the slides in this presentation are fully compatible with Google slides. You can view this document in widescreen size and standard screen size.
-
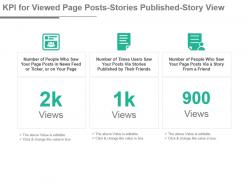 Kpi for viewed page posts stories published story view powerpoint slide
Presenting kpi for viewed page posts stories published story view powerpoint slide. This presentation slide shows three Key Performance Indicators or KPIs in a Dashboard style design. The first KPI that can be shown is Number of People Who Saw Your Page Posts in News Feed or Ticker, or on Your Page. The second KPI is Number of Times Users Saw Your Posts Via Stories Published by Their Friends and the third is Number of People Who Saw Your Page Posts Via a Story From a Friend. These KPI Powerpoint graphics are all data driven, and the shape automatically adjusts according to your data. Just right click on the KPI graphic, enter the right value and the shape will adjust automatically. Make a visual impact with our KPI slides.
-
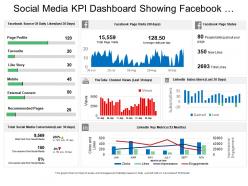 Social media kpi dashboard showing facebook page stats youtube channel views
Presenting this set of slides with name - Social Media Kpi Dashboard Showing Facebook Page Stats Youtube Channel Views. This is a five stage process. The stages in this process are Social Media, Digital Marketing, Social Marketing.
-
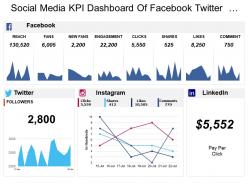 Social media kpi dashboard of facebook twitter instagram clicks followers
Presenting this set of slides with name - Social Media Kpi Dashboard Of Facebook Twitter Instagram Clicks Followers. This is a four stage process. The stages in this process are Social Media, Digital Marketing, Social Marketing.
-
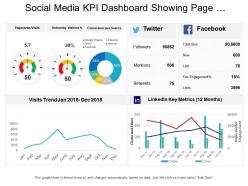 Social media kpi dashboard showing page viewsvisits conversion per source
Presenting this set of slides with name - Social Media Kpi Dashboard Showing Page Viewsvisits Conversion Per Source. This is a four stage process. The stages in this process are Social Media, Digital Marketing, Social Marketing.
-
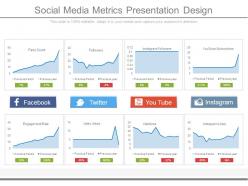 Social media metrics presentation design
Presenting social media metrics presentation design. This is a social media metrics presentation design. This is a eight stage process. The stages in this process are fans count, followers, subscriber, facebook, twitter, youtube, instagram.
-
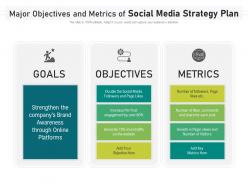 Major objectives and metrics of social media strategy plan
Introducing our premium set of slides with Major Objectives And Metrics Of Social Media Strategy Plan. Elucidate the three stages and present information using this PPT slide. This is a completely adaptable PowerPoint template design that can be used to interpret topics like Major Objectives, Metrics Social, Media Strategy Plan. So download instantly and tailor it with your information.
-
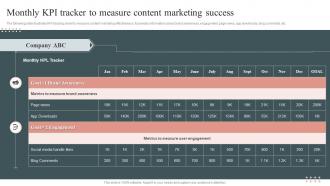 Monthly KPI Tracker To Measure Content Marketing Success
The following slide illustrates KPI tracking sheet to measure content marketing effectiveness. It provides information about brand awareness, engagement, page views, app downloads, blog comments, etc. Presenting our well structured Monthly KPI Tracker To Measure Content Marketing Success. The topics discussed in this slide are Social Media Handle, Metrics To Measure, Marketing Success. This is an instantly available PowerPoint presentation that can be edited conveniently. Download it right away and captivate your audience.
-
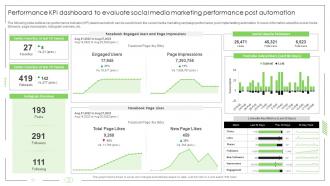 Performance KPI Dashboard To Evaluate Social Media Marketing Performance Post Automation
The following slide outlines key performance indicator KPI dashboard which can be used to track the social media marketing campaign performance, post implementing automation. It covers information about the social media followers, page impressions, instagram overview, etc.Deliver an outstanding presentation on the topic using this Performance KPI Dashboard To Evaluate Social Media Marketing Performance Post Automation. Dispense information and present a thorough explanation of Twitter Favorites, Instagram Overview, Media Followers using the slides given. This template can be altered and personalized to fit your needs. It is also available for immediate download. So grab it now.
-
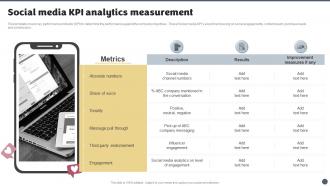 Social Media Brand Marketing Playbook Social Media KPI Analytics Measurement
This template covers key performance indicator KPI to determine the performance against the company objectives. These Social media KPIs would be focusing on social engagements, content reach, purchase leads and conversions. Introducing Social Media Brand Marketing Playbook Social Media KPI Analytics Measurement to increase your presentation threshold. Encompassed with three stages, this template is a great option to educate and entice your audience. Dispence information on Metrics, Absolute Numbers, Message Pull Through, Third Party Endorsement, using this template. Grab it now to reap its full benefits.
-
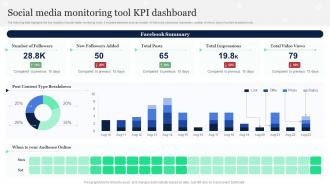 Social Media Monitoring Tool KPI Dashboard
The following slide highlights the key insights of social media monitoring tools. It includes elements such as number of followers, total posts, impression, number of views, type of content breakdown etc. Introducing our Social Media Monitoring Tool KPI Dashboard set of slides. The topics discussed in these slides are Social Media Monitoring, Tool, KPI Dashboard. This is an immediately available PowerPoint presentation that can be conveniently customized. Download it and convince your audience.
-
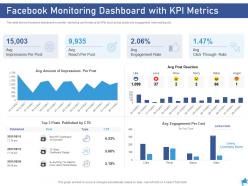 Facebook monitoring dashboard with kpi metrics digital marketing through facebook ppt rules
This slide shows Facebook dashboard to monitor marketing performance by KPIs such as top posts and engagement rate tracking etc. Present the topic in a bit more detail with this Facebook Monitoring Dashboard With KPI Metrics Digital Marketing Through Facebook Ppt Rules. Use it as a tool for discussion and navigation on Impressions Per Post, Reach Per Post, Engagement Rate. This template is free to edit as deemed fit for your organization. Therefore download it now.
-
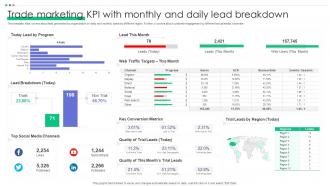 Trade Marketing KPI With Monthly And Daily Lead Breakdown
This template slide covers about lead generated by organization on daily and monthly basis by different region. Further, it covers about customer engagement by different social media channels. Presenting our well structured Trade Marketing KPI With Monthly And Daily Lead Breakdown. The topics discussed in this slide are Today Lead By Program, Lead This Month, Lead Breakdown. This is an instantly available PowerPoint presentation that can be edited conveniently. Download it right away and captivate your audience.
-
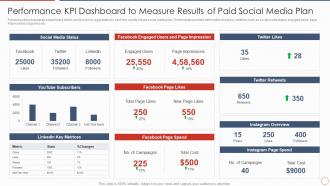 Performance KPI Dashboard To Measure Results Of Paid Social Media Plan
Following slide showcases a dashboard which can be used by organization to track the results of paid social media plan. The template provides information about key metrices such as social media status, engaged users, page impressions, page likes etc. Presenting our well structured Performance KPI Dashboard To Measure Results Of Paid Social Media Plan. The topics discussed in this slide are Performance KPI Dashboard To Measure Results Of Paid Social Media Plan. This is an instantly available PowerPoint presentation that can be edited conveniently. Download it right away and captivate your audience.
-
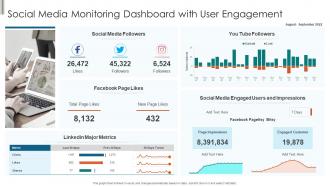 Social Media Monitoring Dashboard With User Engagement
Presenting our well structured Social Media Monitoring Dashboard With User Engagement. The topics discussed in this slide are Social Media, Major Metrics, Customer. This is an instantly available PowerPoint presentation that can be edited conveniently. Download it right away and captivate your audience.
-
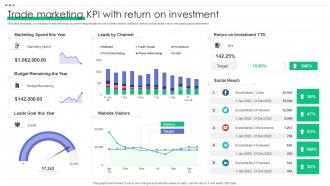 Trade Marketing KPI With Return On Investment
This slide templates covers about trade marketing key performing indicators with website visitors, leads by channel, social media reach with yearly goal achievement. Presenting our well structured Trade Marketing KPI With Return On Investment. The topics discussed in this slide are Marketing Spend, Return Investment YTD, Budget Remaining Year. This is an instantly available PowerPoint presentation that can be edited conveniently. Download it right away and captivate your audience.
-
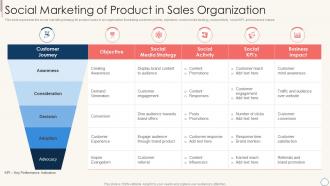 Social Marketing Of Product In Sales Organization
This slide represents the social marketing strategy for product sales in an organization illustrating customer journey, objectives, social media strategy, social activity, social KPI, and business impact. Presenting our well structured Social Marketing Of Product In Sales Organization. The topics discussed in this slide are Awareness, Consideration, Decision. This is an instantly available PowerPoint presentation that can be edited conveniently. Download it right away and captivate your audience.
-
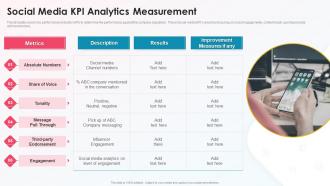 Social Media Kpi Analytics Measurement Media Platform Playbook
This template covers key performance indicator KPI to determine the performance against the company objectives. These Social media KPIs would be focusing on social engagements, content reach, purchase leads and conversions. Deliver an outstanding presentation on the topic using this Social Media Kpi Analytics Measurement Media Platform Playbook. Dispense information and present a thorough explanation of Social Media Kpi Analytics Measurement using the slides given. This template can be altered and personalized to fit your needs. It is also available for immediate download. So grab it now.
-
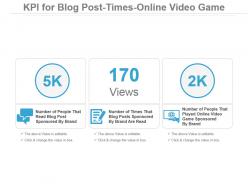 Kpi For Blog Post Times Online Video Game Ppt Slide
Presenting kpi for blog post times online video game ppt slide. This presentation slide shows three Key Performance Indicators or KPIs in a Dashboard style design. The first KPI that can be shown is Number of People That Read Blog Post Sponsored By Brand. The second KPI is Number of Times That Blog Posts Sponsored By Brand Are Read and the third is Number of People That Played Online Video Game Sponsored By Brand. These KPI Powerpoint graphics are all data driven, and the shape automatically adjusts according to your data. Just right click on the KPI graphic, enter the right value and the shape will adjust automatically. Make a visual impact with our KPI slides.
-
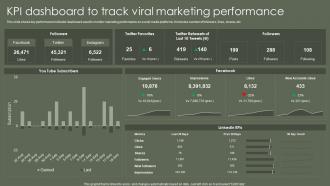 Kpi Dashboard Snapshot To Track Viral Marketing Performance
This slide shows key performance indicator dashboard used to monitor marketing performance on social media platforms. It includes number of followers, likes, shares, etc. Introducing our Kpi Dashboard Snapshot To Track Viral Marketing Performance set of slides. The topics discussed in these slides are Dashboard, Marketing, Performance. This is an immediately available PowerPoint presentation that can be conveniently customized. Download it and convince your audience.
-
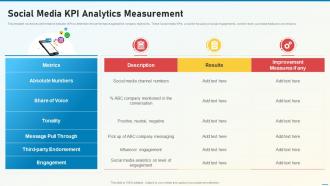 Social Media Playbook Kpi Analytics Measurement
This template covers key performance indicator KPI to determine the performance against the company objectives. These Social media KPIs would be focusing on social engagements, content reach, purchase leads and conversions. Deliver an outstanding presentation on the topic using this Social Media Playbook Kpi Analytics Measurement. Dispense information and present a thorough explanation of Analytics, Measurement, Performance using the slides given. This template can be altered and personalized to fit your needs. It is also available for immediate download. So grab it now.
-
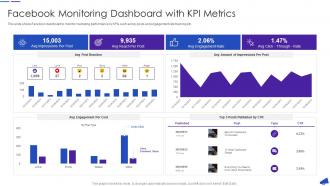 Facebook Monitoring Dashboard With KPI Metrics Facebook For Business Marketing
This slide shows Facebook dashboard to monitor marketing performance by KPIs such as top posts and engagement rate tracking etc.Deliver an outstanding presentation on the topic using this Facebook Monitoring Dashboard With KPI Metrics Facebook For Business Marketing Dispense information and present a thorough explanation of Facebook Monitoring Dashboard With Kpi Metrics using the slides given. This template can be altered and personalized to fit your needs. It is also available for immediate download. So grab it now.
-
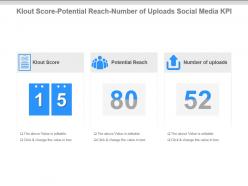 Klout score potential reach number of uploads social media kpi ppt slide
Presenting klout score potential reach number of uploads social media kpi ppt slide. This presentation slide shows three Key Performance Indicators or KPIs in a Dashboard style design. The first KPI that can be shown is Klout Score. The second KPI is Potential Reach and the third is Number of uploads. These KPI Powerpoint graphics are all data driven, and the shape automatically adjusts according to your data. Just right click on the KPI graphic, enter the right value and the shape will adjust automatically. Make a visual impact with our KPI slides.
-
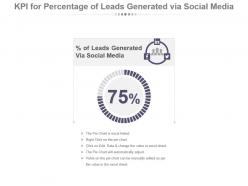 Kpi for percentage of leads generated via social media ppt slide
Presenting kpi for percentage of leads generated via social media ppt slide. This presentation slide shows one Key Performance Indicators or KPIs in a Dashboard style design. The first KPI that can be shown is percentage of Leads Generated Via Social Media. These KPI Powerpoint graphics are all data driven, and the shape automatically adjusts according to your data. Just right click on the KPI graphic, enter the right value and the shape will adjust automatically. Make a visual impact with our KPI slides.
-
 Social media marketing kpi for product ideas people feedback powerpoint slide
Presenting social media marketing kpi for product ideas people feedback powerpoint slide. This presentation slide shows three Key Performance Indicators or KPIs in a Dashboard style design. The first KPI that can be shown is Number of Product Ideas Submitted to Brand in an Open Online Forum. The second KPI is Number of People That Submitted Product Ideas Brand in an Open Online Forum and the third is Number of People That Provided Feedback on Brand Website. These KPI Powerpoint graphics are all data driven, and the shape automatically adjusts according to your data. Just right click on the KPI graphic, enter the right value and the shape will adjust automatically. Make a visual impact with our KPI slides.
-
 Measure facebook kpi content powerpoint ppt template bundles
Introduce your topic and host expert discussion sessions with this Measure Facebook KPI Content Powerpoint Ppt Template Bundles. This template is designed using high-quality visuals, images, graphics, etc, that can be used to showcase your expertise. Different topics can be tackled using the eleven slides included in this template. You can present each topic on a different slide to help your audience interpret the information more effectively. Apart from this, this PPT slideshow is available in two screen sizes, standard and widescreen making its delivery more impactful. This will not only help in presenting a birds-eye view of the topic but also keep your audience engaged. Since this PPT slideshow utilizes well-researched content, it induces strategic thinking and helps you convey your message in the best possible manner. The biggest feature of this design is that it comes with a host of editable features like color, font, background, etc. So, grab it now to deliver a unique presentation every time.
-
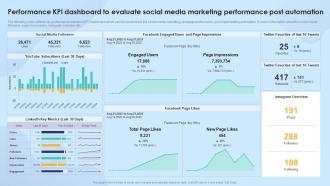 Strengthening Process Improvement Performance KPI Dashboard To Evaluate Social Media Marketing
The following slide outlines key performance indicator KPI dashboard which can be used to track the social media marketing campaign performance, post implementing automation. It covers information about the social media followers, page impressions, instagram overview, etc. Present the topic in a bit more detail with this Strengthening Process Improvement Performance KPI Dashboard To Evaluate Social Media Marketing. Use it as a tool for discussion and navigation on Social Media Followers, Facebook Engaged Users And Page Impressions, Twitter Favorites Of Last 10 Tweets, Facebook Page Likes, Page Impressions, Engaged Users. This template is free to edit as deemed fit for your organization. Therefore download it now.
-
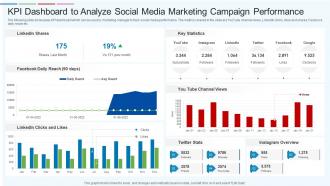 KPI Dashboard To Analyze Social Media Marketing Campaign Performance
The following slide showcases KPI dashboard which can be used by marketing manager to track social media performance. The metrics covered in the slide are YouTube channel views, LinkedIn clicks, likes and shares, Facebook daily reach etc. Presenting our well structured KPI Dashboard To Analyze Social Media Marketing Campaign Performance. The topics discussed in this slide are Linkedin Shares, Facebook Daily Reach 90 Days, Key Statistics, Instagram Overview. This is an instantly available PowerPoint presentation that can be edited conveniently. Download it right away and captivate your audience.
-
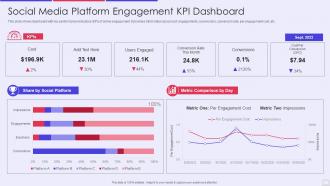 Social media platform engagement kpi dashboard
Presenting our well structured Social Media Platform Engagement Kpi Dashboard. The topics discussed in this slide are Social Media Platform Engagement KPI Dashboard. This is an instantly available PowerPoint presentation that can be edited conveniently. Download it right away and captivate your audience.
-
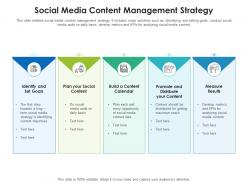 Social media content management strategy
This slide exhibits social media content management strategy. It includes major activities such as- identifying and setting goals, conduct social media audit on daily basis, develop metrics and KPIs for analyzing social media content. Presenting our set of slides with name Social Media Content Management Strategy. This exhibits information on five stages of the process. This is an easy-to-edit and innovatively designed PowerPoint template. So download immediately and highlight information on Management, Strategy, Goals.
-
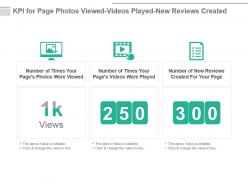 Kpi for page photos viewed videos played new reviews created presentation slide
Presenting kpi for page photos viewed videos played new reviews created presentation slide. This presentation slide shows three Key Performance Indicators or KPIs in a Dashboard style design. The first KPI that can be shown is Number of Times Your Pages Photos Were Viewed. The second KPI is Number of Times Your Pages Videos Were Played and the third is Number of New Reviews Created For Your Page. These KPI Powerpoint graphics are all data driven, and the shape automatically adjusts according to your data. Just right click on the KPI graphic, enter the right value and the shape will adjust automatically. Make a visual impact with our KPI slides.
-
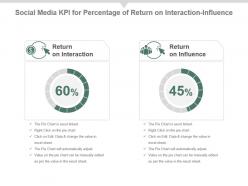 Social media kpi for percentage of return on interaction influence ppt slide
Presenting social media kpi for percentage of return on interaction influence ppt slide. This presentation slide shows two Key Performance Indicators or KPIs in a Dashboard style design. The first KPI that can be shown is Return on Interaction. The second KPI is Return on Influence. These KPI Powerpoint graphics are all data driven, and the shape automatically adjusts according to your data. Just right click on the KPI graphic, enter the right value and the shape will adjust automatically. Make a visual impact with our KPI slides.
-
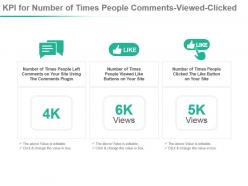 Kpi for number of times people comments viewed clicked ppt slide
Presenting kpi for number of times people comments viewed clicked ppt slide. This presentation slide shows three Key Performance Indicators or KPIs in a Dashboard style design. The first KPI that can be shown is Number of Times People Left Comments on Your Site Using The Comments Plugin. The second KPI is Number of Times People Viewed Like Buttons on Your Site and the third is Number of Times People Clicked The Like Button on Your Site. These KPI Powerpoint graphics are all data driven, and the shape automatically adjusts according to your data. Just right click on the KPI graphic, enter the right value and the shape will adjust automatically. Make a visual impact with our KPI slides.
-
 Kpi metrics channels ppt powerpoint presentation icon introduction
Presenting this set of slides with name KPI Metrics Channels Ppt Powerpoint Presentation Icon Introduction. This is a one stage process. The stages in this process are Top Social Media Channels. This is a completely editable PowerPoint presentation and is available for immediate download. Download now and impress your audience.
-
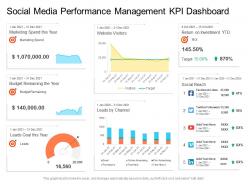 Social media performance management kpi dashboard
Introducing our Social Media Performance Management KPI Dashboard set of slides. The topics discussed in these slides are Budget, Marketing, Investment, Target, Social. This is an immediately available PowerPoint presentation that can be conveniently customized. Download it and convince your audience.
-
 Performance KPI Dashboard To Evaluate Social Media BPA Tools For Process Improvement And Cost Reduction
The following slide outlines key performance indicator KPI dashboard which can be used to track the social media marketing campaign performance, post implementing automation. It covers information about the social media followers, page impressions, instagram overview, etc. Present the topic in a bit more detail with this Performance KPI Dashboard To Evaluate Social Media BPA Tools For Process Improvement And Cost Reduction. Use it as a tool for discussion and navigation on Social Media Followers, Facebook Page Likes, LinkedIn Key Metrics. This template is free to edit as deemed fit for your organization. Therefore download it now.
-
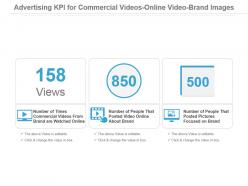 Advertising kpi for commercial videos online video brand images powerpoint slide
Presenting advertising kpi for commercial videos online video brand images powerpoint slide. This presentation slide shows three Key Performance Indicators or KPIs in a Dashboard style design. The first KPI that can be shown is Number of Times Commercial Videos From Brand are Watched Online. The second KPI is Number of People That Posted Video Online About Brand and the third is Number of People That Posted Pictures Focused on Brand. These KPI Powerpoint graphics are all data driven, and the shape automatically adjusts according to your data. Just right click on the KPI graphic, enter the right value and the shape will adjust automatically. Make a visual impact with our KPI slides.
-
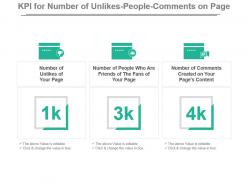 Kpi for number of unlikes people comments on page presentation slide
Presenting kpi for number of unlikes people comments on page presentation slide. This presentation slide shows three Key Performance Indicators or KPIs in a Dashboard style design. The first KPI that can be shown is Number of Unlikes of Your Page. The second KPI is Number of People Who Are Friends of The Fans of Your Page and the third is Number of Comments Created on Your Pages Content. These KPI Powerpoint graphics are all data driven, and the shape automatically adjusts according to your data. Just right click on the KPI graphic, enter the right value and the shape will adjust automatically. Make a visual impact with our KPI slides.
-
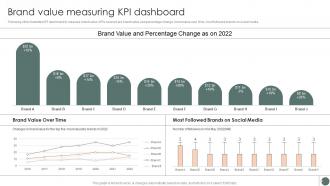 Brand Value Measuring KPI Dashboard
Following slide illustrates KPI dashboard to measure brand value. KPIs covered are brand value and percentage change, brand value over time, most followed brands on social media. Deliver an outstanding presentation on the topic using this Brand Value Measuring KPI Dashboard. Dispense information and present a thorough explanation of Brand Value, Percentage Change, Social Media using the slides given. This template can be altered and personalized to fit your needs. It is also available for immediate download. So grab it now.
-
 Kpi icon for social media marketing analysis
Presenting this set of slides with name - Kpi Icon For Social Media Marketing Analysis. This is a four stage process. The stages in this process are Metrics Icon, Kpi Icon, Statistics Icon.
-
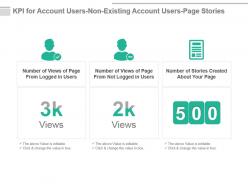 Kpi for account users non existing account users page stories presentation slide
Presenting kpi for account users non existing account users page stories presentation slide. This presentation slide shows three Key Performance Indicators or KPIs in a Dashboard style design. The first KPI that can be shown is Number of Views of Page From Logged in Users. The second KPI is Number of Views of Page From Not Logged in Users and the third is Number of Stories Created About Your Page. These KPI Powerpoint graphics are all data driven, and the shape automatically adjusts according to your data. Just right click on the KPI graphic, enter the right value and the shape will adjust automatically. Make a visual impact with our KPI slides.


