


KPI Metrics To Track Product Announcement Performance




Try Before you Buy Download Free Sample Product
 Impress Your
 Audience
 100%
100% Editable
 Save Hours
 of Time


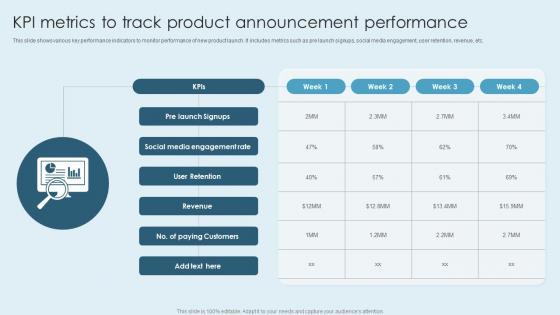
This slide shows various key performance indicators to monitor performance of new product launch. It includes metrics such as pre launch signups, social media engagement, user retention, revenue, etc.
People who downloaded this PowerPoint presentation also viewed the following :
KPI Metrics To Track Product Announcement Performance with all 6 slides:
Use our KPI Metrics To Track Product Announcement Performance to effectively help you save your valuable time. They are readymade to fit into any presentation structure.





FAQs for KPI Metrics To Track
**INPUT**: What are the most critical KPI metrics for assessing overall business performance? **OUTPUT**: Critical KPIs include revenue growth rate, customer acquisition cost, customer lifetime value, profit margins, and operational efficiency metrics. These indicators streamline performance assessment by measuring financial health, customer relationships, and operational effectiveness, with many organizations finding that combining financial and operational KPIs delivers comprehensive insights and competitive advantage. **Word count**: 50 words
Organizations effectively align KPIs with strategic objectives by establishing clear connections between measurable outcomes and business goals, cascading metrics across departments, and ensuring regular review cycles. Through strategic mapping and performance dashboards, companies like manufacturing firms and financial services streamline accountability, enhance decision-making transparency, and ultimately deliver improved operational efficiency while maintaining competitive advantage.
Leading indicators predict future performance through early signals like employee engagement scores, training completion rates, and customer acquisition costs, while lagging indicators measure outcomes such as revenue, customer satisfaction, and profit margins. Organizations increasingly use strategic combinations of both, with leading indicators enabling proactive adjustments and lagging indicators validating results, ultimately delivering comprehensive performance visibility and competitive advantage.
Determining the right KPIs involves aligning metrics with specific departmental objectives, business goals, and measurable outcomes that drive strategic value. Sales teams might track conversion rates and revenue growth, while HR focuses on employee retention and recruitment efficiency, and operations monitors cost reduction and productivity improvements, with many organizations finding that cross-functional KPI alignment enhances overall performance and competitive advantage.
KPIs can significantly enhance employee engagement and accountability by providing clear performance expectations, transparent goal tracking, and direct connections between individual contributions and organizational success. When implemented thoughtfully, performance metrics enable employees to understand their impact, receive regular feedback, and take ownership of outcomes, with many organizations finding that well-designed KPI systems ultimately deliver improved motivation and stronger results.
Common pitfalls when setting up KPI metrics include choosing too many indicators, selecting metrics without clear business alignment, focusing solely on lagging indicators, and setting unrealistic targets. These missteps can overwhelm teams and dilute focus, with many organizations finding that streamlining to 5-7 strategic KPIs ultimately delivers clearer insights and improved performance outcomes.
Qualitative KPIs measure subjective elements like customer satisfaction, employee engagement, brand perception, and service quality through surveys and feedback, while quantitative KPIs track numerical data such as revenue, conversion rates, and productivity metrics. Organizations typically use quantitative KPIs for operational performance and financial tracking, while qualitative KPIs help assess customer experiences and organizational culture, with many finding that combining both delivers comprehensive business insights.
**INPUT**: What tools or software can assist in tracking and visualizing KPI metrics? **OUTPUT**: KPI tracking tools include Tableau, Power BI, Google Analytics, Salesforce Analytics, and specialized dashboard platforms like Klipfolio or Geckoboard. These solutions streamline performance monitoring by automating data collection, creating real-time visualizations, and enabling cross-departmental collaboration, with many organizations finding that integrated analytics platforms ultimately deliver faster decision-making and enhanced operational efficiency. **Word count: 54 words**
KPI reviews should occur monthly for operational metrics, quarterly for strategic indicators, and annually for long-term objectives, with adjustments made when business priorities shift or market conditions change. Many organizations find that establishing regular review cycles, combined with trigger-based assessments during major initiatives or external disruptions, ensures metrics remain aligned with evolving goals and deliver actionable insights for competitive advantage.
Benchmarking KPIs against industry standards provides crucial context for performance evaluation, competitive positioning, and strategic decision-making by revealing performance gaps and improvement opportunities. This practice enables organizations to identify best practices, set realistic targets, and prioritize resource allocation more effectively, with many companies finding that systematic benchmarking ultimately delivers enhanced operational efficiency and sustainable competitive advantage.
Companies ensure KPIs are actionable by linking metrics directly to specific business processes, assigning clear ownership to teams, and establishing defined response protocols for performance variations. By connecting each KPI to strategic goals, implementing regular review cycles, and creating dashboards that trigger immediate actions, organizations transform static numbers into dynamic tools that drive measurable improvements and competitive advantage.
Effective KPI communication processes include regular dashboard updates, structured reporting schedules, cross-departmental review meetings, executive briefings, and accessible data visualization platforms. These mechanisms ensure transparency by standardizing metrics presentation, facilitating collaborative analysis, and enabling real-time performance tracking, with many organizations finding that consistent communication rhythms ultimately enhance accountability and drive strategic alignment across all operational levels.
Cultural differences significantly impact KPI interpretation through varying communication styles, risk tolerance levels, time orientations, and decision-making approaches across global teams. While Western cultures often emphasize individual accountability and immediate action on metrics, many Asian and Latin American teams prioritize collective consensus and long-term relationship building, ultimately requiring culturally adapted KPI frameworks for effective global performance management.
Effective KPI presentation techniques include clear visual hierarchies, strategic color coding, trend analysis charts, comparative benchmarking displays, and contextual storytelling frameworks. These approaches streamline complex data interpretation by highlighting critical performance gaps, showcasing progress trajectories, and connecting metrics to strategic business outcomes, with many organizations finding that visual consistency and narrative context significantly enhance stakeholder engagement and decision-making speed.
Companies utilize KPI metrics to drive continuous improvement by establishing baseline measurements, identifying performance gaps, setting targeted improvement goals, and implementing data-driven action plans. Through regular monitoring and analysis, organizations streamline operations, enhance customer satisfaction, and optimize resource allocation, with many manufacturing and service companies finding that systematic KPI tracking ultimately delivers measurable efficiency gains and competitive advantage.
-
I'm happy to discover your PowerPoint presentations and templates. They met my expectations precisely. Very innovative!
-
These stunning templates can help you create a presentation like a pro.