


New product performance evaluation product performance dashboards


Try Before you Buy Download Free Sample Product
 Impress Your
 Audience
Editable
of Time


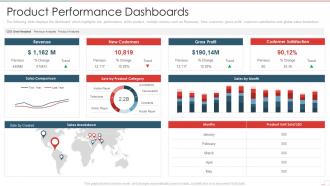
The following slide displays the dashboard which highlights the performance of the product, multiple metrics such as Revenues, New customer, gross profit, customer satisfaction and global sales breakdown
People who downloaded this PowerPoint presentation also viewed the following :
New product performance evaluation product performance dashboards with all 7 slides:
Use our New Product Performance Evaluation Product Performance Dashboards to effectively help you save your valuable time. They are readymade to fit into any presentation structure.


FAQs for New product performance evaluation
Honestly, start with conversion rate, average order value, and customer acquisition cost - those three will tell you if people are buying and what it's costing you. Cart abandonment is huge too since that's where you lose tons of sales. Customer lifetime value and return rate matter because repeat customers are way more profitable than new ones. Traffic stuff like sessions and bounce rate gives you the basics, plus inventory turnover if you're dealing with physical products. Oh, and don't get overwhelmed trying to track everything at once. These eight metrics will show you what's broken and what's actually working.
Honestly, charts and graphs are game-changers for product metrics. Raw spreadsheets make my eyes glaze over, but visual dashboards? You'll spot trends and issues instantly. Performance drops become obvious. User behavior patterns jump out at you. I always start with my biggest KPIs and set up auto-updating visuals - saves so much time. The filtering features are clutch too; you can drill down into specific segments without getting lost in data hell. Way better than scrolling through endless rows trying to find correlations that might not even exist.
Dude, you definitely want real-time data if you can swing it. Otherwise you're just looking at pretty charts that don't actually help when shit hits the fan. Like, imagine finding out your conversion rates tanked last Tuesday when it's already Friday - what's the point? With live feeds, you catch problems immediately. User engagement drops? You know right away. Performance issues? Same thing. I'd set up alerts for your most important stuff so you don't have to constantly babysit the dashboard. Trust me, making decisions off old data is basically useless.
Honestly, first figure out what actually moves the needle for your product. Retention matters? Focus on cohort analysis and engagement - forget vanity metrics like total signups. Growth is the priority? Track conversion funnels and revenue per user instead. Most dashboards I see are just... cluttered messes that nobody actually uses. Be brutal about what you include. Different goals need different timeframes too - some stuff you'll want daily, others monthly works fine. Oh, and set up alerts when you hit thresholds so you don't miss important shifts.
Here's what works: stick to the "5-second rule" - people should get your key info instantly. Put your most critical stuff at the top, max 7 metrics or you'll lose them. I've seen way too many dashboards that look like someone threw up a crayon box, so go easy on colors. Daily refresh hits the sweet spot for most product data. Throw in some trend arrows and benchmarks so folks actually know if 47% conversion is decent or trash. Oh, and sketch it out first - trust me on this one. Don't jump straight into building.
Yeah, totally depends on the industry. SaaS companies are basically obsessed with monthly recurring revenue, churn rates, and how much users actually engage with the product. E-commerce is all about conversion rates and why people abandon their carts - plus customer acquisition costs obviously. Healthcare has to track patient outcomes and compliance stuff because of all the regulations. Manufacturing focuses more on efficiency metrics, defect rates, supply chain performance. Financial services? They're tracking risk, transaction volumes, regulatory compliance - honestly makes sense given how heavily they're regulated. I'd just look at 2-3 competitors' investor reports or case studies. That'll show you what metrics they think actually matter.
Tableau and Power BI are your best bets if you need something robust - they crush complex data visualization. Google Data Studio works great for lighter stuff, especially if you're already using Google Analytics. Mixpanel and Amplitude are solid too for user behavior tracking. Honestly though, I've watched so many teams get paralyzed choosing the "perfect" tool. Just pick whatever plays nice with your current data setup and start building something. You can always switch later if it sucks. The tool matters way less than actually getting insights in front of people.
Dude, these dashboards are game-changers - you get real-time data on what's actually working instead of guessing. I wasted SO much time buried in spreadsheets before (ugh, never again). You'll catch trends fast, like when feature adoption tanks or engagement randomly spikes somewhere weird. Having all your KPIs in one spot where everyone can see them? Total lifesaver. Oh, and definitely set alerts for the critical stuff so you can jump on issues quickly. Honestly makes decision-making way less stressful when you're not flying blind.
Honestly, user feedback is everything. Your dashboard could look amazing to you, but if people can't figure out what they're looking at, it's useless. I've seen so many "perfect" conversion funnels that just confuse everyone who tries to use them. Users will tell you which metrics actually help their jobs and when you're cramming too much onto one screen. Quick story - I once spent weeks on this elaborate chart that literally nobody used because it answered questions no one was asking. Set up some casual 15-minute chats with your users. They'll catch blindspots you'd never see yourself.
Honestly, AI dashboards are pretty sick - they actually predict stuff instead of just showing you old data. Like, you'll catch patterns you'd never spot otherwise. User behavior predicting churn? Early signs a feature's taking off? That's the kind of intel that matters. Anomaly detection is clutch too - no more missing weird spikes because they got buried in your weekly reports. My advice? Don't go crazy trying to automate everything right away. Pick one thing like forecasting or outlier alerts and nail that first. Way less overwhelming and you'll actually see results.
Oh man, data silos are gonna be your worst enemy. Teams can't agree on which metrics actually matter - IT freaks out about integration costs while everyone argues about KPIs forever. Most of your data sources won't even talk to each other, which is fun. People also go crazy with dashboards, shoving everything onto one screen until it's completely useless. And don't get me started on "real-time data" - sounds amazing until you see the price tag. Honestly? Just pick 3-5 metrics everyone can live with first, then build from there.
Weekly updates are your best bet, though daily works too if things move super fast. Match it to how quickly your numbers actually shift and when people need to make calls. I've watched way too many monthly dashboards become totally pointless - the data's ancient by the time anyone looks. Most SaaS stuff? Weekly hits that sweet spot where you're current but not drowning everyone in updates. Honestly, monthly is just lazy at this point. Start weekly and see how it feels from there.
Honestly, just pick 5-7 metrics that actually matter for decisions. I've seen way too many dashboards that look amazing but are basically data museums - nobody touches them. Skip the vanity stuff that makes you feel good but doesn't help you act. Your data needs to be current because stale numbers make people stop trusting the whole thing. Simple charts usually beat fancy ones anyway. Oh, and design it for whoever's actually using it - your CEO doesn't need the same view as your dev team. Start by asking yourself: what's the one main question this thing should answer?
Dude, you need historical data or your dashboard is basically useless. Without it, you're just staring at random numbers with zero context. I'd say throw in at least 6-12 months of past data so you can actually see trends and seasonal stuff. Like, maybe your metrics always tank in January - knowing that stops you from freaking out every winter. Year-over-year comparisons are probably your best bet to start with. Way better than comparing this week to last week and thinking everything's fine. Trust me, context changes everything when you're trying to figure out if your performance actually sucks or not.
First thing - make sure it actually works on phones without that annoying side-scrolling thing. Big buttons are your friend since people use thumbs, not tiny mouse cursors. Put your most important numbers at the top because honestly, nobody scrolls much on mobile anyway. Speed matters way more than you think - anything over 3 seconds and people just give up. Oh, and definitely add offline caching so your team can still check stuff when the wifi's being weird. Push notifications for alerts are clutch, plus swipe gestures make switching between views way smoother. Test it on your own phone first to see what's broken.
-
Best Representation of topics, really appreciable.
-
Appreciate the research and its presentable format.