Ever felt like you're drowning in data, trying to make sense of the numbers to evaluate your project's success? You're not alone.
In a world where data is king, having a clear, concise, and effective evaluation dashboard is the difference between insight and overload. The latest trends show that well-designed dashboards improve decision-making speed by up to 70%! That's huge, right? Let's talk about the Evaluation Dashboard Template – a game-changer for those who need to track and assess project performance. Imagine having all key metrics, progress indicators, and data visualizations in one place, tailored to give you the insights you need at a glance.
Take, for instance, a recent case where a non-profit organization revamped its dashboard and saw a 30% increase in operational efficiency. They could instantly spot areas needing attention, celebrate wins, and strategize in real-time. That's the power of a good dashboard!
But how do you create one that works for you? It's all about customization, choosing the right KPIs, and keeping it user-friendly. Remember, a dashboard should simplify your life, not complicate it.
Evaluation Dashboard Templates for Transparent Insights
If you've been on the fence about setting up or revamping your evaluation dashboard, now's the time to dive in. The right dashboard can make your data work for you, not against you.
Building on this, we present our collection of Evaluation Dashboard Templates that businesses worldwide use. Let’s begin exploring these one by one.
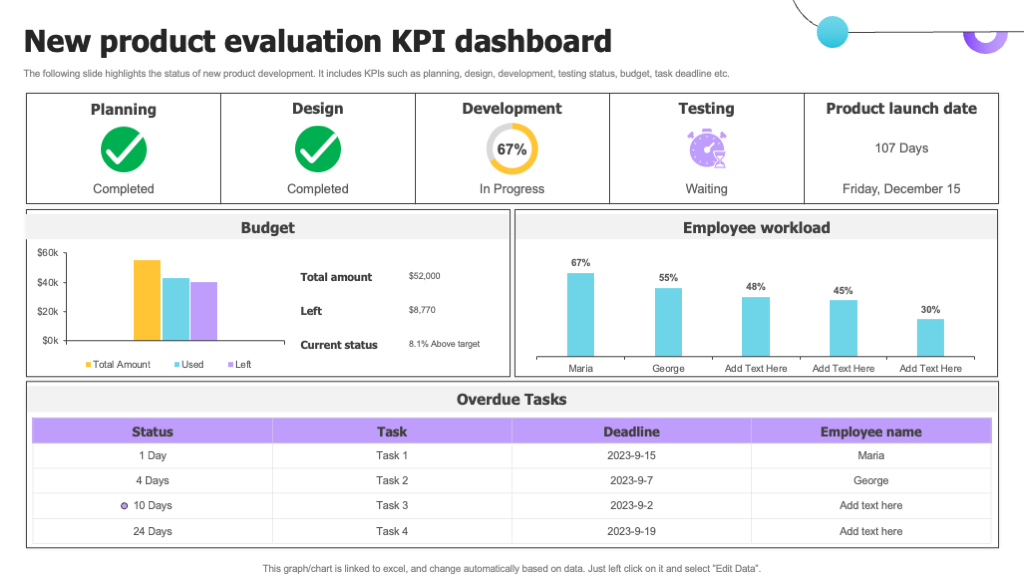
Template 1: New Product KPI Dashboard Template
This Evaluation KPI Dashboard offers up-to-the-minute Excel integration, allowing for automatic updates. Key sections include completed phases, development progress, budget tracking, task deadlines, and staff workload distribution. The visual layout uses progress indicators, budget graphs, and workload charts, making it easy to monitor and communicate the status of a product's development lifecycle up to launch. This PPT Template is perfect for project managers who need to present complex information in a simple way. Download now!
Template 2: Risk Evaluation Dashboard for Data Privacy
This detailed PowerPoint Template gives organizations an insider’s view of their data privacy risk landscape. It features vibrant graphics and a deep blue color scheme that enhances readability and focuses on key metrics. These are deviations, control maturity, DPIA progress, and GDPR processing by region. The data is presented through bar graphs, donut charts, and status indicators, enabling insights into audits, incidents, and compliance measures. It’s an essential tool for data protection officers and compliance teams to visualize and manage privacy risks. The design is both user-friendly and aesthetically pleasing, ensuring that the presentation of complex data remains engaging and accessible.
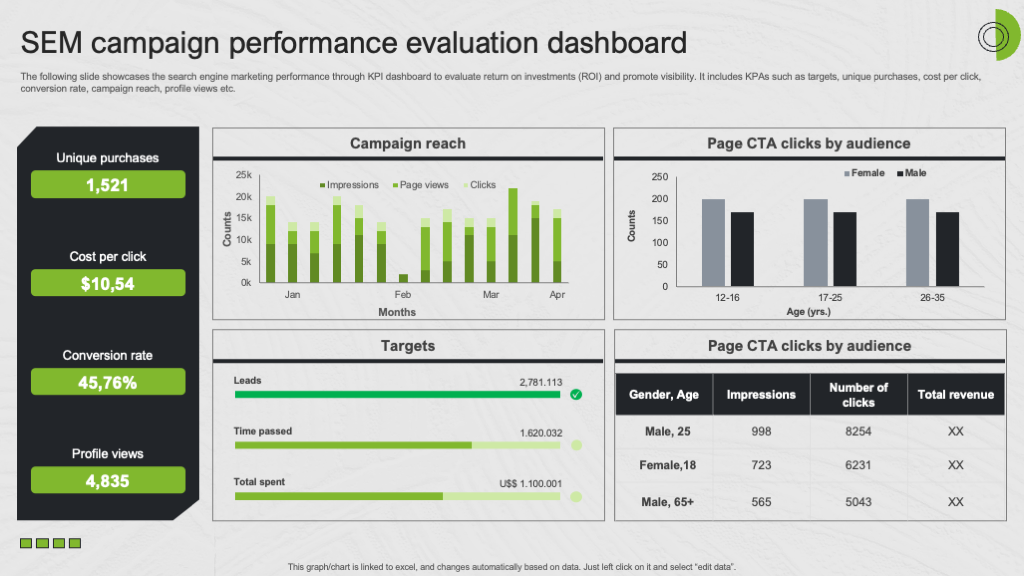
Template 3: SEM Campaign Performance Evaluation Dashboard
The PPT Dashboard is meant for marketers to track and analyze search engine marketing metrics. It summarizes crucial data points, including unique purchases, cost per click, conversion rate, and profile views. Key graphical elements include a campaign reach bar chart, cost metrics, conversion statistics, and demographic breakdowns of page CTA clicks, all presented in an engaging green and dark gray color palette. The design emphasizes ease of understanding with well-organized sections and vibrant, contrasting colors to differentiate between data types. The slide is ideal for presentations and quick decision-making. Get it now!
Template 4: Project Quality Assurance Strategy Evaluation Dashboard
Use this intuitive PowerPoint Template to represent metrics such as total evaluations, average team scores, perfect scores, and areas needing improvement, which makes tracking performance metrics a breeze. Its easy-to-read charts, including a top performer's bar graph and a pie chart detailing quality assurance from usage, turn complex data into actionable insights. This presentation template is ideal for project managers and quality assurance teams who must monitor and report on project performance. Employ it for data updates, ensuring your presentation is always up-to-date with minimal effort. Grab it now!
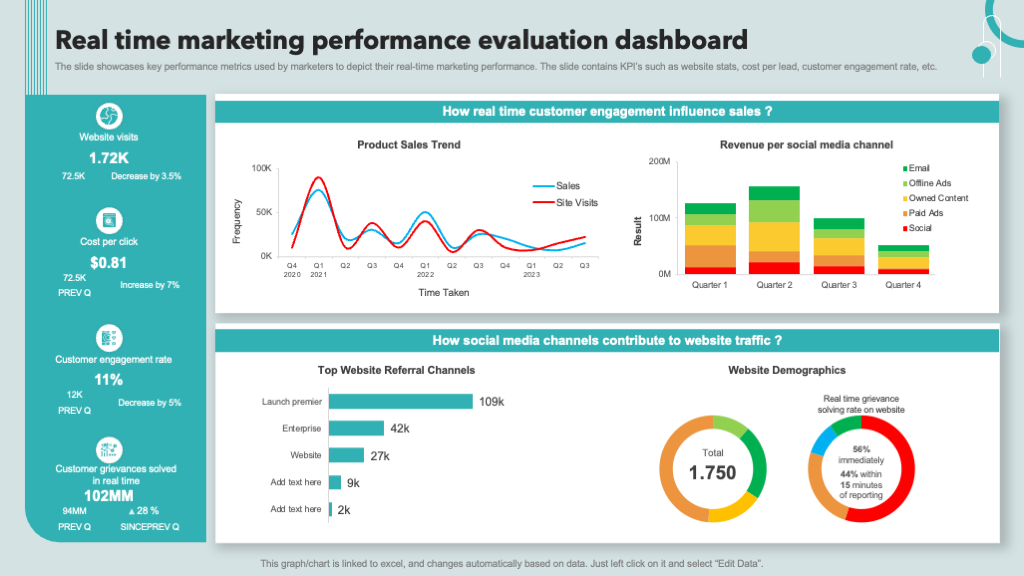
Template 5: Real-time Marketing Performance Evaluation Dashboard
Designed for data-driven marketers, this PPT Dashboard tracks website visits, cost per click, customer engagement, and instant grievance resolutions. The PowerPoint Template features a sales trend line graph correlating site visits with sales, a revenue breakdown by marketing channel, and a clear depiction of website referral sources and user demographics. It provides marketing performance across channels, helping teams make informed decisions. The design, with its clean lines and organized sections, enables easy data interpretation and ensures viewers can focus on the most critical KPIs. This template is a powerful tool for marketers aiming to optimize their strategies and demonstrate ROI in a clear, concise manner. Get it today!
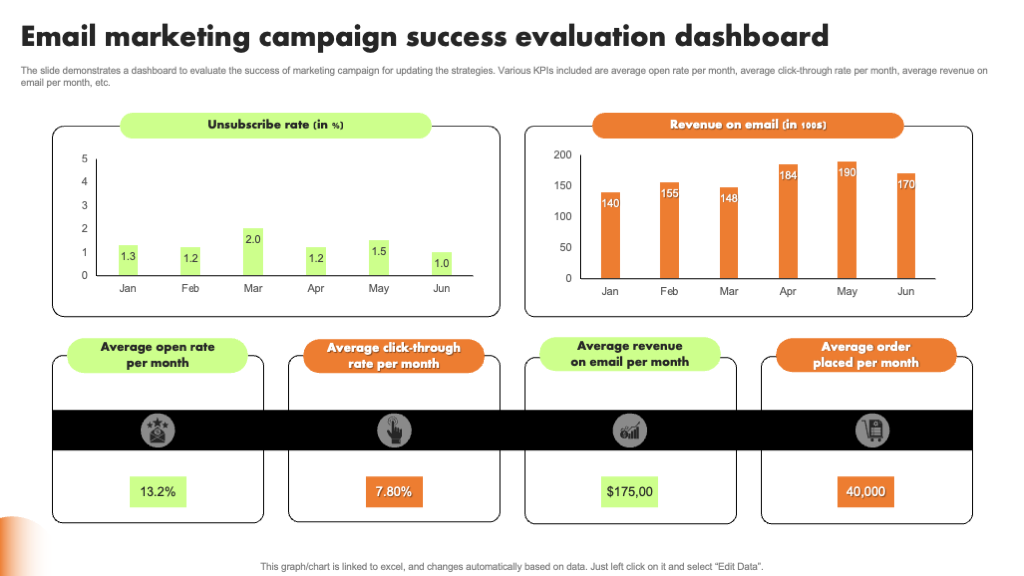
Template 6: Email Marketing Campaign Success Evaluation Dashboard
Deploy this engaging dashboard to track and analyze the effectiveness of email campaigns. It presents KPIs such as unsubscribe rates, open rates, click-through rates, average revenue generated per email, and average order quantity per month. Presented in a vivid color palette with clear, distinct sections, the PPT Template makes monitoring campaign trends and performance easy over time. Bar graphs and percentage indicators offer at-a-glance insights, crucial for quick strategy adjustments and reporting. This tool is essential for marketing professionals who require a straightforward yet comprehensive view of their email campaign's impact on sales and customer engagement. Their data always remains current through the template’s Excel link capabilities.
Template 7: Project Monitoring and Evaluation Dashboard
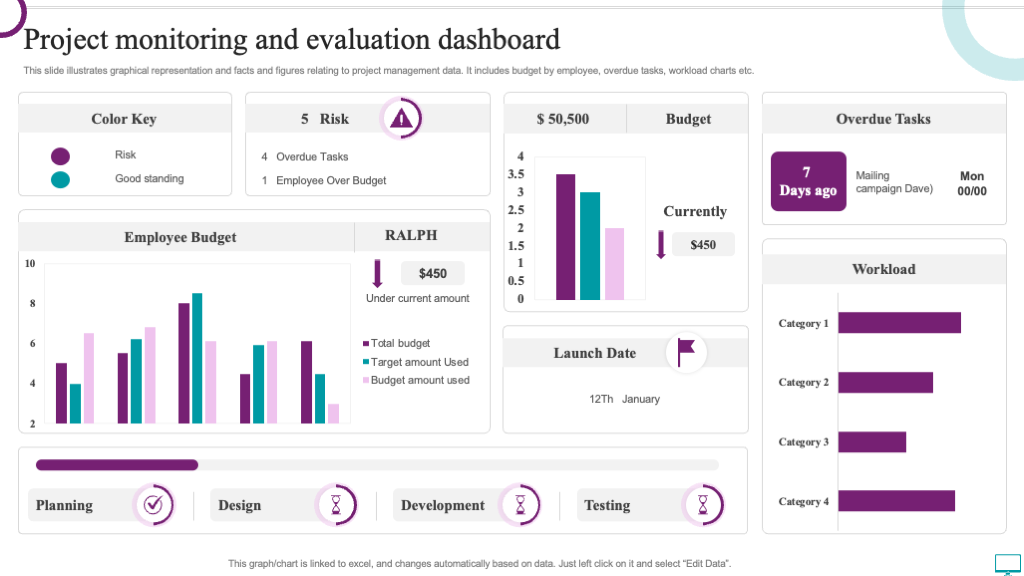
This template captures data on budget allocation by the employee, identifies risks, tracks overdue tasks, and monitors workload distribution, all within a single visual frame. Its design features a cohesive color scheme that differentiates between risk and good standing and uses bar charts and progress indicators. The dashboard facilitates precise project tracking, making it an indispensable tool for maintaining transparency and ensuring project success. The template is an excellent resource for project leads, allowing for proactive management and timely decision-making. Grab it now!
Template 8: Property Leasing Revenue Evaluation Dashboard
This PPT Dashboard is essential for property managers and real estate professionals. It provides a monthly snapshot of financial performance, showcasing a property revenue summary, current lease statuses, expiring leases, outstanding balances, and recent transaction activity. Its clear graphical representations, such as bar charts for revenue versus expenses and pie charts for lease expirations, allow for at-a-glance assessment of financial health. The presentation template highlights critical data points such as total properties managed, vacancies, and paid versus open invoices. It's an ideal solution for streamlining property management tasks, enhancing financial oversight, and improving strategic decision-making in the real estate market.
Template 9: Digital Marketing Performance Evaluation Dashboard
This dashboard provides a comprehensive overview of your monthly ad spend, conversions, cost per conversion, and click-through rates across major advertising platforms such as Google Ads, Facebook, and Instagram. The design of the PPT Template showcases easy-to-read charts that compare campaign performances and highlight trends. With this template, marketers can identify which channels offer the best return on investment, adjust strategies, and present their findings in an appealing and data-rich format. It's perfect for efficient, informed decision-making in fast-paced digital marketing environments. Download now!
Template 10: Student Performance Analysis Evaluation Score Dashboard
This multifaceted dashboard displays educational metrics, including average subject scores, student count by grade and gender, attendance rates, and examination results by branch. The intuitive design features a mix of gauge charts for individual subject scores, a pie chart for demographic distribution, bar graphs for exam performance, and a detailed table for individual student analytics. This template empowers educational staff to monitor progress, identify areas for improvement, and tailor instructional strategies to enhance learning outcomes. Download it today!
EVALUATE TO DRAW VALUE
In wrapping up, remember the wise words of management consultant Peter Drucker: "What gets measured gets managed." Our Evaluation Dashboard Templates embody this principle, providing a visual magic of data that speaks volumes at a glance.
By integrating these templates into your workflow, you're keeping up with the latest trends and setting the pace. You're committing to efficiency, clarity, and data-driven success. Join the ranks of successful teams that have transformed their project oversight with our Evaluation Dashboard Templates. Download them now and steer your project's journey from the depths of data overload to the heights of clear, actionable insights.
PS. If you are looking for Marketing Performance Dashboard Templates, here’s a handy guide with the most popular samples and examples.


 Customer Reviews

